Quantifying Shear Degradation and Fiber Breakdown in Mold Tooling
Quantifying shear rates and gate geometry limits prevents fiber length attrition, tool surface erosion, and mechanical strength loss in molded composite parts.
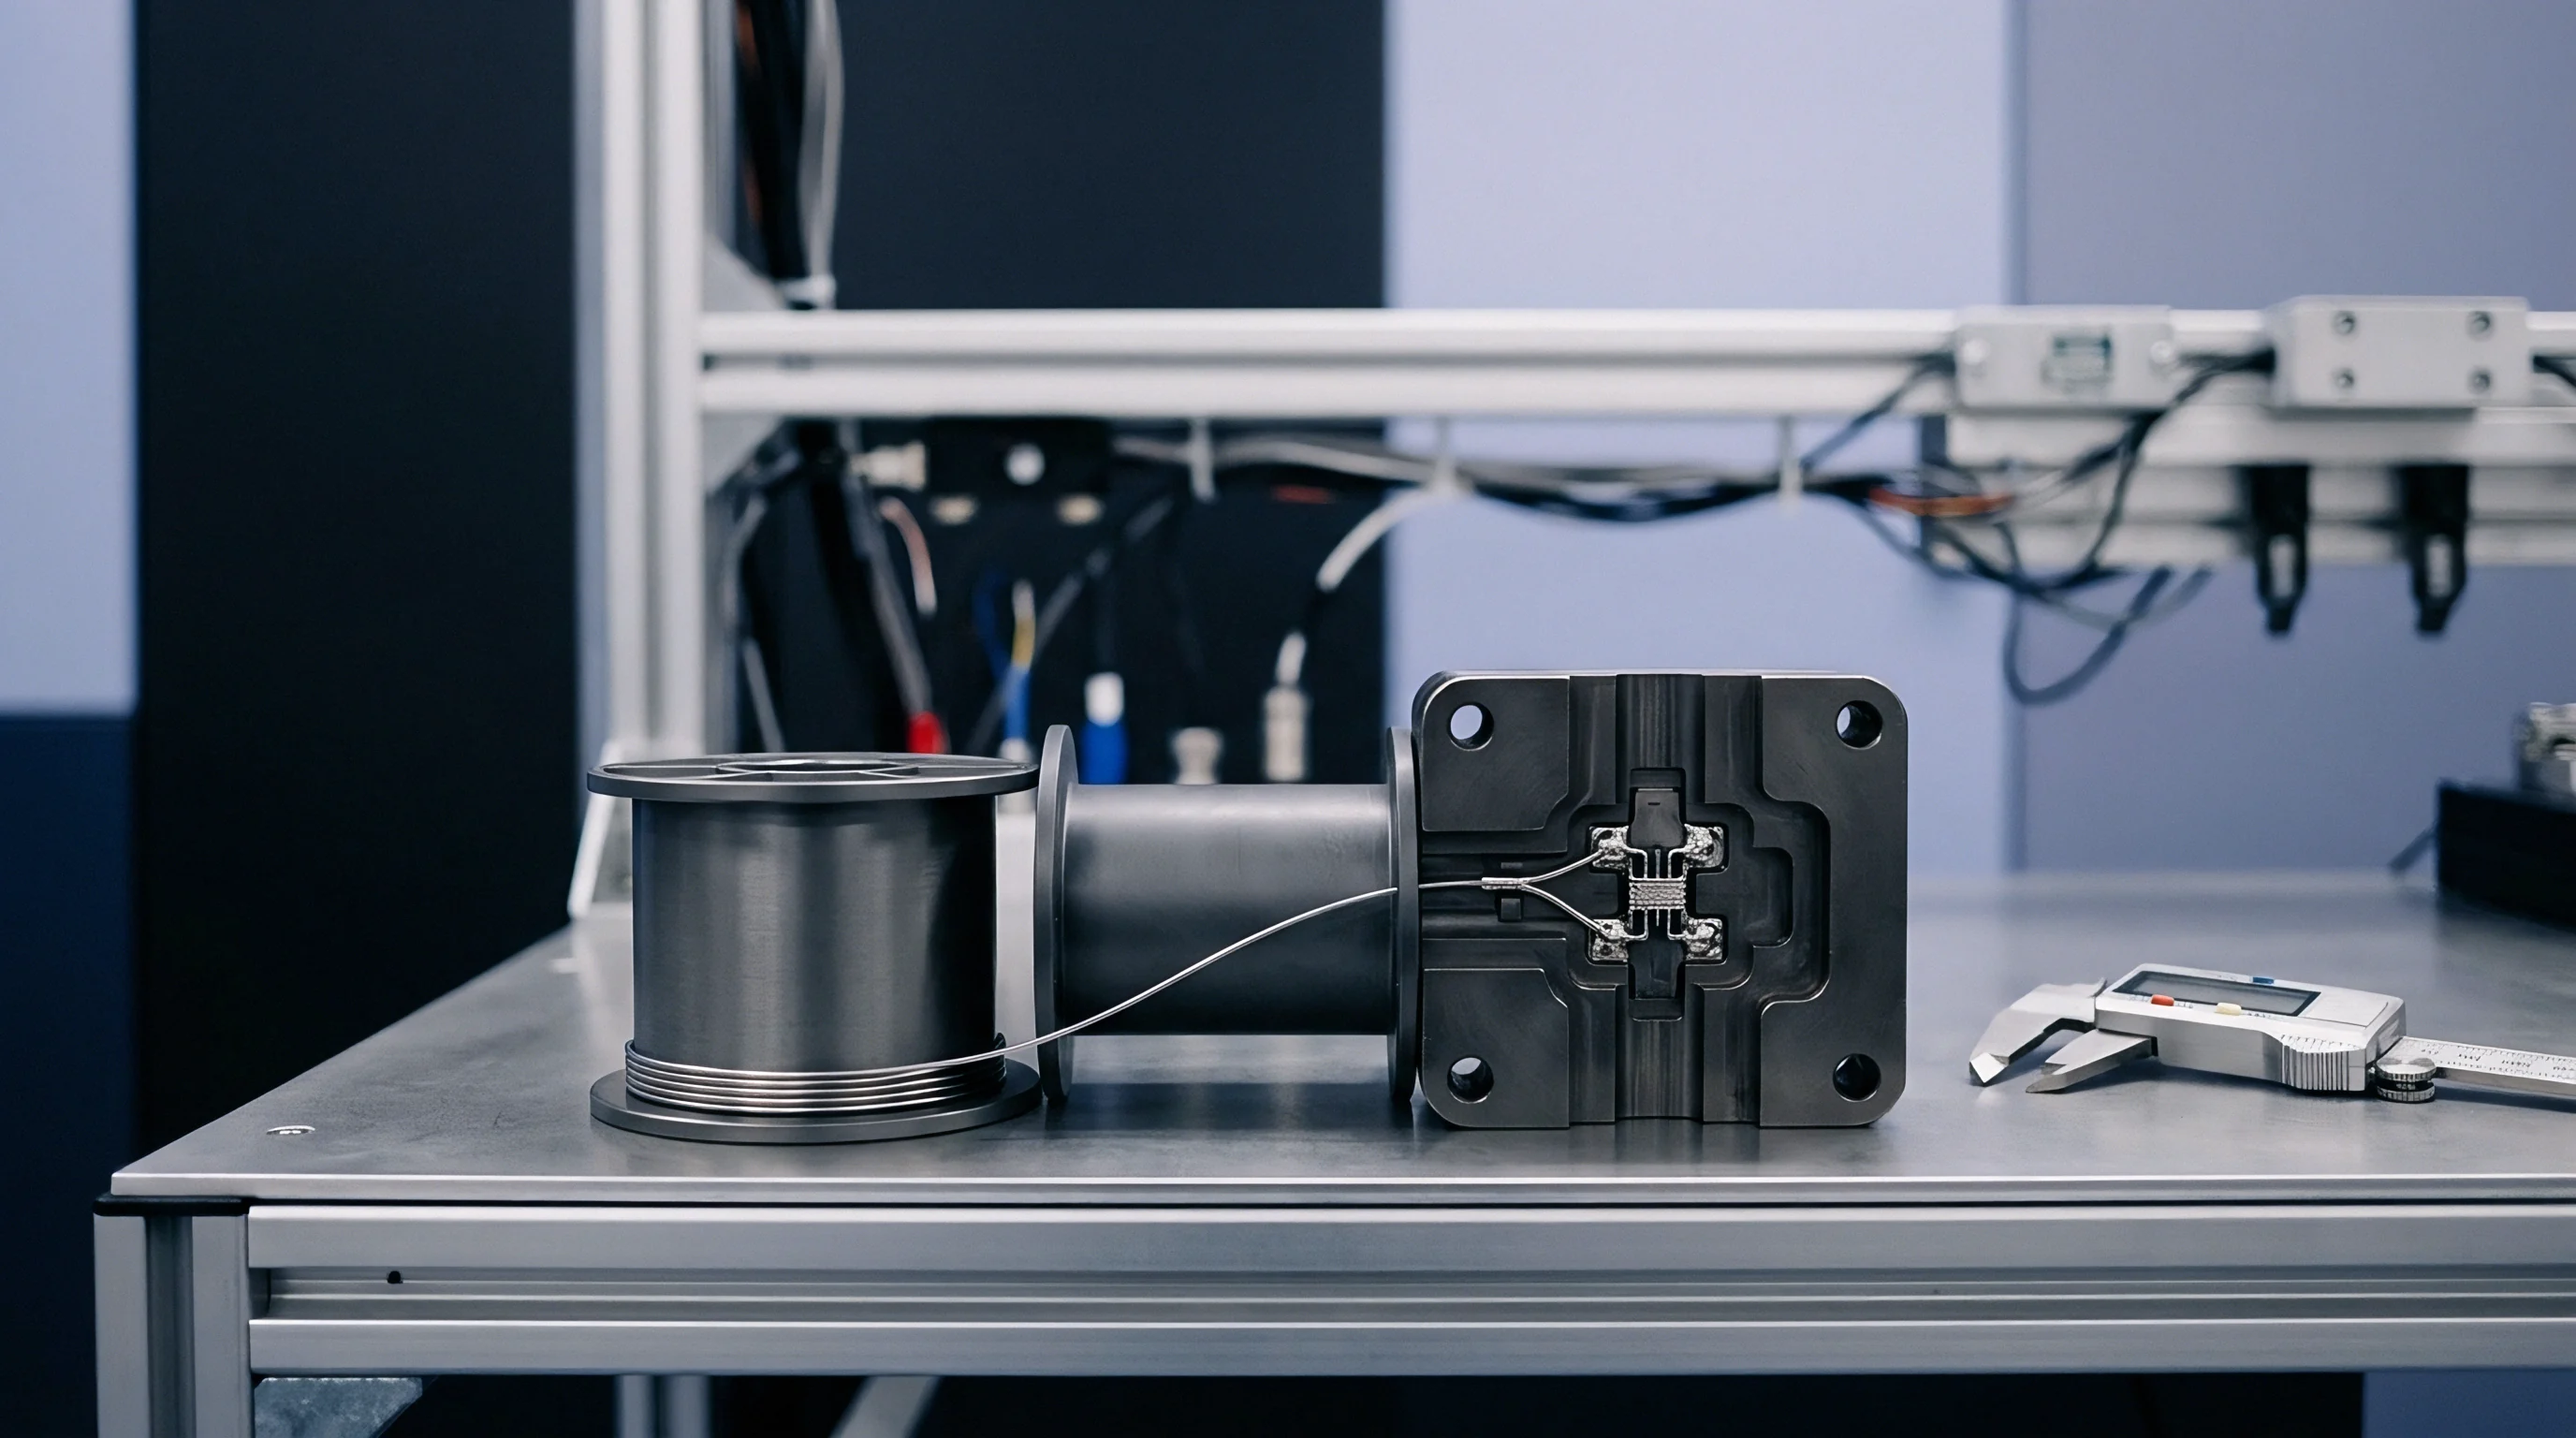

Rheology
Molding fiber-reinforced thermoplastics generates hydrodynamic forces that deform both the polymer matrix and the suspended fibers. Inside the plasticizing unit and mold cavity, the non-Newtonian melt encounters steep velocity gradients. Viscous drag scales with the local shear rate, building stress tensors along tool walls.
Long glass or carbon fibers in matrices like polyamide 66 or polyether ether ketone align quickly with flow streamlines, though this carries a cost: when velocity differentials across a fiber’s length exceed its flexural yield strength, the filament breaks.
Polymer chains undergo high strain rates under processing conditions. Flow follows non-linear rheological models, with viscosity dropping as shear rates increase according to the Cross-WLF formulation. As melt passes through thin wall sections and narrow runners, shear stress generates significant viscous dissipation heating.
Local temperature spikes alter viscosity and shift mechanical energy transfer directly into embedded fibers. Higher initial melt viscosity transfers greater force into the fiber network, increasing damage during cavity filling.
Shear rate governs how severely fibers shorten during injection. Near the cavity wall, the fluid field creates steep velocity gradients, forming a thin shell layer where fibers endure high bending moments. The central core experiences minimal velocity differential, leaving longer fiber structures intact.
Because orientation drives mechanical anisotropy, this non-uniform distribution across part thickness creates spatial variations in tensile strength, thermal expansion, and impact tolerance.
| Polymer Matrix | Fiber Type and Load | Processing Temperature Range (C) | Critical Shear Rate (1/s) | Zero-Shear Viscosity (Pa-s) |
|---|---|---|---|---|
| Polyamide 66 (PA66) | 30% Short Glass Fiber | 285 – 310 | 15,000 | 320 |
| Polyether Ether Ketone (PEEK) | 30% Carbon Fiber | 370 – 400 | 8,000 | 850 |
| Polyphenylene Sulfide (PPS) | 40% Glass Fiber | 300 – 330 | 12,000 | 210 |
| Polybutylene Terephthalate (PBT) | 30% Glass Fiber | 250 – 275 | 18,000 | 180 |
Quantifying these shear fields requires measuring dynamic viscosity variations across operational shear rates from 1,000 to 100,000 reciprocal seconds. High-pressure capillary rheometry isolates true shear stress by applying Bagely end-corrections and Rabinowitsch velocity profile adjustments. Standard rotational rheology breaks down at these rates because centrifugal forces sling filled resin out of the measuring gap.
Using capillary test dies with low length-to-diameter ratios captures entry pressure loss, exposing the extensional stresses that break fibers before they reach the cavity.
Melt compression in the barrel introduces another variable. Elevated hydrostatic pressure increases density and viscosity, lowering the threshold for damaging shear stress. When processing carbon-fiber reinforced PEEK, high cavity pressure paired with narrow runners can push wall shear stress above 0.5 MPa.
This condition degrades high molecular weight polymer chains while snapping high-modulus carbon fibers into low-aspect fragments. Controlling melt front velocity keeps local wall shear rates within safe operational bounds.
Viscous heating alters the thermal boundary layer along the tool surface. Cold walls freeze an outer polymer skin, narrowing the flow channel and driving up core fluid velocity. This restriction increases effective shear rates without any adjustment to the machine’s injection speed setting.
Tooling engineers must account for this transient boundary layer growth when calculating pressure drops and shear stress limits.
Keeping shear stress low preserves longer average fiber lengths throughout the mold cavity.

Attrition
Fiber breakdown is cumulative, occurring continuously during material handling, plasticizing, and cavity filling. The structural contribution of glass and carbon reinforcement depends on maintaining a high aspect ratio ~ the ratio of fiber length to diameter. Initial fiber lengths in raw virgin pellets range from 2.0 to 5.0 millimeters for short-fiber compounds, whereas long-fiber pellets match the pellet length itself, typically 11.0 to 25.0 millimeters.
By the time the melt reaches the outer edges of the cavity, hydrodynamic drag, screw shear, and restrictive tooling geometry reduce median fiber length to a fraction of its starting size.
Fiber attrition stems primarily from fiber-to-fiber collisions, wall impacts, and bending induced by fluid shear. Hydrodynamic forces flexing a rigid filament create a bending stress profile that peaks at its midpoint. Once this bending moment exceeds the flexural strength of the glass or carbon strand, brittle fracture breaks the filament cleanly in half.
This midpoint snapping shifts the overall length distribution downward, quickly turning long reinforcing fibers into short fragments with little capacity for load transfer.
Peak shear stress exceeding 0.35 MPa at the gate entrance reduces median glass fiber length by 62 percent compared to the raw pellet stock.
Predictive models for fiber breakdown rely on kinetic breakage equations tied to local shear strain and matrix viscosity. Fracture probability scales with matrix shear stress, fiber diameter to the fourth power, and current fiber length to the fourth power. Sensitivity is extreme: doubling the initial fiber length makes a filament sixteen times more susceptible to rupture under identical shear fields.
As a result, the initial plasticizing phase produces the highest rate of fiber attrition.
Processing 30 percent glass-reinforced PA66 through an unoptimized cold runner mold reduced median length from 3.2 millimeters to 0.24 millimeters. The corresponding aspect ratio fell from 320 to 24, dropping below the critical threshold required to transfer stress across the polymer-fiber interface. Tensile yield strength fell 28 percent compared to parts molded with an optimized, large-radius runner system.
Elastic modulus declined similarly, demonstrating how directly structural performance tracks fiber degradation kinetics.
Impact strength is especially sensitive to aspect ratio loss. Unnotched Charpy impact resistance drops exponentially once mean fiber length falls below 0.4 millimeters. Micro-cracks propagate unchecked through the resin when fibers are too short to bridge crack tips and absorb energy via pull-out.
Longer fibers absorb mechanical energy by sliding out of the matrix under tension; short, severely degraded fibers simply snap, leading to brittle failure under sudden loads.
Assessing damage requires looking beyond mean length alone, as the full fiber length distribution dictates final material properties. A profile skewed toward ultra-short fragments carries a high density of fiber ends, which act as local stress concentrators in the polymer matrix. Proper numerical characterization requires calculating both number-average and length-average fiber lengths to track changes in polydispersity across processing stages.
Ignoring fiber breakdown in mold flow simulations can lead to overestimating final part tensile performance by up to 35 percent.


Gate
Runner channels and gates form severe high-shear zones that largely dictate fiber survival during injection. Transitioning from a thick runner into a constricted gate creates intense converging flow. Accelerating the melt through restricted cross-sections can drive local shear rates past 50,000 reciprocal seconds in standard tooling.
These sharp velocity gradients create high extensional strain, snapping long fibers just as they enter the cavity.
Submarine gates, pin gates, and small edge gates cause severe fiber attrition. Rapid flow convergence forces suspended fibers to rotate abruptly, creating high bending moments when one end accelerates while the other remains in slower fluid. Rectangular fan gates and direct sprue gates lessen this damage by spreading the transition over a larger cross-section, smoothing velocity steps and keeping local shear stress manageable.

How Does Gate Cross Section Geometry Shift Fiber Length Distribution?
Gate thickness is the primary variable controlling local shear rates during cavity filling. In a rectangular gate, shear rate varies inversely with the square of gate depth. Halving gate depth from 1.5 millimeters to 0.75 millimeters quadruples the local shear rate at a constant volumetric flow rate.
This shift moves peak shear stress directly into the core of the entering melt, fracturing fibers uniformly across the material front.
Runners with sharp 90-degree turns worsen mechanical breakdown. Flow separation at sharp elbows creates localized recirculation zones, subjecting melt and fibers to extended shear exposure. Smooth, parabolic transitions help maintain fiber length by removing abrupt velocity differentials.
Positioning cold slug wells at runner junctions captures initial cold material, preventing stiff plugs from blocking gates and causing pressure spikes.
- Gate Land Length Excess extends residence time under peak shear, accelerating matrix-fiber separation and core breakdown.
- Unbalanced Runner Geometry causes uneven shear rates in multi-cavity tools, creating fiber length variations from cavity to cavity.
- Sharp Gate Junctions produce localized extensional stress that snaps high-modulus carbon fibers before they enter the cavity.
- Sub-Optimal Gate Thickness forces machines to run higher hydraulic pressure, raising overall stress across the melt.
Valve-gated hot runners create dynamic shear environments. The annular space around the valve pin restricts flow, generating intense shear as the needle actuates. Controlling the pin opening profile dampens initial velocity spikes, protecting fibers during early gate opening.
Precise regulation of pin motion prevents localized degradation and avoids shear damage during rapid molding cycles.
Molders often blame resin lot variation for part failure when narrow gates are actually destroying the fiber network.
Erosion
Processing fiber-filled thermoplastics subjects tooling to continuous abrasive wear. Embedded fibers act like micro-cutting tools against cavity surfaces. Glass fibers have a Mohs hardness of 6.5, well above that of untempered tool steel.
As the high-velocity melt sweeps across core pins, gate lands, and cavity walls, exposed fiber ends gouge the steel surface, causing micro-plowing, fatigue, and gradual metal removal.
Micro-abrasion accelerates in high-shear zones where fluid pressure forces fibers directly against tool surfaces. Gate entries, leading edges of core pins, and flow deflectors suffer heavy surface degradation. Micro-cutting strips oxide layers off the steel, exposing fresh metal to continuous erosion.
Over extended runs, this wear enlarges gate dimensions, altering shear calculations and drifting the validated process window.
| Tool Steel Grade | Hardness (HRC) | Vanadium Carbide Vol. (%) | Relative Wear Rate Index | Machining Cost Factor |
|---|---|---|---|---|
| AISI H13 Tool Steel | 48 – 52 | 0.5 | 1.00 | 1.0x |
| AISI S7 Tool Steel | 54 – 58 | 0.1 | 1.35 | 0.9x |
| CPM 10V Powdered Metal | 58 – 62 | 9.7 | 0.12 | 2.8x |
| CPM 15V Powdered Metal | 60 – 64 | 14.5 | 0.06 | 3.5x |
| Tungsten Carbide Insert | 72 – 76 | N/A (Sintered) | 0.01 | 6.0x |
Steel selection determines tool lifespan when running abrasive compounds. Standard AISI H13 offers good toughness, but its low carbide volume fraction makes it wear quickly under continuous exposure to 30 percent glass fiber. Powder metallurgy steels such as CPM 10V contain high concentrations of vanadium carbides, offering strong resistance to micro-abrasive plowing while preserving dimensional stability under thermal cycling.
Surface coatings offer a secondary defense against physical wear. Physical Vapor Deposition places hard films like Titanium Aluminum Nitride or Diamond-Like Carbon onto finished cavity surfaces. These coatings, typically 2 to 5 micrometers thick, boost surface hardness above 3,000 Vickers.
The low friction coefficient of Diamond-Like Carbon also lowers wall shear stress, reducing tool wear while mitigating fiber damage inside the boundary layer.
Tooling surfaces treated with Physical Vapor Deposition coatings display an eightfold reduction in gate erosion depth over 500,000 production cycles.
Tracking mold erosion calls for systematic inspection throughout production. Optical profilometry maps surface micro-topography to measure changes in roughness and track wear along flow channels. Non-contact laser scanning measures gate expansion without damaging tool steel features.
Catching gate wear early prevents out-of-spec parts caused by shifting fill dynamics.
- Mount the target insert in a high-resolution white-light optical profilometer to capture baseline surface topography before production starts.
- Run a 50,000-cycle production molding trial with the specified glass-reinforced compound under standard processing parameters.
- Clean the inserts in an ultrasonic solvent bath to remove residual polymer deposits from surface micro-features.
- Re-scan gate entry zones and core pin boundaries, recording 3D surface height matrices across the original spatial coordinates.
- Subtract baseline elevation matrices from post-run scans to calculate localized volume loss, micro-plowing depth, and peak profile changes.
As erosion expands tool dimensions, local shear stress drops, altering fiber length distributions over the life of the tool. How does a production plant maintain mechanical consistency when gate wear continuously shifts shear dynamics across a two-million-shot run?

Audit
Verifying fiber degradation and tool wear requires testing on both molded parts and tooling components. Surface visual inspection cannot detect microstructural damage hidden inside fiber-reinforced matrices. Quality assurance relies on matrix burn-off, optical length measurement, micro-computed tomography, and targeted mechanical testing to verify processing quality against material specs.
High-temperature burn-off testing separates glass fibers from the organic matrix. Samples sectioned from key part areas undergo pyrolytic decomposition in a muffle furnace at 560 C per ASTM D5630. The remaining fibers are dispersed in a liquid medium using gentle ultrasonic agitation to prevent secondary breakage.
Automated optical microscopy then scans thousands of loose fibers, measuring lengths to build a statistically valid length distribution.
| Sample Sampling Location | Number Average Length Ln (mm) | Weight Average Length Lw (mm) | Tensile Modulus (GPa) | Unnotched Impact (kJ/m2) |
|---|---|---|---|---|
| Virgin Feedstock Pellets | 0.85 | 1.42 | 9.8 | 65 |
| Post-Plastification Barrel Melt | 0.52 | 0.88 | 9.2 | 52 |
| Main Runner Output Channel | 0.41 | 0.69 | 8.7 | 44 |
| Post-Gate Cavity Entry Zone | 0.22 | 0.38 | 7.6 | 28 |
| End of Fill Boundary Wall | 0.18 | 0.29 | 7.1 | 22 |
Volumetric micro-computed tomography offers non-destructive 3D visualization of composite internal structures. X-ray micro-CT captures spatial orientation tensors and fiber breakage directly inside intact molded parts. This preserves internal orientation profiles, mapping local aspect ratios across gates, weld lines, and flow boundaries.
Segmentation algorithms separate individual fibers even in dense 30 percent loaded systems, yielding detailed data on local microstructural health.
Mechanical testing confirms the findings from optical and X-ray fiber analyses. Tensile testing per ISO 527 measures ultimate tensile strength and elastic modulus, highlighting performance losses from matrix degradation or shortened aspect ratios. High-rate instrumented impact testing measures energy absorption to verify fiber pull-out behavior.
A part showing poor impact strength despite correct matrix density points straight to excessive shear degradation during molding.
ISO 22314 mandates reporting both number-average and weight-average fiber lengths to prevent statistical skewing from ultra-fine glass dust fragments.
- Number Average Length Metric divides the sum of measured lengths by total count, reflecting population shifts across all fragments.
- Weight Average Length Metric places greater weight on longer fibers, tracking closely with flexural modulus and tensile strength.
- Polydispersity Ratio Calculation divides weight-average by number-average length, measuring distribution breadth and degradation severity.
- Critical Aspect Ratio Threshold defines the minimum fiber length required for effective load transfer across the matrix-fiber interface.
In-line cavity pressure monitoring acts as a real-time audit during production. Piezoelectric sensors positioned behind gate lands detect viscosity shifts during cavity filling. A drop in required injection pressure at constant flow rate signals gate erosion, while pressure spikes point to gate blockage or cold-slug shear spikes.
Automated systems flag and reject parts produced outside established pressure integral limits.
Supply contracts often include audit clauses specifying that components with a weight-average fiber length below 0.35 millimeters fail mechanical compliance, regardless of whether external dimensions are within tolerance.

Contract
Commercial agreements between OEMs and contract molders rely on clear technical definitions within Statements of Work and Master Service Agreements. Broad statements about part strength or tool life invite costly disputes when components fail in service. Procurement and engineering teams need to specify maximum allowable fiber degradation, tool wear limits, and verification methods before issuing tooling purchase orders.
Tool life guarantees should tie shot counts directly to specific resin formulations and fiber loadings. A mold rated for 1,000,000 shots in unfilled polypropylene will experience severe erosion failure before 250,000 shots if run with 40 percent glass-filled PBT. Contracts need to outline mandatory insert replacement intervals, gate maintenance schedules, and steel grades matched to the abrasiveness of the specified compound.
A dual-sourcing program requiring identical mechanical performance from two separate molding suppliers highlighted these variations. Transferring tooling between plants initially resulted in a 30 percent difference in impact strength, despite identical cavity drawings. Root-cause analysis showed the second facility was using smaller nozzle orifices and higher injection speeds, creating excessive shear stress that degraded weight-average fiber length below spec.
Standardizing shear rate boundaries and process parameters across both sites eliminated the variance and restored property parity.
Tool life guarantees are legally void unless processing logs demonstrate that cavity shear rates remained below agreed technical thresholds.
Engineering change order procedures should govern modifications made to address shear issues during tool commissioning. Opening up gate cross-sections or thickening runners reduces shear stress and preserves fiber length, but it also alters sink marks, cycle times, and shot weight. Contracts should explicitly assign financial responsibility for tool modifications needed to hit required fiber length targets following initial sampling.
First article approval packages should include complete fiber length distribution reports, micro-CT orientation data, and destructive mechanical test results. Supplier quality teams maintain batch traceability for filled materials, connecting resin lot certifications directly to process logs and cavity pressure curves. This chain of documentation helps prevent disputes over root cause if parts fail during assembly or field service.
Defining shear limits, inspection protocols, and material-specific tooling guarantees up front protects project economics and ensures predictable mechanical performance throughout the product’s life cycle.