Evaluating Standalone Specific Absorption Rates for Low Power Radios
Low power radio SAR compliance relies on calculating source-based time-averaged radiated power against regional exemption limits before committing to phantom tests.

Threshold
Operating Power Limits for Standalone Radios
Standalone specific absorption rate reviews hinge on whether a device clears the threshold for exemption from phantom testing. For transceivers running Bluetooth Low Energy, Zigbee, or proprietary sub-gigahertz stacks, operating levels are often low enough that tissue absorption cannot be reliably measured. The Federal Communications Commission formalizes this exemption in 47 CFR 1.1307(b)(3)(i)(B) and KDB 447498 D04 through a sliding calculation based on operating frequency and distance to the user.
At 2.45 GHz and a 5 mm separation distance ~ typical for handheld gear and body-worn housings ~ the ceiling for time-averaged radiated power sits at 2.72 mW, or 4.35 dBm. Clear that number, and the radio bypasses physical fluid measurements entirely. Exceed it, and the assembly goes into a liquid phantom tank.
Conducted peak power often gets conflated with the compliance metric itself, but regulators evaluate source-based time-averaging across the finished product’s active cycle. A Bluetooth transceiver pushing +8 dBm conducted peak into an integrated 1.5 dBi trace antenna delivers an effective isotropic radiated power of 9.5 dBm, roughly 8.91 mW. Transmitted continuously, that setup overshoots the 2.72 mW limit and forces chamber testing.
Set that same BLE radio to a 20 percent transmission duty cycle in firmware, however, and the time-averaged radiated output drops to 1.78 mW. That places the device under the 2.72 mW boundary, avoiding the probe test.
A 2.45 GHz transmitter operating 5 mm from human tissue qualifies for SAR exemption when time-averaged radiated power stays below 2.72 mW.
The calculation in FCC KDB 447498 D04 scales exponentially from 5 mm out to 40 mm. Below 5 mm, the formula clamps distance at 5 mm, preventing zero-distance calculations from yielding fractional micro-watt limits. In Europe, CENELEC oversees human exposure under EN 50663 and EN 62479.
The European Union uses a flat 20 mW average radiated threshold across 10 MHz to 300 GHz for general public exposure at close proximity, with no sliding distance curve. Equipment certified under Radio Equipment Directive 2014/53/EU satisfies exposure rules through basic documentation as long as time-averaged power remains below 13 dBm. Overlooking the gap between these regional limits can stall a global rollout before firmware is locked down.
Blowing past an exclusion threshold adds immediate overhead. Documenting an administrative exemption from bench measurements and duty-cycle logs runs between 1,200 and 2,500 USD per interface. Full dosimetric scans using robotic probes across flat, head, and limb phantoms cost between 6,000 and 15,000 USD per band.
Sourcing teams track these module outputs early to keep unbudgeted chamber visits off the schedule.

Airtime
Source Based Averaging across Industrial Protocols
Regulatory agencies evaluate exposure across averaging windows reaching up to six minutes to track heat accumulation in tissue. Because short-range wireless links transmit in bursts punctuated by sleep and receive states, source-based averaging lets an engineering team distribute active airtime over that window, bringing calculated output below the SAR threshold. Meeting the limit comes down to locking packet sizes, interval timing, and retry counts directly into non-volatile firmware registers.
Bluetooth Low Energy illustrates how airtime limits shift the calculation. Under the Bluetooth core spec, an advertising beacon cycles across channels 37, 38, and 39. A standard 37-byte advertising packet takes about 376 microseconds on-air at 1 Mbps PHY.
Hitting all three channels accounts for 1.13 milliseconds of total RF output. At a standard 100 milliseconds advertising interval, the transmitter radiates for 1.13 percent of the period. A conducted output of +10 dBm, or 10 mW, drops to an effective time-averaged level of 0.113 mW, well below international SAR exemption ceilings.
Under FCC KDB 447498 D04, source-based time averaging calculates exposure over the maximum transmission window defined strictly by firmware architecture.
Unsynchronized industrial links, however, shift duty cycles based on external events. Sourcing teams writing node specifications have to hard-code mandatory delays into the MAC layer. An 868 MHz or 915 MHz proprietary FSK radio sending 50-byte packets at 50 kbps stays on air for 8 milliseconds per burst.
If interference causes five immediate retransmissions, airtime hits 40 milliseconds. Over a 100-millisecond window, that is a 40 percent duty cycle. Pairing that profile with a +14 dBm amplifier sending 25 mW into a unity-gain loop yields 10 mW average power, breaching sub-gigahertz exemption thresholds.
The table below summarizes packet durations, standard operational intervals, and calculated duty cycles across widespread low power short-range protocols:
| Protocol and Physical Layer | Transmit Power (dBm) | Airtime per Packet (ms) | Burst Interval (ms) | Calculated Duty Factor (%) | Time-Averaged Power (mW) |
|---|---|---|---|---|---|
| BLE 1M Advertising (3 Channels) | +8.0 | 1.13 | 100.0 | 1.13 | 0.071 |
| BLE 2M Data Stream (Full Buffer) | +4.0 | 1.06 | 7.5 | 14.13 | 0.355 |
| Zigbee IEEE 802.15.4 (250 kbps) | +10.0 | 4.25 | 50.0 | 8.50 | 0.850 |
| LoRa EU868 SF7 (125 kHz Bandwidth) | +14.0 | 41.20 | 1000.0 | 4.12 | 1.035 |
| LoRa US915 SF10 (125 kHz Bandwidth) | +20.0 | 370.70 | 10000.0 | 3.71 | 3.710 |
The duty cycle reported in a compliance dossier must match hard firmware limits. Certification labs inspect whether host software can bypass these delays via open API calls. Claiming an exemption on a five percent duty factor requires submitting audited binaries to confirm the restriction cannot be altered in the field.
Separation
Tissue Interaction across Mechanical Spacers
Near-field RF energy falls off steeply just outside the antenna structure. When an antenna rests directly on skin, tissue acts as a lossy dielectric load, shifting the resonant frequency and dumping energy into water content. Because physical SAR is sensitive to distance, adding two millimeters of enclosure wall significantly cuts absorption per gram of tissue.
Mechanical layouts and board stackups depend on that buffer between the radiator and the outer casing.
Sub-gigahertz designs detune noticeably near the body. A 915 MHz quarter-wave trace on standard FR4 shows a clean 50 ohms match in free air. Move it within 2 mm of tissue ~ with a relative permittivity near 55 and conductivity around 0.94 S/m ~ and resonance pulls toward 860 MHz.
Return loss degrades from -18 dB to -3 dB, reflecting roughly 50 percent of the amplifier’s power back into the circuit. That reflection cuts link range while concentrating reactive near-field energy in the adjacent tissue.
How Does Trace Topology Alter Peak Energy Absorption?
Antenna geometry dictates how energy distributes across an automated probe scan. Standard monopoles and inverted-F designs concentrate intense electric fields at their open tips. If that tip sits flush against an enclosure surface touched by the user, localized SAR spikes.
Meandered planar inverted-F antennas spread current across a wider copper area, lowering peak absorption for the same total radiated power. Ceramic patch antennas draw fields into their high-dielectric substrate, reducing external near-field spread.
- Ceramic chip antennas provide stable impedance loading under variable hand proximity, sacrificing total radiation efficiency to prevent extreme near-field hot spots.
- Printed inverted-F antennas generate distinct peak electric fields at the open conductor terminus, demanding careful placement away from anticipated enclosure contact zones.
- Wire-formed helical structures produce balanced magnetic field coupling in the reactive zone, dropping dielectric tissue loading across body-worn applications.
- Slot radiators in ground planes distribute high surface currents across the broad PCB ground copper, spreading thermal absorption over larger surface areas.
Enclosure resins alter both dielectric loading and physical clearance. Common injection-molded plastics like ABS and polycarbonate carry relative permittivity between 2.5 and 3.0 with minimal loss tangents. Increasing wall thickness from 1.0 mm to 2.5 mm provides reliable physical spacing, preventing localized near-field peaks from reaching surface tissue.
Leaving clearance tolerances ambiguous on mechanical drawings invites compliance problems later. Opening an injection mold to add 1.5 mm of internal standoff can easily exceed 20,000 USD once the tooling is hardened. Antenna placement and internal air gaps need to be frozen during prototype design.


Phantom

Automated Dosimetric Scanning Mechanisms
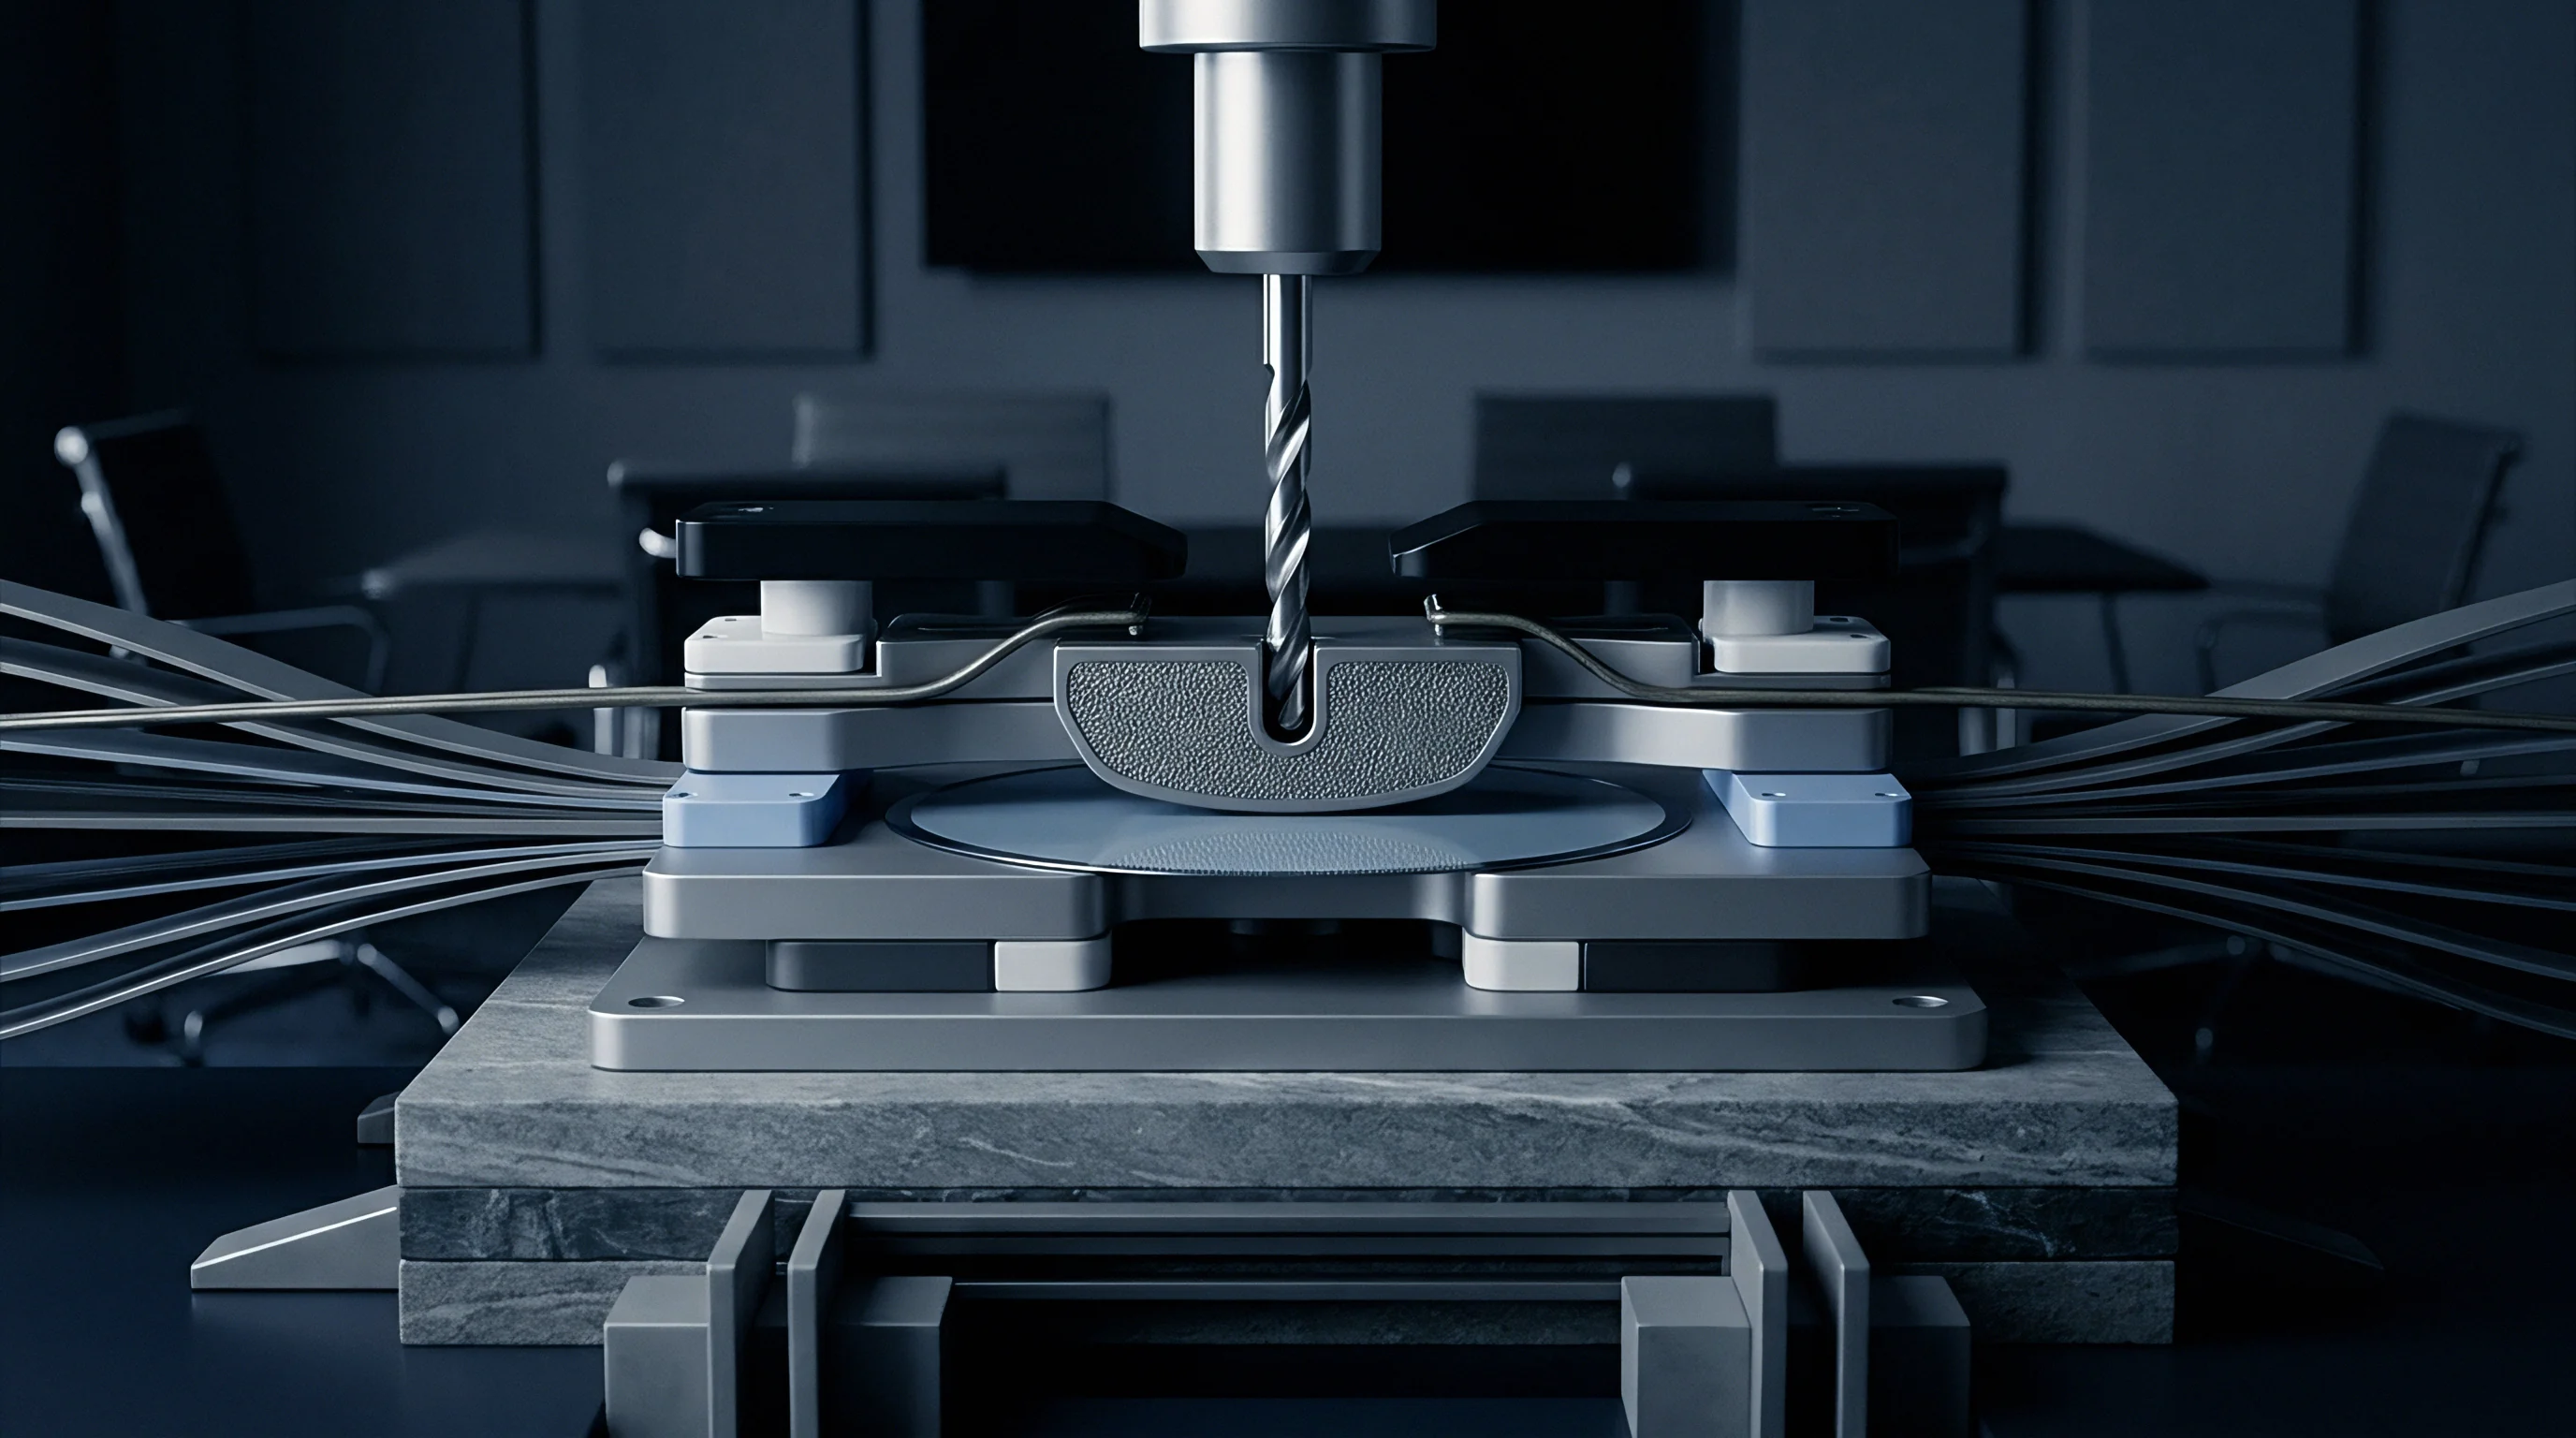
Transceivers exceeding mathematical thresholds require validation using robotic measurement arms and standardized body models. The apparatus uses low-loss fiberglass shells filled with tissue-simulating fluid formulated to match the permittivity and electrical conductivity of human tissue at the test frequency. For 2.45 GHz runs, regulations require fluid permittivity held between 39.2 and 40.0, with conductivity adjusted to 1.80 to 1.85 S/m at an ambient 22 degrees Celsius.
Testing follows a two-step scanning routine. First, an electric field probe conducts an area scan parallel to the phantom surface, mapping field distribution across the housing to locate the peak hot spot. The system then centers an automated zoom scan on that coordinate, taking fine measurements over a three-dimensional grid, typically a 7x7x7 array spaced at 5 mm increments.
The system integrates those field values over a reference volume to yield peak spatial-average SAR in watts per kilogram.
Compliance laboratories measure peak spatial-average SAR integrated over either one gram or ten grams of continuous simulated tissue mass.
The device mounts against different phantom sections depending on its intended operational posture. Wearable sensors and medical patches are tested flat against the phantom wall with zero millimeter clearance to replicate direct skin contact. Headsets and handheld devices sit against a Specific Anthropomorphic Mannequin (SAM phantom) in cheek and 15-degree tilt positions.
Every side of the housing that might face human tissue requires a separate scan, adding billable chamber hours.
The operational limits governing approval differ between global testing territories:
| Regulatory Body and Market | Standard Reference | Averaging Mass | Head and Trunk Limit (W/kg) | Extremity Limit (W/kg) |
|---|---|---|---|---|
| FCC (United States) | 47 CFR 2.1093 / IEEE C95.1 | 1 g of tissue | 1.6 | 4.0 |
| ISED (Canada) | RSS-102 Issue 5 | 1 g of tissue | 1.6 | 4.0 |
| CENELEC / CE (European Union) | EN 50360 / EN 50566 | 10 g of tissue | 2.0 | 4.0 |
| MIC (Japan) | Radio Act Ordinance 14-2 | 10 g of tissue | 2.0 | 4.0 |
| ACMA (Australia) | AS/NZS 2772.2 | 10 g of tissue | 2.0 | 4.0 |
A measured result of 1.45 W/kg across 1-gram tissue satisfies the FCC limit on paper, but leaves almost no room for factory drift. Small shifts in component placement, solder volumes on matching networks, and board tolerances can vary SAR by up to 15 percent across lots. An initial pilot at 1.45 W/kg will produce production units that breach the 1.6 W/kg limit, drawing stop-ship orders.

Qualification

Audit Steps for RF Compliance Files
Signing off on a standalone radio before committing to production volumes requires a close look at the test exhibits. Engineering and compliance leads have to verify that third-party lab reports reflect genuine worst-case operational modes. Sourcing a pre-certified module with an existing FCC ID does not clear a portable product automatically; most modular approvals only cover mobile operation at separation distances of 20 cm or more.
- Confirm the modular grant classification by examining whether the original authorization lists mobile or portable operational restrictions.
- Calculate the maximum tune-up tolerance by adding the manufacturer factory spread to the nominal conducted power output reported in the datasheet.
- Audit the antenna peak gain documented in test exhibits, confirming the trace design matches the exact type and impedance profile evaluated on the reference board.
- Inspect firmware duty cycle limits within non-volatile code to ensure commercial users cannot increase packet transmission frequencies via configuration files.
- Verify laboratory accreditation details, checking ISO/IEC 17025 certification scope specifically for RF dosimetric evaluation methods.
Tune-up tolerances are routinely overlooked during component selection. If a transceiver datasheet lists nominal conducted power at +4 dBm with a production variance of plus or minus 1.5 dB, filings must calculate exposure against the upper rail of +5.5 dBm, or 3.55 mW. Submitting an administrative exemption based solely on the nominal 2.51 mW rating results in a rejected filing once the agency checks the tolerance bounds.
Swapping an antenna invalidates modular filings outright. Replacing a certified ceramic chip with a lower-cost printed inverted-F trace changes near-field current flow and localized field gradients. Any layout change to the radiating element requires an engineering change filing and fresh laboratory verification, adding testing fees and pushing delivery dates.
Supply agreements need explicit liability terms covering compliance failures. Standard contracts assign redesign, re-tooling, and re-testing costs to the supplier whenever declared duty cycles or power ceilings exceed agreed limits during independent laboratory verification.
Settlement
Landed Costs and Market Entry Realities
Absorption limits directly shape the commercial viability of portable wireless gear. Throttling power to sidestep testing carries severe RF penalties: dialing an industrial sub-gigahertz link from +14 dBm down to +3 dBm cuts amplifier draw, but sheds 11 dB of link budget. In an industrial or urban deployment, that loss eliminates roughly 80 percent of the reliable operating footprint, requiring three times as many gateways to maintain coverage.
The cost equation weighs certification expenses directly against production scale. Running full dosimetric evaluations for both North America and Europe costs roughly 18,000 USD once chamber time, custom fixtures, and report generation are tallied. Spread across an initial batch of 5,000 devices, compliance adds 3.60 USD per unit.
On a run of 250,000 units, that amortizes to seven cents. High-volume consumer tags absorb full testing easily to run at peak permissible power, while low-volume industrial equipment relies on firm duty-cycle caps to stay exempt and protect margins.
Lowering transmit power to bypass dosimetric testing reduces production testing fees while permanently eroding RF receiver link margin in harsh operating environments.
Regulatory sign-off governs clearance at border checkpoints. Customs officials in the US and Europe check paperwork against national authorization databases. Attempting to clear a product used within 5 mm of the body using an invalid mobile grant can trigger container seizures at the port.
Storage fees, demurrage, and missed retail delivery windows quickly outstrip the original cost of lab testing.
Disputes frequently turn on where component boundaries end and host liabilities begin. A module vendor supplies silicon capable of radiating +13 dBm for broad range, while the integration manual places legal responsibility for output power, duty cycling, and mechanical spacing entirely on the integrator packaging the board into an enclosure.
Dynamic power control remains a gray area under current SAR rules. Modern multi-gigahertz transceivers increasingly rely on capacitive proximity sensors to step down output when human tissue approaches. Regulatory bodies are still refining standard test protocols to confirm these sensors and their software fail-safes respond fast enough to prevent exposure spikes in the field.