Hands-On Specific Absorption Rate Test Setup for Portable Transceivers
Specific absorption rate testing demands calibrated phantom shell thickness, validated tissue dielectric properties, continuous power enforcement, and exact spatial zoom grid measurements to ensure regulatory compliance.

Phantom
Physical modeling of the human body for electromagnetic exposure testing relies on standardized enclosures filled with tissue-simulating fluid. IEC/IEEE 62209-1528 specifies the structural dimensions, material composition, and mechanical tolerances for these testing shells to recreate realistic near-field radio frequency absorption. Portable transceivers placed against the head or worn on the torso require distinct mounting geometries to capture localized energy deposition accurately.

Anthropomorphic Shell Specifications and Mechanical Tolerances
Precision measurement begins with the Specific Anthropomorphic Mannequin, a lossy plastic shell derived from adult male head dimensions compiled by the US Army. The shell has a relative permittivity below 5.0 and a loss tangent under 0.05 across the 300 MHz to 6 GHz spectrum. Wall thickness is set to 2.0 mm with an allowable tolerance of ±0.2 mm throughout the primary scan area.
A reference line molded into the outer surface marks the ear reference point and mouth line, establishing a coordinate frame for repeatable transmitter placement.
An overly thick shell depresses peak spatial absorption readings by keeping the internal probe further from the transceiver antenna. Conversely, a thin wall understates the physical separation, inflating energy absorption figures above actual biological exposure. Testing facilities verify shell geometry with ultrasound thickness gauges at twenty-three designated reference points across the left and right head sections before mounting the structure onto the test gantry.
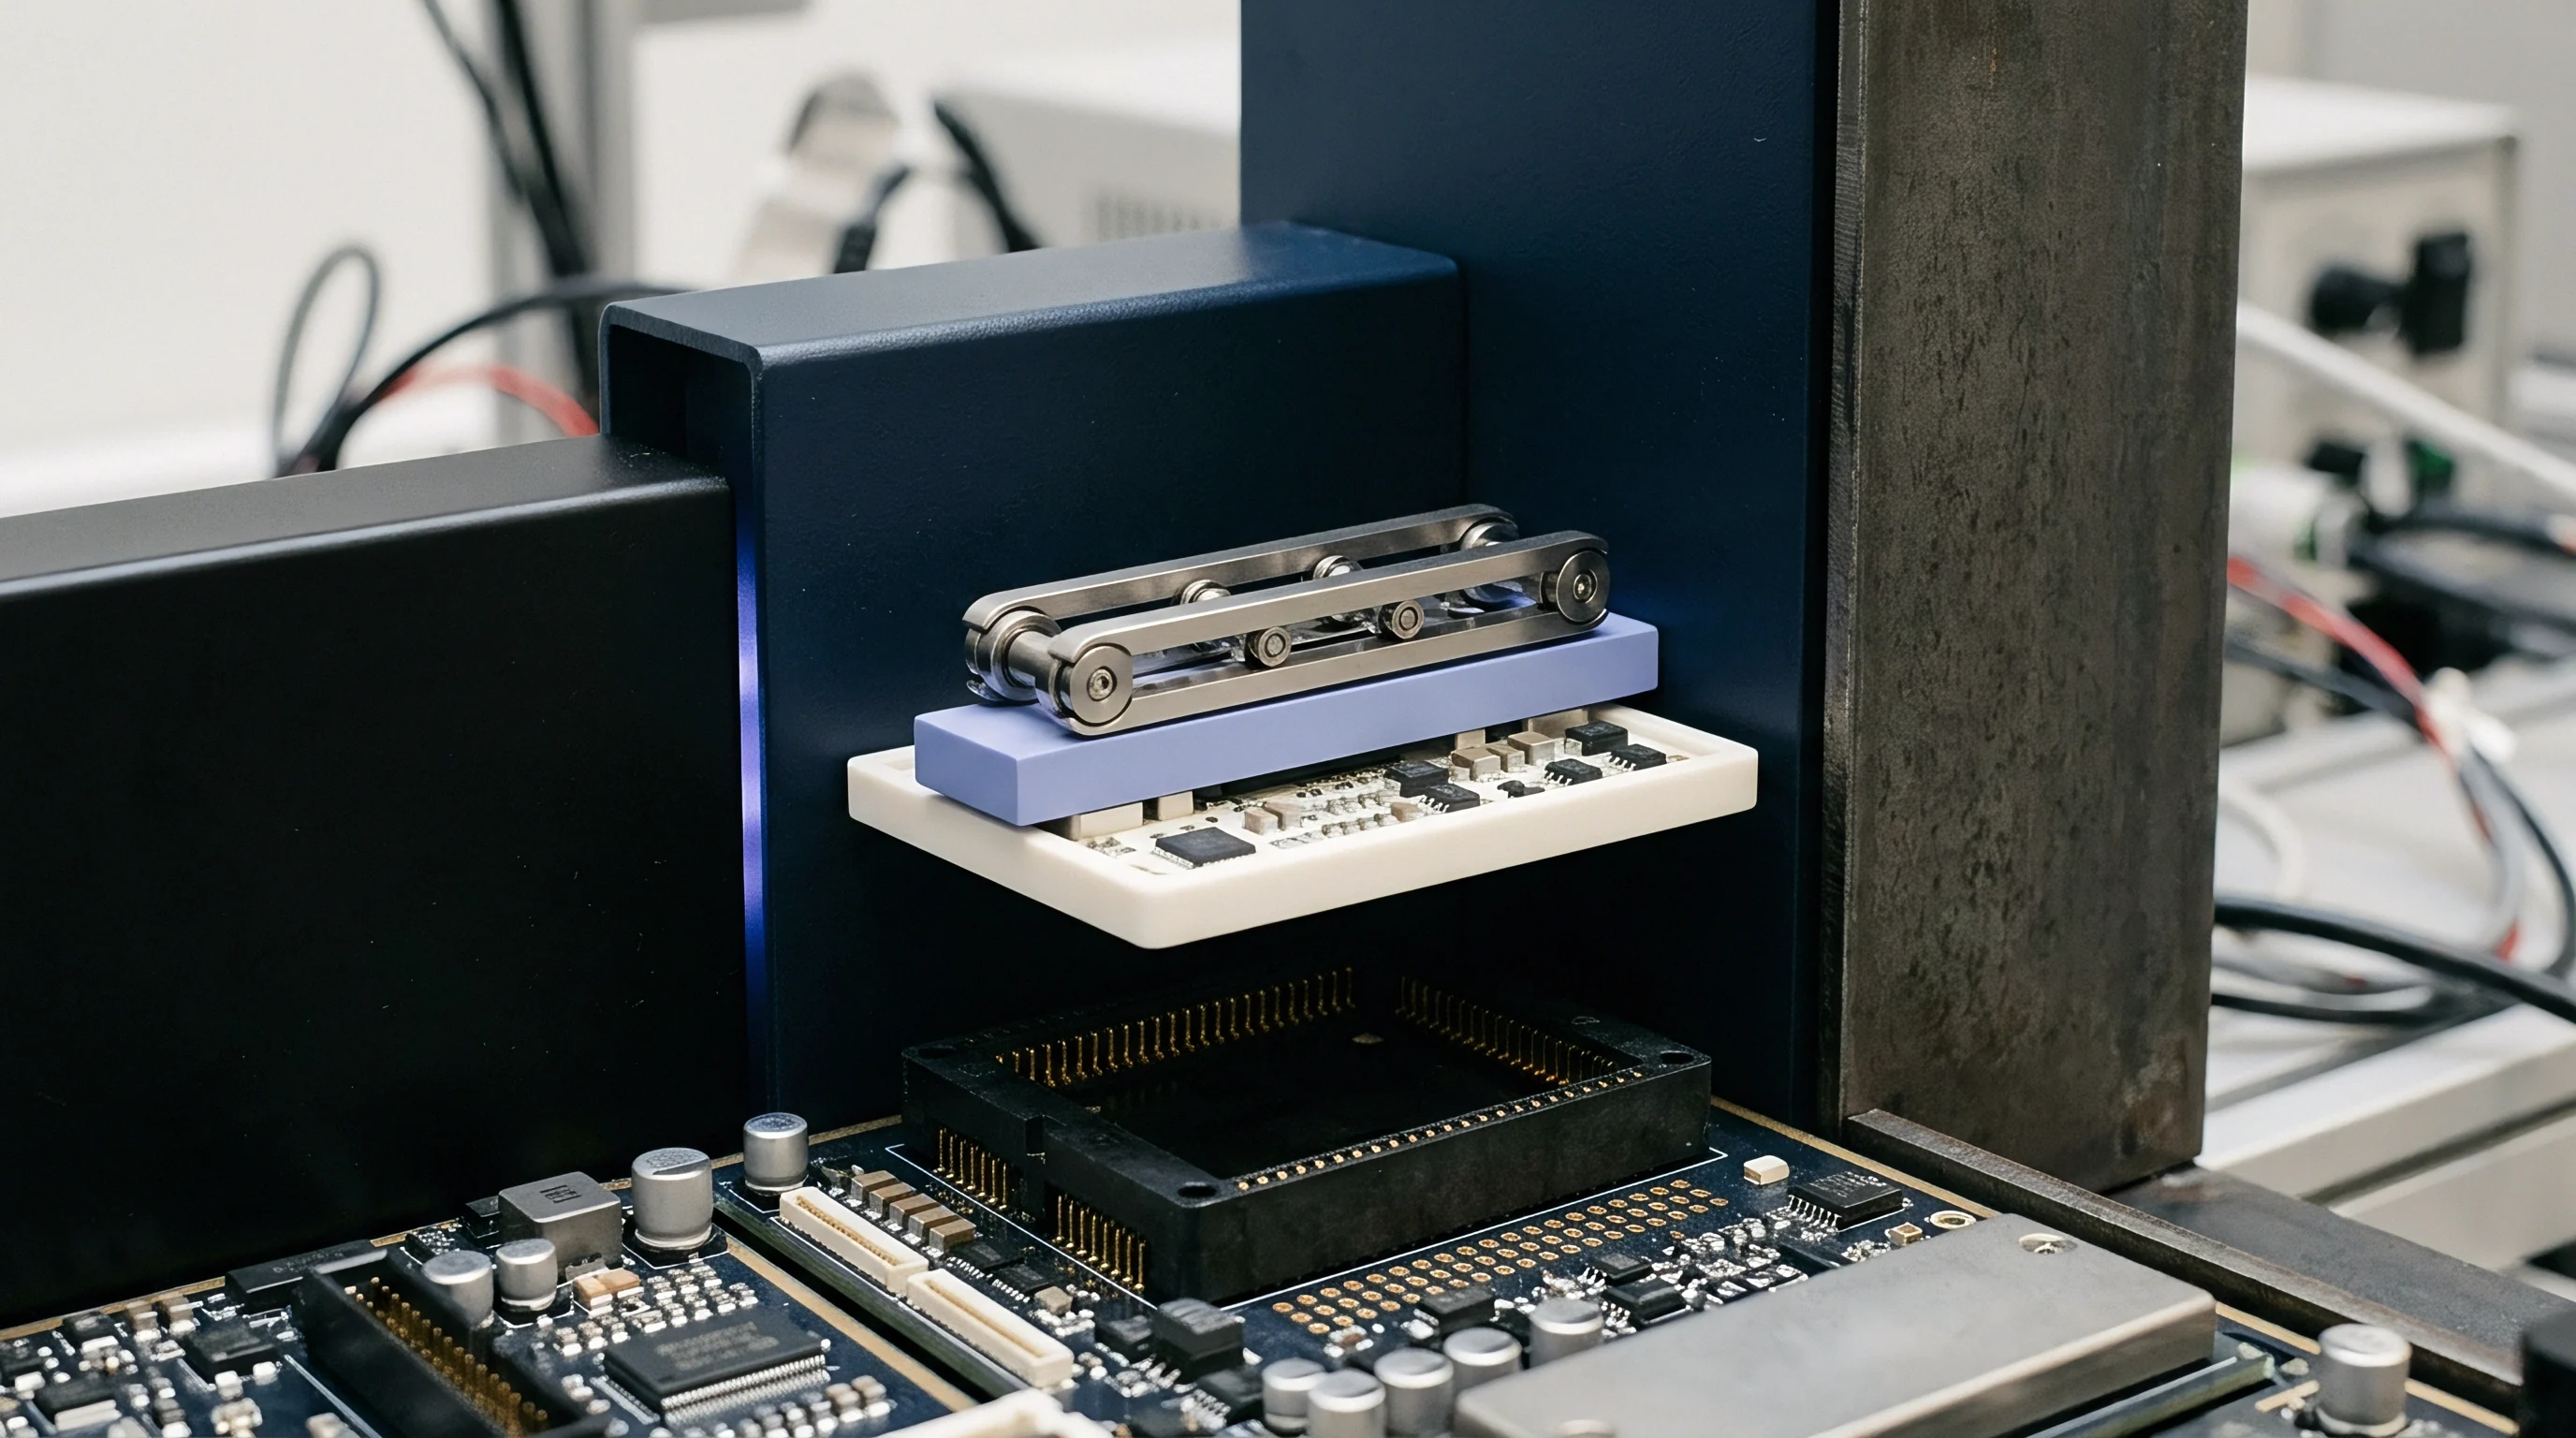
Flat Shell Configuration for Body-Worn Form Factors
Transceivers designed for torso, belt clip, or hand-held operation use a flat-bottom phantom enclosure to evaluate exposure against the body. The flat phantom presents an elliptical surface measuring 600 mm on the major axis and 400 mm on the minor axis, which prevents edge reflections from corrupting the internal E-field pattern. Shell thickness remains uniform at 2.0 mm ± 0.2 mm across the flat bottom panel where the device under test maintains contact or designated spacing.
Structural rigidity prevents sagging when the tank holds up to twenty-eight liters of dense liquid simulant. If the bottom pane deflects, the physical separation distance between the antenna and liquid interface changes during automated sensor sweeps. Testing labs reinforce the phantom perimeter with non-conductive glass-fiber struts to keep vertical deflection within 0.2 mm under full liquid payload.
Synthetic tissue shells with out-of-tolerance wall dimensions yield invalid absorption data that invalidates international type approval filings.
Deviations in shell wall thickness beyond the ±0.2 mm margin specified in IEC/IEEE 62209-1528 Clause 5.2 force accredited laboratories to reject test campaigns and invalidate generated exposure data. Resolving this failure requires complete shell recalibration or structural replacement, introducing a three-week delay to product certification and adding facility usage charges.

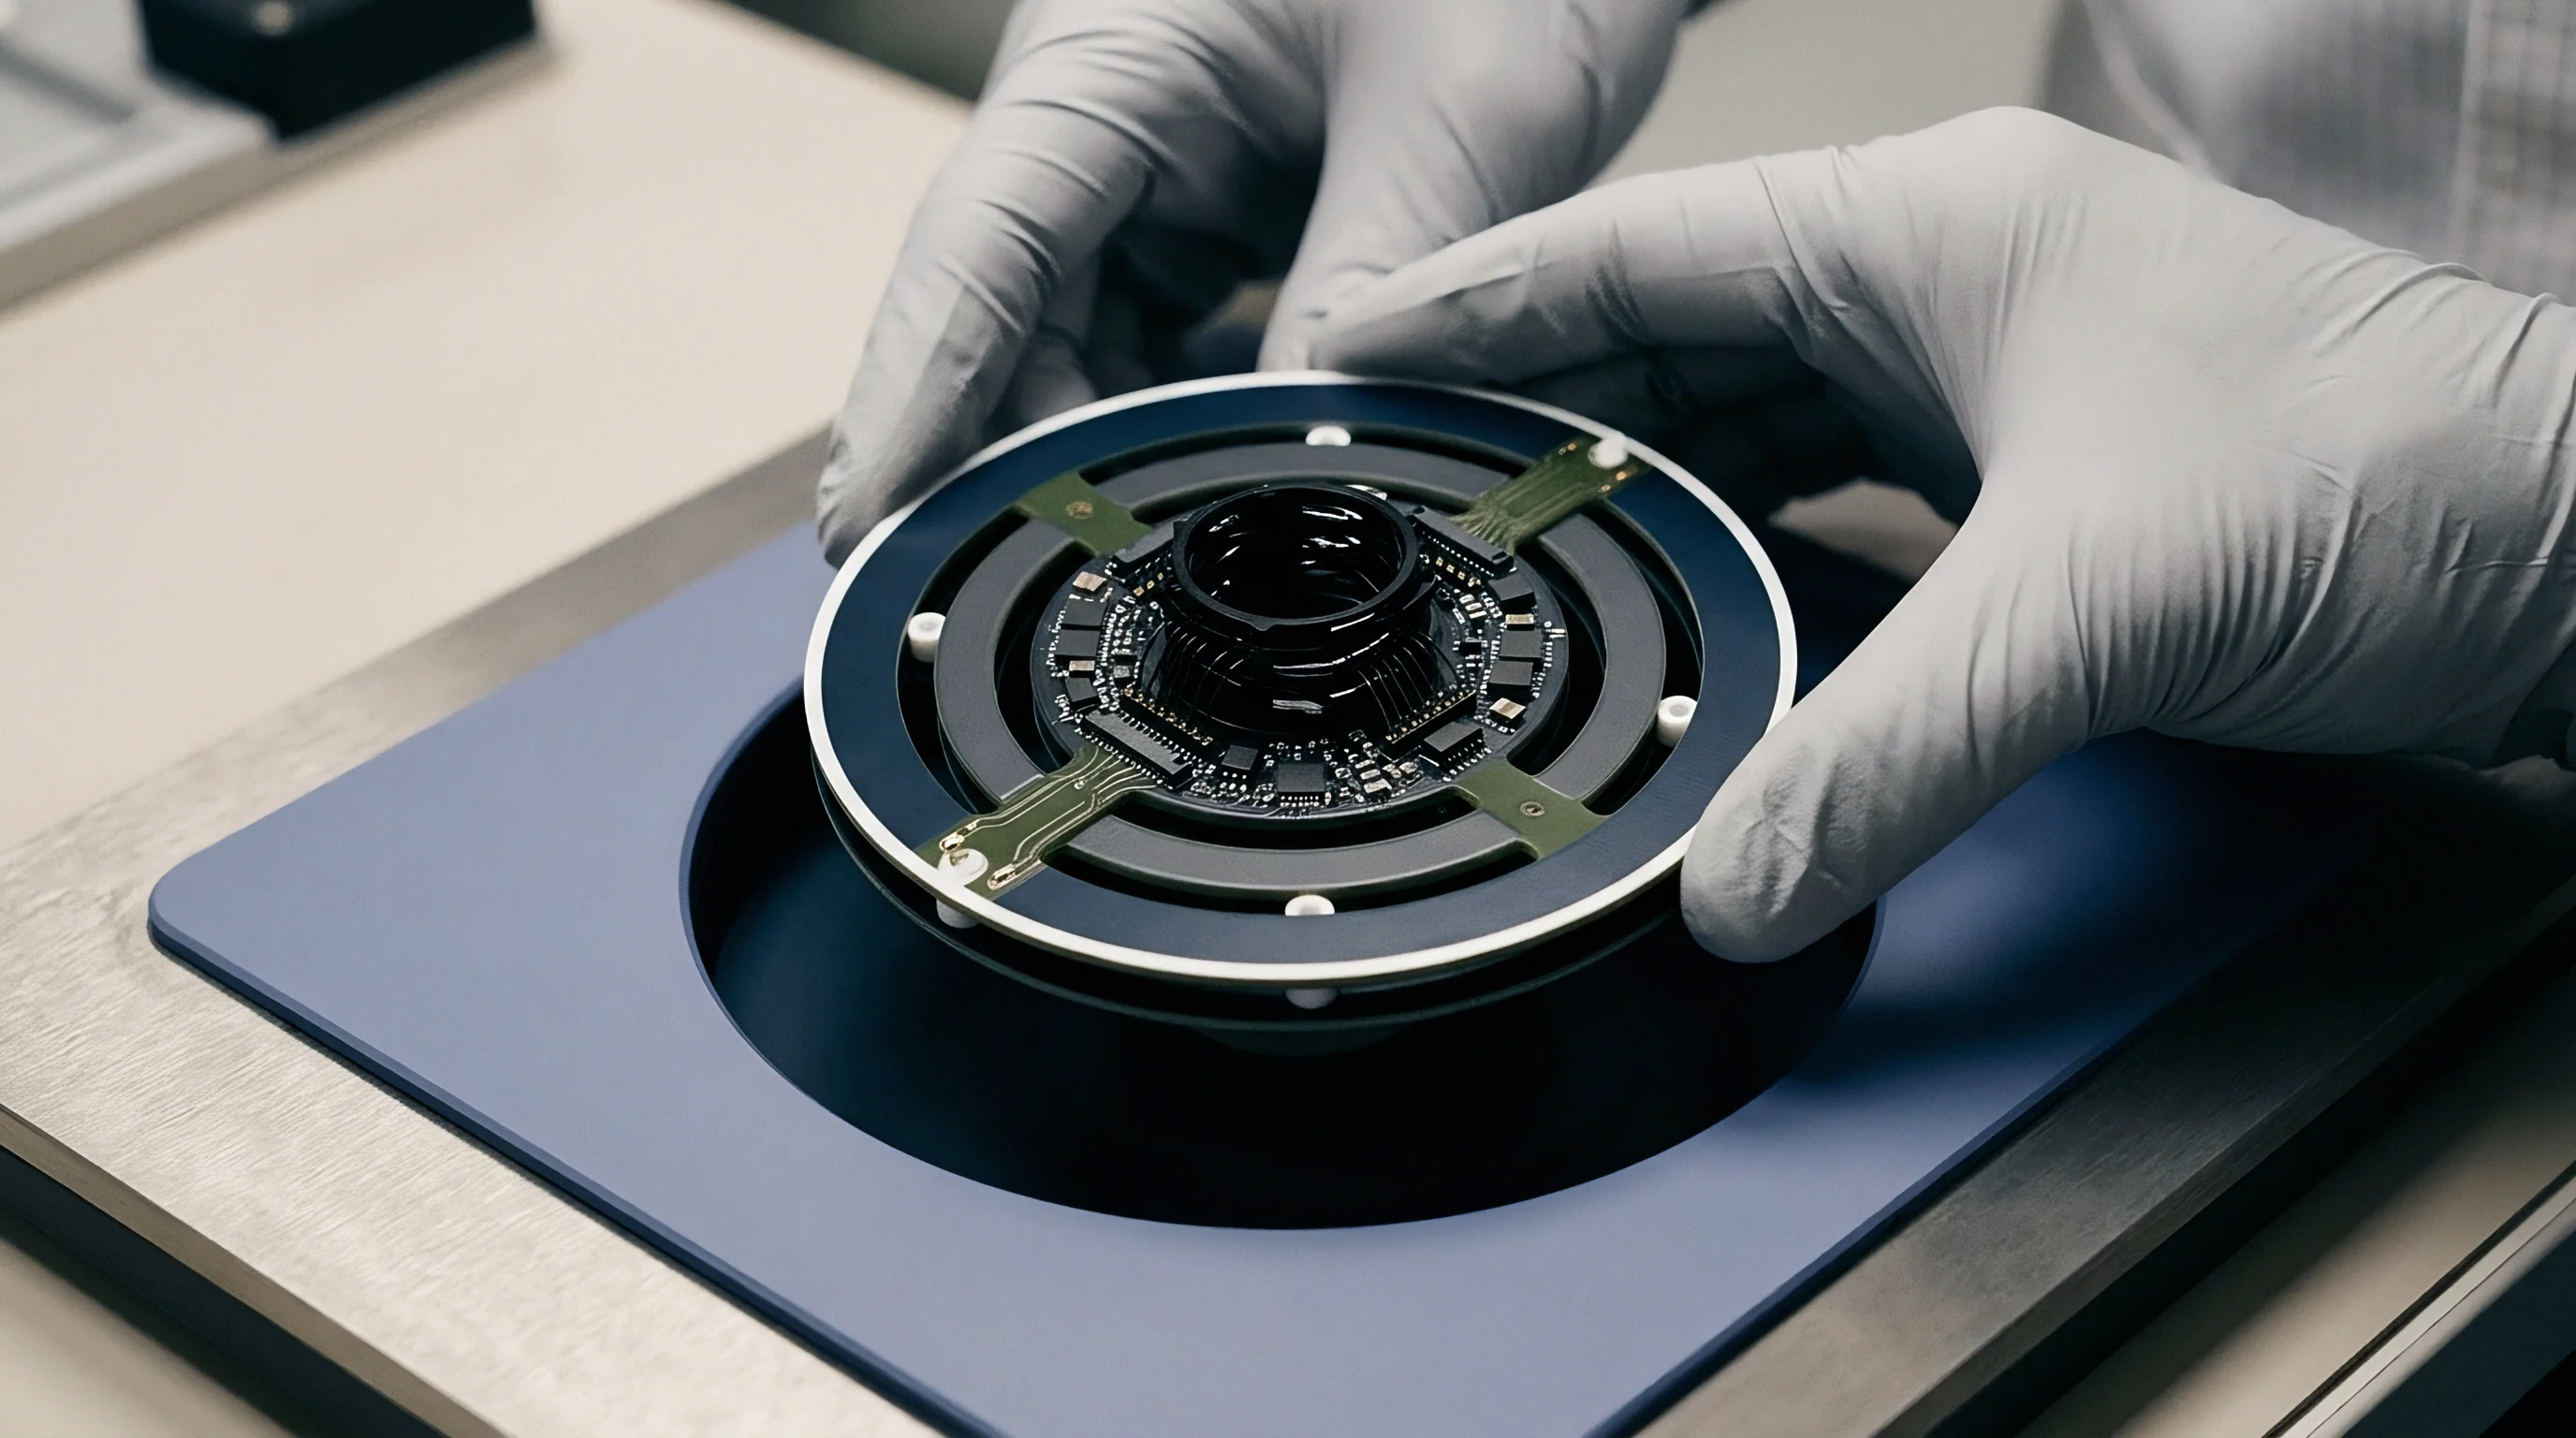
Probe
Electromagnetic field detection inside tissue-equivalent liquid relies on miniature isotropic sensor assemblies suspended from automated robotic manipulators. The sensor converts high-frequency electric field vectors into direct-current voltages proportional to the square of the local field magnitude. Accurate measurement requires strict linearity, minimal mechanical disturbance of the liquid, and low cross-axis angular dependency.
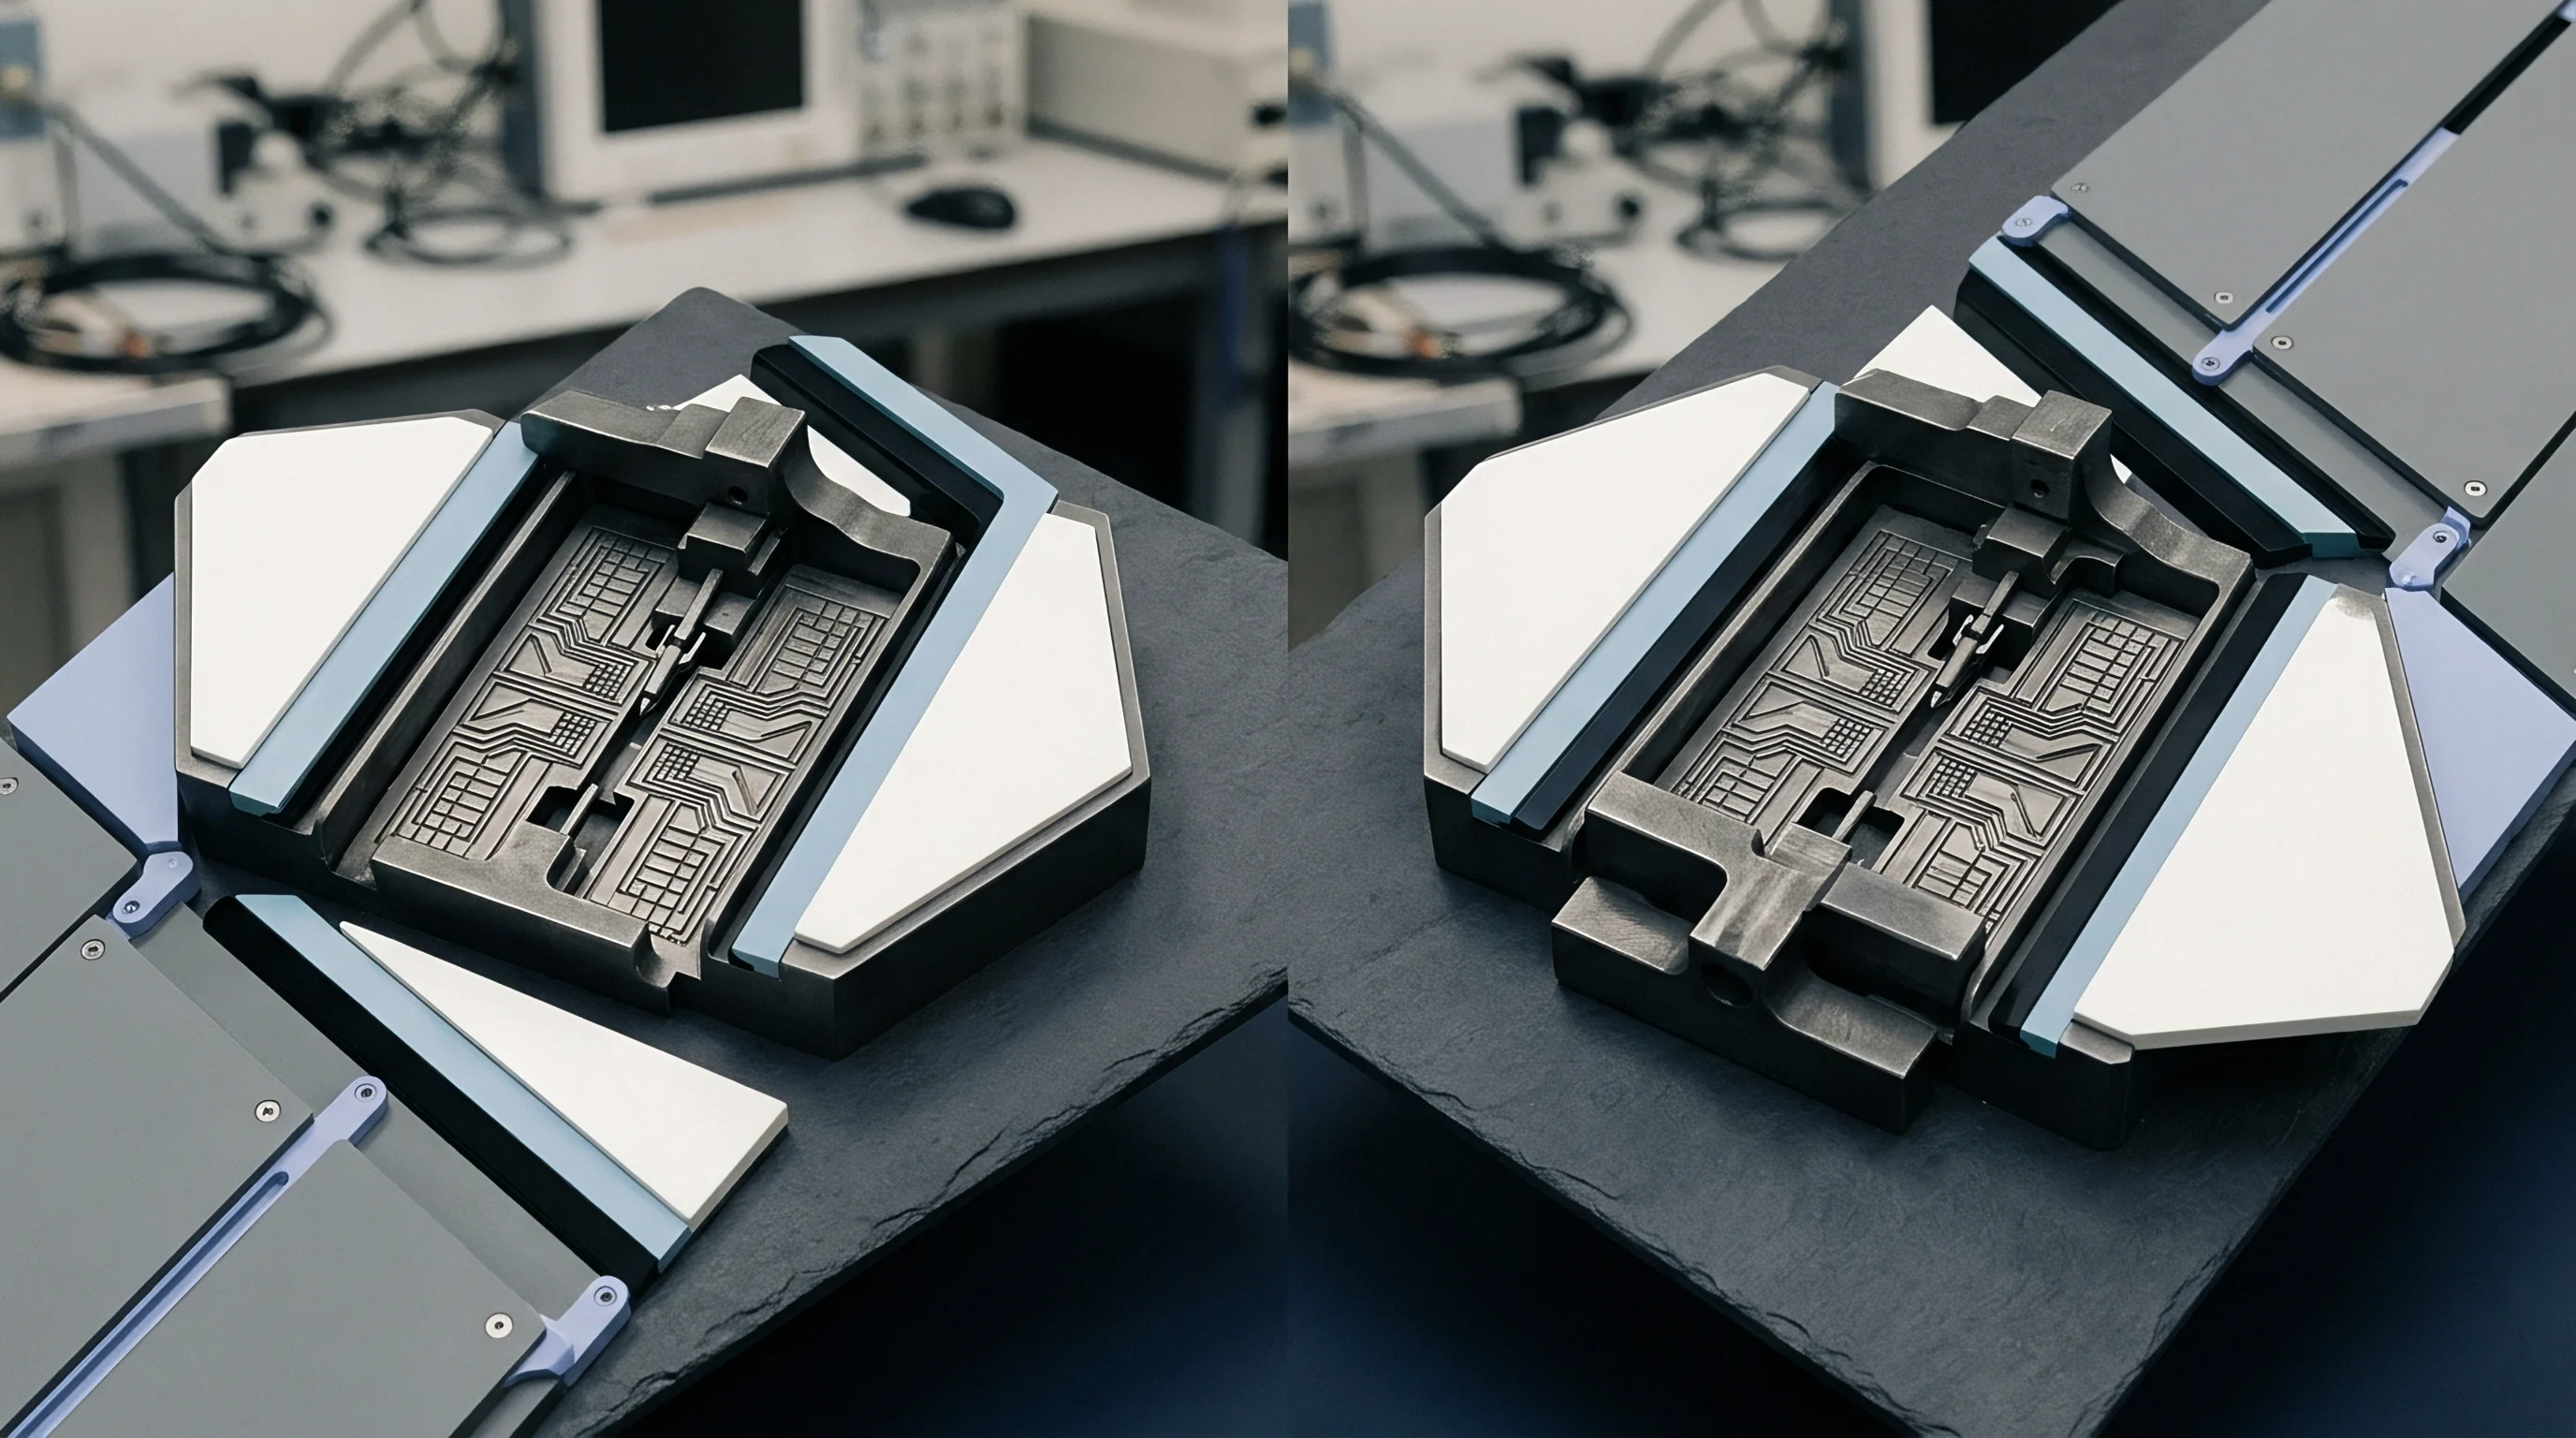
Isotropic Sensing Triangles and Diode Linearization
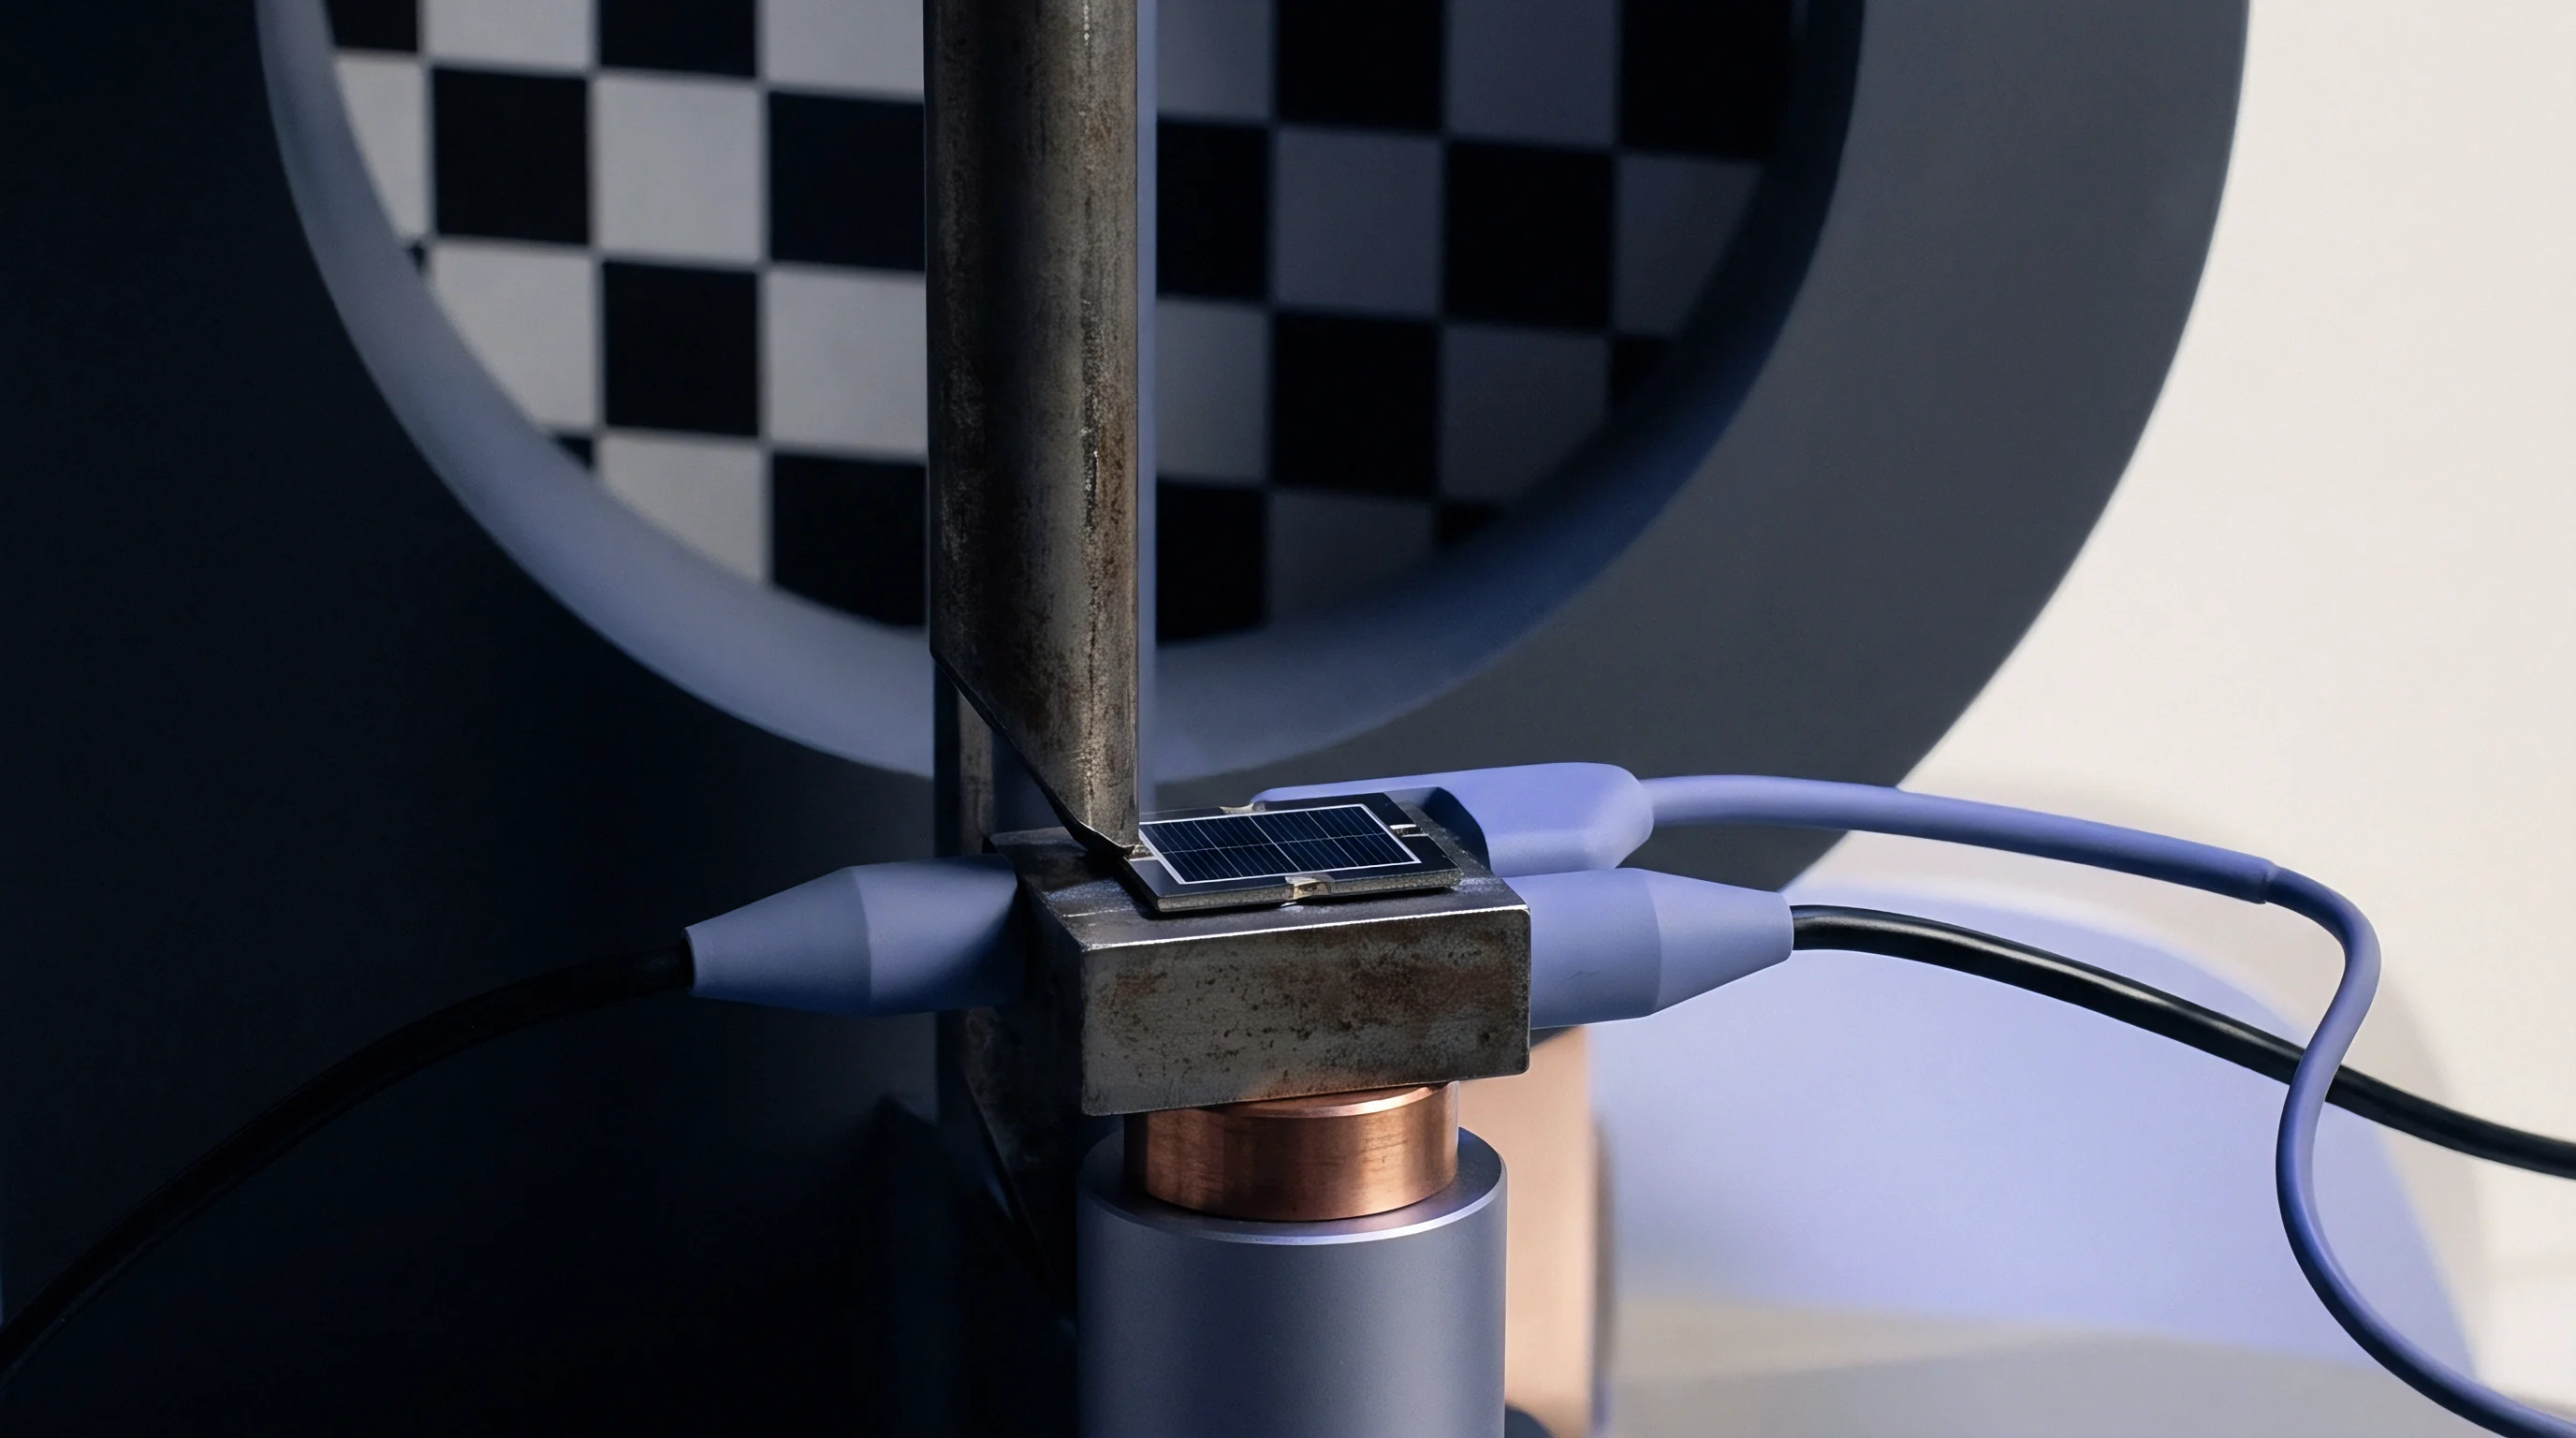
Three orthogonal dipoles arrayed in a triangular pattern form the sensing tip of a modern exposure measurement sensor. Each dipole measures approximately 1.0 mm to 2.0 mm long and connects to a low-barrier Schottky diode loaded with high-resistance carbon-printed lead lines. These carbon lines carry the rectified microvolt signal out of the liquid without acting as secondary receiving antennas that distort local field distributions.
Diode compression characteristics deviate from square-law response at higher electric field strengths near high-power antennas. Measurement software applies polynomial linearization parameters derived during annual sensor calibration to correct raw voltage outputs across a dynamic range spanning 0.01 W/kg to over 100 W/kg. Calibration certificates state the diode compression point and conversion factors for specific frequency bands and liquid formulations, binding sensor output validity to those recorded numeric values.

Spatial Averaging Distortions and Boundary Compensation
Physical displacement between the dipole sensor tip and the outer structural sheath introduces an offset distance, typically between 1.0 mm and 2.7 mm. As the probe tip approaches the inner surface of the phantom shell, the physical boundary disrupts the local field distribution. Measurement systems apply mathematical boundary effect compensation algorithms to calculate true surface field levels based on gradient measurements taken at two or three close vertical coordinates.
Spatial averaging errors occur when measuring field gradients that vary sharply across the physical dimensions of the sensing dipoles. Higher radio frequencies decay rapidly in tissue liquid, compressing the absorption volume into a depth of a few millimeters. Testing campaigns above 3 GHz use specialized sensors with tip diameters reduced to 2.5 mm and dipole lengths under 1.0 mm to maintain measurement spatial resolution.
A calibrated sensor tip maintained within a 0.2 dB axial isotropy limit provides reliable field extraction down to 1.4 mm from the liquid boundary.
Sensor artifacts compromise spatial resolution and shift energy peak locations during fine spatial sweeps, triggering automatic test abort routines. Common operational failure modes include:
- Diode Lead Capacitance Coupling distorts high-duty-cycle pulsed signals when carbon line resistance drops below specification tolerances.
- Mechanical Tip Misalignment alters axial isotropy beyond acceptable levels, producing measurement variations as the sensor rotates around its longitudinal axis.
- Sheath Fluid Infiltration introduces conductive pathways across the internal sensing dipoles, destroying DC offset calibrations during active measurements.
Bypassing probe tip offset corrections through software extrapolation without physical surface reference verification provides unvalidated results.
Liquid
Simulated human tissue fluids match the dielectric constant and conductivity of real anatomical structures at specific target frequencies. These liquid mixtures absorb electromagnetic energy in a manner equivalent to living muscle, brain, or skin tissue. System accuracy depends on maintaining liquid chemical composition, density, and temperature stability throughout the testing cycle.

Target Dielectric Constants and Conductivity Limits
IEC/IEEE 62209-1528 establishes reference values for relative permittivity and conductivity across the 450 MHz to 6 GHz band. Test laboratories verify these properties before initiating exposure scans, ensuring parameters remain within a ±5 percent target window. Temperature shifts alter fluid conductivity by roughly 1.5 to 2.0 percent per degree Celsius, demanding climate control in the test cell between 20°C and 22°C.
| Frequency Band (MHz) | Target Permittivity | Target Conductivity (S/m) | Tolerance Window Permittivity | Tolerance Window Conductivity (S/m) |
|---|---|---|---|---|
| 450 | 43.5 | 0.87 | 41.3 – 45.7 | 0.83 – 0.91 |
| 900 | 41.5 | 0.97 | 39.4 – 43.6 | 0.92 – 1.02 |
| 2450 | 39.2 | 1.80 | 37.2 – 41.2 | 1.71 – 1.89 |
| 5200 | 36.0 | 4.66 | 34.2 – 37.8 | 4.43 – 4.89 |
| Values specified in accordance with IEC/IEEE 62209-1528 reference tables at 22°C ambient temperature. | ||||

Recipe Formulations and Open-Ended Coaxial Slit Validation
Formulating target fluids for lower frequencies below 1000 MHz uses water, sugar, salt, hydroxyethyl cellulose, and bactericide. Higher-frequency mixtures above 2000 MHz eliminate sugar in favor of diethylene glycol butyl ether or specialized non-toxic surfactants like Triton X-100 to lower relative permittivity while increasing conductivity. Evaporation during open-tank operation shifts the water-to-solvent ratio, elevating conductivity over multi-day test runs.
Engineers assess liquid properties using an open-ended coaxial probe connected to a vector network analyzer. The probe face presses flat against the liquid surface without trapping air bubbles. Software converts reflection coefficient phase and magnitude measurements into complex dielectric permittivity figures, recording fluid state values directly into the final compliance report file.
- Thermal Stabilization verifies that the fluid bath reaches thermal equilibrium within 0.5°C of the ambient room temperature.
- Network Analyzer Phase Calibration executes open, short, and deionized water reference sweeps on the coaxial assessment probe.
- Direct Contact Immersion submerges the measurement probe face while confirming zero air bubble entrapment against the dielectric interface.
- Dielectric Value Extraction logs permittivity and conductivity against published target tables, verifying the ±5 percent compliance window.
Compliance documentation mandates adherence to IEC/IEEE 62209-1528 Clause 6.1.2, which dictates that dielectric parameter measurements must occur within twenty-four hours prior to any regulatory test scan.


Alignment
Mounting the device under test against the tissue phantom demands precise mechanical alignment to mirror standardized usage scenarios. Transceivers operating near the ear or against the body experience distinct mechanical orientation constraints. Slight misalignments alter the distance between internal radio antennas and the fluid interface, changing peak spatial energy absorption readings significantly.

Head Mount Kinematics and Ear Reference Point Geometry
Evaluating head exposure requires fixing the radio terminal to the mannequin head phantom using two anatomical reference points: the ear reference point and the mouth line. The acoustic receiver outlet rests directly on the ear reference point while the vertical center plane of the device aligns with the line connecting the ear reference point to the corner of the mouth. Testing personnel adjust the clamping fixture to secure the handset in two distinct orientations: the cheek position and the 15-degree tilt position.
In the cheek position, the phone enclosure maintains physical contact with the mannequin cheek surface. The tilt position rotates the device center plane away from the cheek line by fifteen degrees along a pivot axis passing through the ear reference point. Small form-factor handsets with integrated loop or patch antennas exhibit extreme sensitivity to angular tilt errors, where a two-degree mounting variation alters recorded absorption peaks by up to 12 percent.
Which Separation Distance Controls Handset Body Scan Positioning?
Body-worn testing procedures establish specific separation distances between the enclosure back panel and the flat phantom bottom based on end-user operating conditions. Handheld transceivers utilize accessories such as belt clips or holsters to define fixed separation distances, typically ranging from 0 mm to 15 mm. Devices capable of transmitting without body accessories require evaluation at a default test separation distance mandated by regulatory guidance documents such as FCC KDB 447498 D01.
Manufacturers specifying ultra-thin spacing margins, such as 5 mm or less, must ensure user documentation clearly instructs end-users to maintain that physical separation distance. Failure to demonstrate compliance at zero spacing forces the insertion of clear operating warnings in user manuals, limiting product deployment options in enterprise markets where continuous body contact is standard practice.
FCC KDB 648474 D04 mandates testing all handset surfaces and edges within 25 mm of a transmitting antenna when evaluating body-worn and hotspot mode exposure profiles.
Unresolved questions persist regarding how regulatory authorities will handle alignment criteria for emerging foldable and flexible transceiver form factors, where internal antenna geometries shift dynamically during device operation.
Scan
Automated robotic platforms execute multi-stage spatial sweeps inside the tissue liquid to identify localized energy maximums. The system moves the field probe through a coarse two-dimensional grid before conducting a high-resolution three-dimensional zoom sweep around the highest identified peak. This progressive approach optimizes total measurement campaign duration while preserving spatial peak extraction accuracy.
Coarse Grid Search and Peak Extraction Methods
The measurement process opens with a fast area scan positioned parallel to the phantom inner surface. The robot moves the probe across a uniform 2D spatial grid, using a step size of 10 mm to 15 mm for frequencies below 3 GHz, and 8 mm to 10 mm for higher bands. Interpolation algorithms generate a continuous spatial absorption map, isolating local energy hot spots across the entire exposed transceiver surface.
Secondary peak evaluation identifies multiple transmission sources or complex antenna array radiation patterns. Software algorithms filter local maxima, flagging any secondary peak within 2 dB of the primary maximum for subsequent three-dimensional volume assessment. Neglecting secondary peaks leads to under-reporting total spatial energy absorption when evaluating simultaneous multi-band transmissions.

Fine Spatial Step Calculations in High-Frequency near Fields
Zoom scans execute within a localized 3D volume centered over the hot spots extracted during the initial area search. FCC KDB 865664 D01 specifies maximum spatial step dimensions based on the operational radio frequency range to ensure spatial field gradients are fully resolved.
| Frequency Range (GHz) | Minimum Grid Volume (x, y, z) (mm) | Maximum Horizontal Step (Δx, Δy) (mm) | Maximum Surface Vertical Step (Δz1) (mm) | Graded Step Ratio (Δz) |
|---|---|---|---|---|
| < 2.0 | 30 x 30 x 30 | ≤ 8.0 | ≤ 5.0 | ≤ 1.5 |
| 2.0 – 3.0 | 30 x 30 x 30 | ≤ 5.0 | ≤ 4.0 | ≤ 1.5 |
| 3.0 – 4.0 | 28 x 28 x 28 | ≤ 4.0 | ≤ 3.0 | ≤ 1.4 |
| 4.0 – 6.0 | 22 x 22 x 22 | ≤ 4.0 | ≤ 2.0 | ≤ 1.4 |
Power drift tracking monitors transceiver power stability throughout the measurement sweep. A single-point reference field measurement taken at a fixed location before and after the zoom scan quantifies total RF output drift. If transmitter battery drain or thermal throttling causes the reference power to drift by more than ±0.21 dB (approximately 5 percent), the automated system voids the scan session and requires immediate battery replacement or external DC power integration before repeating the test sequence.
The spatial evaluation workflow follows a structured sequence to convert measured electric field values into regulatory exposure figures:
- Area scan execution mapping 2D power distributions across the entire physical boundary.
- Local peak extraction identifying primary and secondary high-exposure coordinates.
- Zoom scan volume allocation setting step sizes per frequency-dependent regulatory matrices.
- Power drift check validation confirming transmitter output stability within ±0.21 dB.
A useful operational rule of thumb indicates that high-frequency zoom scans using non-uniform graded z-steps yield higher peak energy estimates than uniform steps by resolving steep exponential decay curves near the fluid boundary.
Grant
Converting chamber measurement data into an official approval grant demands careful alignment between tested hardware configurations and marketed product specifications. Certification bodies evaluate peak absorption values against regulatory limits, taking into account declared power tune-up tolerances and host integration constraints. A misstep in dossier documentation or modular integration boundaries invalidates operational authority, delaying commercial distribution lines.
Permissive Change Thresholds for Enclosure Modifications
Host product manufacturers integrating pre-certified radio modules must determine when changes to enclosure materials, internal layout, or antenna placement trigger formal re-testing. Regulatory frameworks, such as the FCC Class II Permissive Change system, permit minor host modifications without full re-certification provided original exposure thresholds remain uncompromised.
Moving an internal antenna closer to the outer housing, replacing plastic housing materials with metallic alloy sheaths, or modifying battery pack geometries disrupts original near-field coupling characteristics. When exposure measurements on a modified host exceed the original grant values, the host integrator must submit a formal permissive change application accompanied by fresh laboratory reports before shipping commercial units.

Financial and Timeline Impact across International Regulatory Bodies
Global entry strategy requires managing divergent regional exposure limits, testing procedures, and submission turnaround times. While the United States and Canada enforce a 1.6 W/kg peak spatial limit averaged over 1 gram of tissue, the European Union and Japan specify a 2.0 W/kg threshold averaged over 10 grams of tissue.
| Regulatory Jurisdiction | Spatial Mass Limit | Primary Standard | Typical Laboratory Campaign Cost (USD) | Average Bureau Approval Lead Time |
|---|---|---|---|---|
| United States (FCC) | 1.6 W/kg (1g) | FCC KDB 447498 / IEEE 1528 | $12,000 – $22,000 | 3 – 5 weeks |
| European Union (CE) | 2.0 W/kg (10g) | EN 50360 / EN 50566 / IEC 62209 | $10,000 – $18,000 | 2 – 3 weeks (Self-DoC) |
| Japan (Giteki / MIC) | 2.0 W/kg (10g) | MIC Notice No. 88 / IEC 62209 | $14,000 – $25,000 | 4 – 6 weeks |
| Brazil (ANATEL) | 2.0 W/kg (10g) | Act 1630 / Resolution 715 | $15,000 – $28,000 | 6 – 10 weeks |
Filing requirements mandate submitting full test reports along with operating instructions, antenna specs, tune-up documentation, and schematic diagrams. Hardware modifications, antenna shifts, or enclosure updates require evaluation against permissive change rules to prevent commercial shipments from being held up at import customs gates.
- Antenna Spatial Shift exceeding 5 mm relative to the original module approval geometry mandates fresh body-worn exposure sweeps.
- Host Enclosure Plastic Substitution introducing high-dielectric carbon fillers demands immediate re-evaluation of near-field absorption profiles.
- Firmware Transmission Duty Cycle Increases override factory power limits and require a full permissive change filing prior to public software release.
A declared tune-up tolerance of +1.0 dB requires scaling all raw measured energy values up by 25.9 percent for regulatory compliance evaluation.
A transceiver exhibiting a raw measured peak of 1.35 W/kg under full transmission power requires scaling when the factory tune-up specification permits a +1.0 dB production power tolerance. Multiplying the raw test reading by the 1.259 scaling factor pushes the official reported SAR value to 1.70 W/kg, exceeding the US 1.6 W/kg regulatory ceiling and causing an immediate grant denial. Sourcing practices must coordinate early hardware testing with factory tune-up targets to ensure scaled regulatory values remain comfortably within legal approval thresholds before submitting formal certification files.