Standardized Field Uniformity Verification in Radiated Immunity Pre Scanning Enclosures
Standardized field uniformity verification prevents pre-scanning errors by mapping spatial grid power profiles inside compact immunity enclosures.


Grid
Radiated immunity testing exposes an electronic product to field strengths typically between 1 V/m and 30 V/m across 80 MHz to 6 GHz. Under compliance standards such as EN IEC 61000-4-3, this field illuminates a planar surface termed the Uniform Field Area. Accreditation rules require a 1.5-meter by 1.5-meter vertical plane to hold field intensity within tolerance across sixteen discrete points.
Specifically, at least 75 percent of those points ~ twelve of the sixteen positions ~ must stay between the nominal field strength and +6 dB above it. That spatial consistency prevents local over-testing that burns out the device under test, as well as under-testing that hides immunity flaws.
Compact pre-scan setups ~ small semi-anechoic chambers, TEM cells, gigahertz transverse electromagnetic cells, and shielded desktop boxes ~ rarely offer the clearance needed to establish a full 1.5-meter square calibration plane at 3-meter separation from the transmitting antenna. The enclosure walls sit close to the horn, ferrite tiles saturate at lower input power, and shallow pyramidal foam cannot absorb long-wavelength reflections below 300 MHz. Shrinking the enclosure alters boundary geometry rather than simply scaling down the uniform zone.
Testing in an unmapped chamber creates blind nulls where fields drop well below target, along with hot spots that trigger premature component failures.
Field uniformity calibrations conducted in compact pre-scan enclosures with working volumes under eight cubic meters exhibit spatial field variance exceeding 11 dB at frequencies below 200 MHz when hybrid ferrite absorbers lack high-density dielectric backing.
Establishing spatial consistency in a compact space requires scaling the grid geometry while maintaining standard metrological criteria. Rather than forcing a 1.5-meter plane against chamber absorbers, the calibration grid shrinks to match the volume occupied by the actual test sample. Common practice uses a reduced 0.5-meter by 0.5-meter plane containing nine or sixteen calibration points spaced at 0.25-meter intervals.
The antenna position, cable runs, and enclosure loading must stay identical during both calibration sweeps and product testing.
Operational validation before pre-scanning demands precise documentation of boundary tolerances and hardware setup parameterization:
- Spatial Grid Definition maps a reduced vertical plane positioned precisely at the front face location where the product under test will sit during pre-scans.
- Forward Power Baseline records the exact radio frequency power delivered to the antenna terminal necessary to generate the target field strength at each grid coordinate.
- Absorber Loading Limits establishes maximum permissible metallic mass within the chamber volume before spatial reflections alter the calibrated field shape.
- Sensor Alignment Geometry maintains orthogonal axis positioning of the field measuring instrument relative to the enclosure center lines during spatial sweeps.
Skipping spatial field mapping inside a compact pre-scan chamber leads directly to false passes that fail during formal accredited runs, resulting in emergency board respins, layout overhauls, and re-testing costs that easily reach tens of thousands of dollars.

Probe
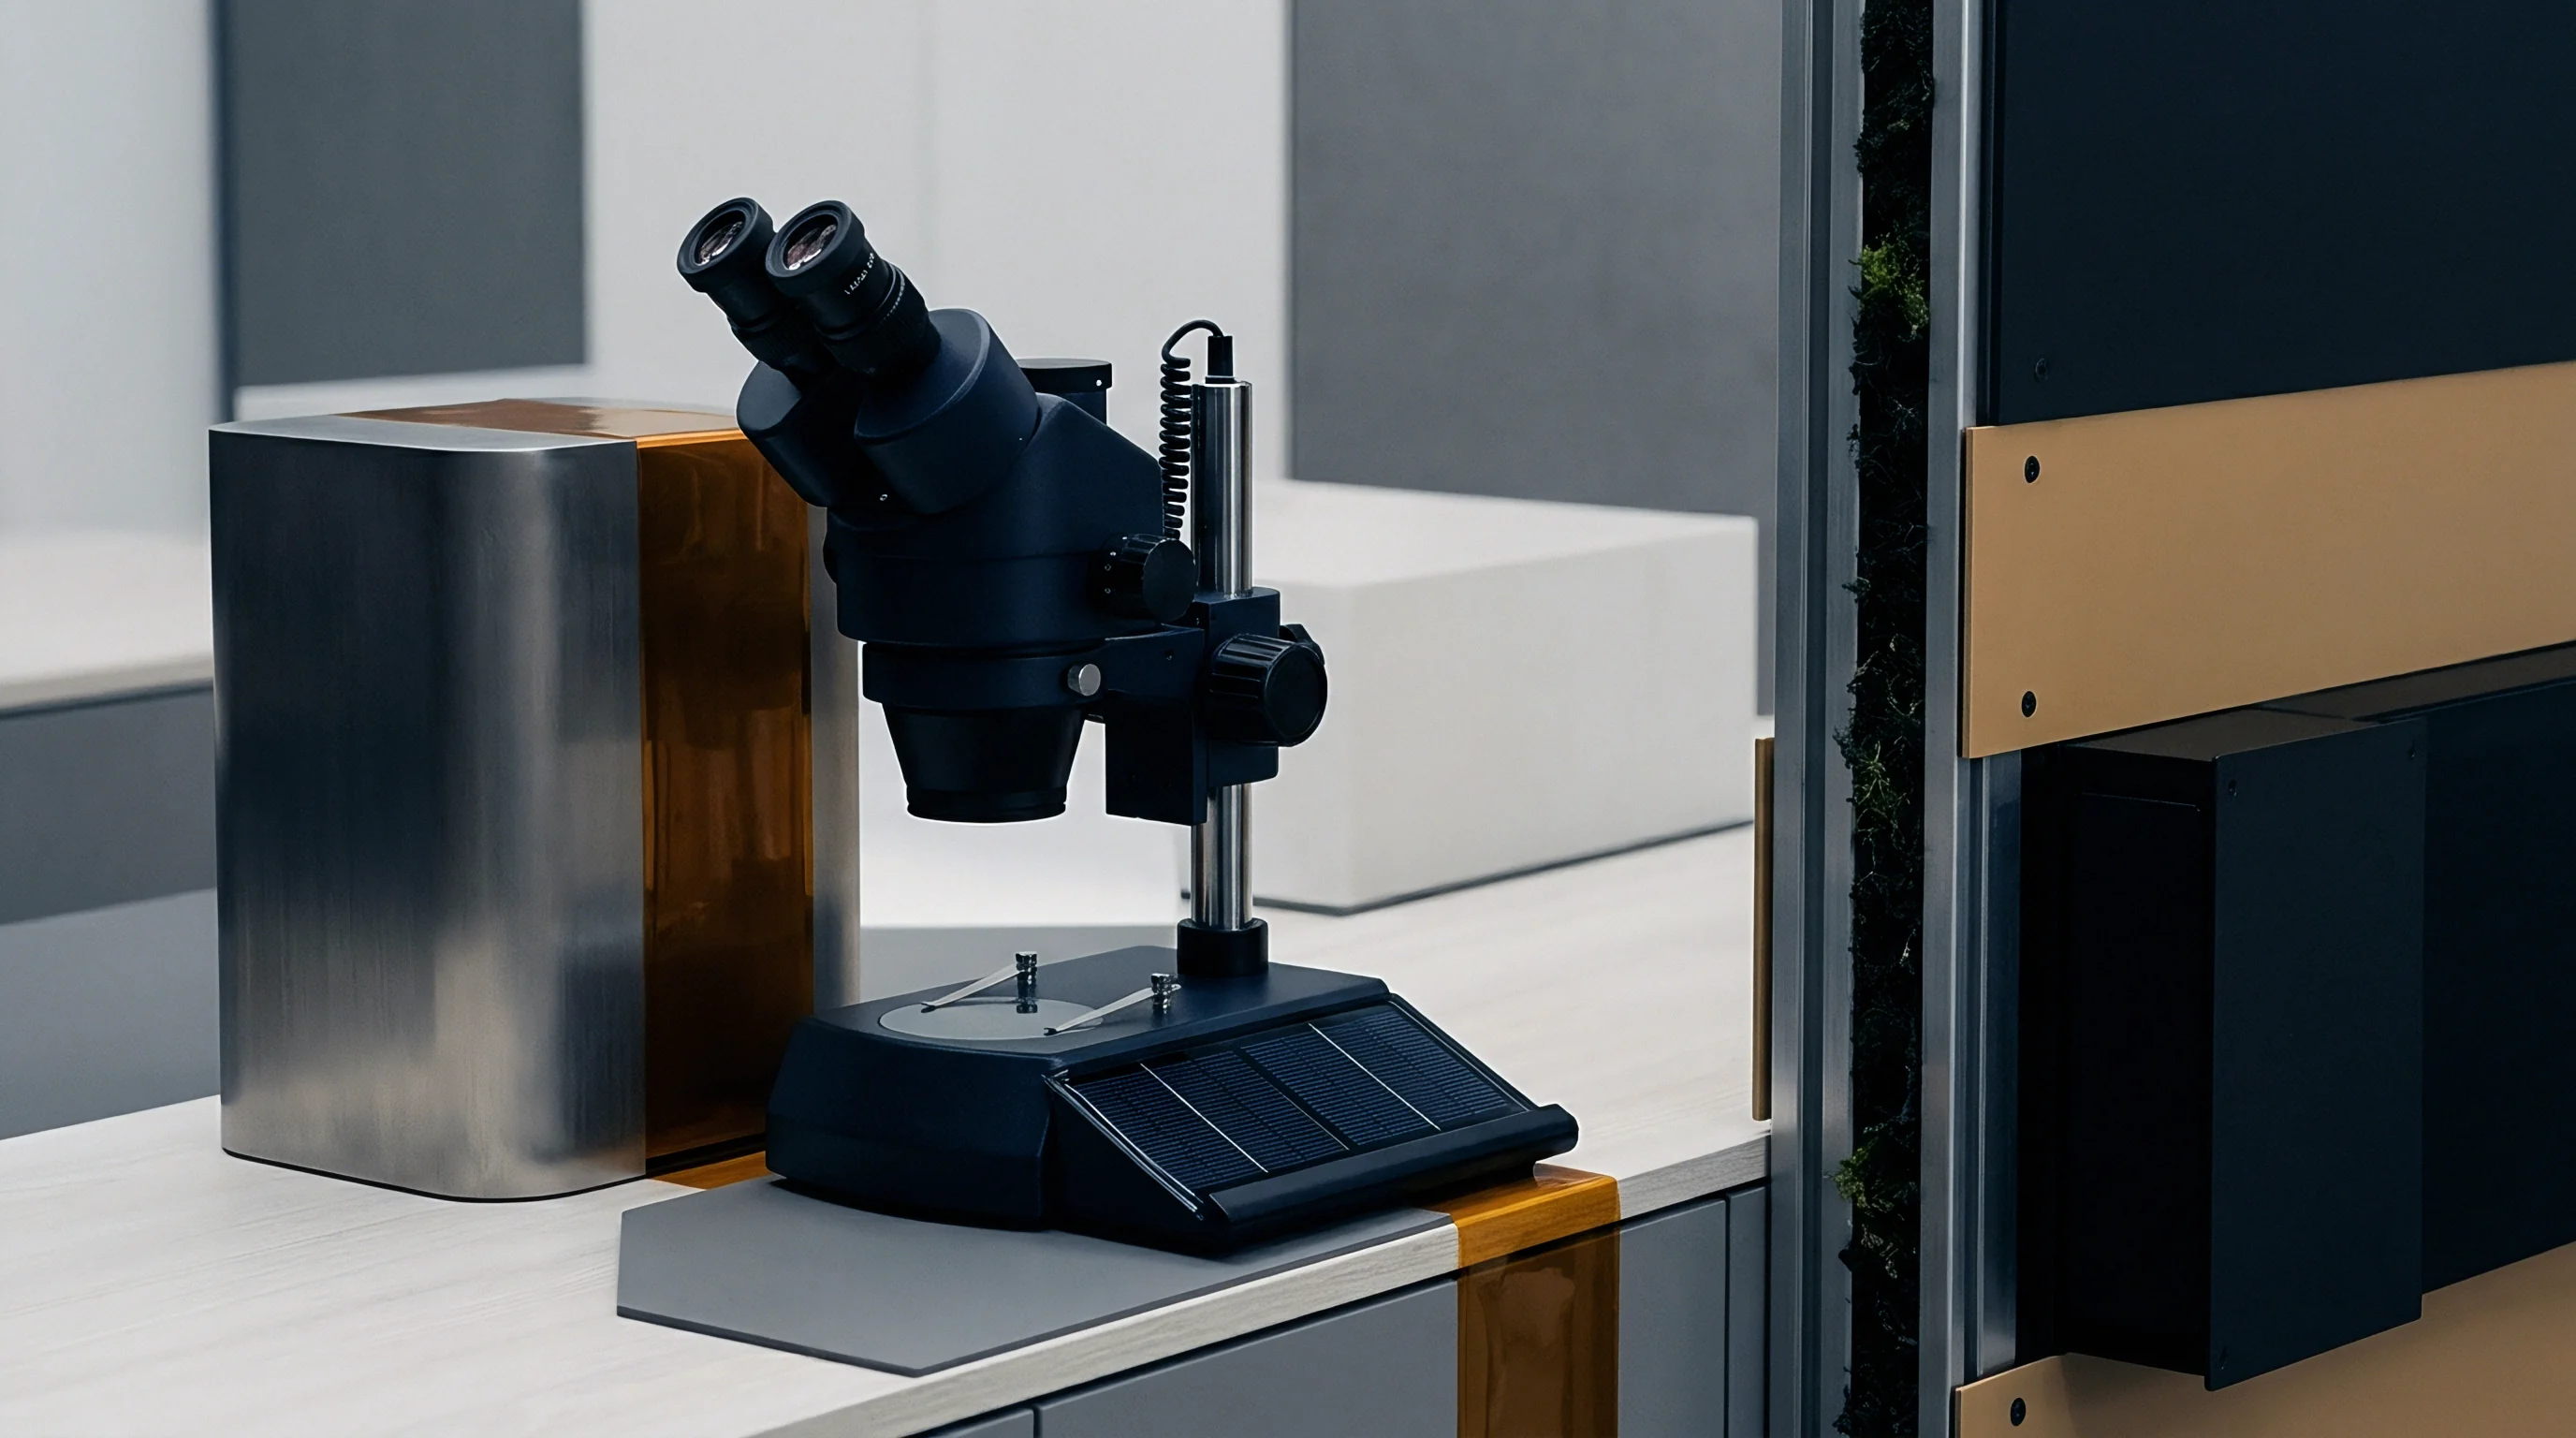
Field measurement inside small enclosures relies on isotropic electric field sensors capable of measuring RF energy across three orthogonal axes simultaneously. Sensors require small physical footprints so they do not load the cavity or distort the field distribution they are trying to read. Fiber-optic telemetry lines carry readings out of the shielded area without metallic conductors that pick up stray energy or alter standing waves.
The probe mounts on a non-conductive dielectric mast, keeping metallic hardware at least one meter away from the active sensing volume.

Step-by-Step Field Area Calibration Protocol
Execution of a field uniformity verification sweep inside a pre-scan enclosure follows a rigorous mechanical and electrical sequence designed to generate repeatable forward power drive profiles:
- Position the isotropic sensor at point 1 of the designated grid plane inside the empty pre-scan enclosure.
- Connect the signal generator and power amplifier chain through a dual-directional coupler to the field transmitting antenna.
- Set the signal generator to the starting frequency, typically 80 MHz, applying 80 percent amplitude modulation at 1 kHz.
- Adjust the signal generator output power until the isotropic sensor records the target electric field level, recording the net forward power.
- Increment the frequency in steps not exceeding 1 percent of the fundamental frequency, recording the baseline forward power at each frequency step up to the high boundary.
- Relocate the sensor to the next grid position and repeat the frequency sweep until all sixteen grid points record complete forward power curves.
- Calculate the mean field strength across all grid points at each frequency step to establish the enclosure drive profile.
Compliance with IEC 61000-4-3 Clause 6.2 demands that field measurement hardware maintain an isotropic response variance under 1.0 dB across the entire evaluated frequency spectrum.
Drive Level Derivation and Forward Power Arithmetic
To establish a uniform field of 10 V/m across a reduced 0.5-meter by 0.5-meter grid, forward power requirements are calculated point by point across the frequency range. Consider a representative pre-scan chamber sweep at 400 MHz using a grid of 9 points spaced on a 3×3 matrix. The electric field Ei measured at each point i for an initial forward power Pinit of 10 Watts produces the raw field values presented in the working verification sweep.
Assume the measured raw field values at 10 Watts forward power across the 9 points are: 8.2 V/m, 9.1 V/m, 11.4 V/m, 10.5 V/m, 12.1 V/m, 8.8 V/m, 9.5 V/m, 13.0 V/m, and 10.2 V/m. The goal is identifying the baseline forward power Pbase that allows at least 75 percent of the points (7 out of 9 points in this reduced matrix) to satisfy the 0 to +6 dB tolerance relative to a nominal 10 V/m target field.
A tolerance window of 0 to +6 dB above 10 V/m establishes an acceptable field strength range between 10.0 V/m and 19.95 V/m. To achieve this, the field values scale proportionally with the square root of forward power:
Enew = Eraw · sqrtfracPtargetPinit
Sorting the initial raw field values normalized to 1 Watt input yields the electric field transfer coefficients ki = Eraw / sqrt10 in units of (V/m) / sqrtW:
- Point 1: 2.59 (V/m) / sqrtW
- Point 6: 2.78 (V/m) / sqrtW
- Point 7: 3.00 (V/m) / sqrtW
- Point 2: 2.88 (V/m) / sqrtW
- Point 9: 3.23 (V/m) / sqrtW
- Point 4: 3.32 (V/m) / sqrtW
- Point 3: 3.61 (V/m) / sqrtW
- Point 5: 3.83 (V/m) / sqrtW
- Point 8: 4.11 (V/m) / sqrtW
To ensure point 1 (the lowest field point) reaches at least 10.0 V/m, the calculated forward power requirement is:
P = left(frac10.02.59right)2 = 14.9 Watts
At 14.9 Watts, the highest field point (Point 8) reaches:
Emax = 4.11 · sqrt14.9 = 15.86 V/m
Since 15.86 V/m falls below the 19.95 V/m upper tolerance limit (+6 dB above 10 V/m), all 9 points pass the field uniformity criterion at 14.9 Watts. The amplifier drive level for 400 MHz stores as 14.9 Watts net forward power. The power margin calculation stays valid only while the physical configuration inside the enclosure remains completely unchanged.
Standard calibration contract terms mandate that laboratory test reports specify the exact physical serial numbers of probes, cables, antennas, and power meters used during field mapping sweeps.
Wave
Electromagnetic propagation inside compact enclosures behaves quite differently from free-space conditions. At lower frequencies where wavelengths exceed one meter, transmitting antennas operate close to enclosure walls, creating reactive near-field coupling. Antenna radiation resistance shifts, and standing waves develop between the antenna structure, internal walls, and the equipment mounting surface.
Absorber materials designed to suppress reflections lose efficiency as the wave angle of incidence moves away from the normal axis.
Where Does the Calibration Shift Hide?
Spatial non-uniformity inside pre-scan enclosures stems from predictable wave interactions that degrade field quality across specific frequency bands. At frequencies below 200 MHz, cut-off modes inside small metal enclosures convert the volume into a high-Q resonant cavity unless ferrite lining covers all internal metal surfaces completely. Between 200 MHz and 1 GHz, radiation pattern distortion from log-periodic array antennas shifts the apparent phase center, causing non-linear field gradients across the test volume.
Above 1 GHz, localized reflections off floor absorbers create constructive and destructive interference fringes that change location rapidly with small shifts in frequency.
| Frequency Range | Dominant Wave Mode | Standard Tolerance Window | Pre-Scan Variance Limit | Primary Distortion Source |
|---|---|---|---|---|
| 80 MHz to 200 MHz | Near-field reactive coupling | 0 to +6 dB (75% points) | -2 to +8 dB allowed | Ferrite absorber saturation |
| 200 MHz to 1 GHz | Planar standing wave | 0 to +6 dB (75% points) | 0 to +6 dB mandatory | Phase center movement |
| 1 GHz to 3 GHz | Multipath interference | 0 to +6 dB (75% points) | 0 to +6 dB mandatory | Pyramidal tip reflections |
| 3 GHz to 6 GHz | High-order cavity modes | 0 to +6 dB (75% points) | 0 to +8 dB allowed | Cable radiation and leakage |
Absorber reflection coefficients degrading beyond -15 dB at oblique incidence angles destroy spatial field uniformity across small enclosure volumes.
Physical mechanisms causing severe field uniformity degradation inside compact immunity test spaces include operational and mechanical factors:
- Absorber Ageing and Mechanical Sag changes the physical distance between foam pyramidal tips and the uniform field boundary, shifting phase cancellation nulls.
- Cable Bundle Parasitic Radiation injects secondary fields into the test volume when signal line shielding falls below 80 dB attenuation across the exposure band.
- Enclosure Door Gasket Oxidation introduces high-impedance boundary slots that distort internal magnetic field return paths, altering planar symmetry.
- Amplifier Harmonic Distortion generates out-of-band energy that inflates broad-band field sensor readings without contributing to fundamental frequency field strength.
The extent to which uncalibrated localized field amplification inside a compact pre-scan chamber corrupts preliminary threshold data remains a subject of active study within electromagnetic research committees.

Matrix
Selecting an enclosure architecture for immunity pre-scanning involves weighing trade-offs between physical spatial field uniformity, facility cost, floor space, and calibration maintenance overhead. Full semi-anechoic chambers deliver exceptional field uniformity matching compliance standards, but demand significant capital expenditure and space. Compact chambers and TEM systems offer cost savings and reduced footprints, but demand rigorous spatial verification protocols to compensate for tight boundary constraints.
| Enclosure Architecture | Typical Working Volume | Field Uniformity Performance | Calibration Time | Capital Cost Index |
|---|---|---|---|---|
| Full Semi-Anechoic (3m) | 8.0m x 6.0m x 5.0m | High (0 to +3 dB typical) | 16 to 24 Hours | 100 |
| Compact Pre-Scan SAC | 3.0m x 3.0m x 2.5m | Moderate (0 to +6 dB) | 8 to 12 Hours | 35 |
| GTEM Cell (1500 type) | 1.5m x 1.5m x 1.0m | High along center line | 4 to 6 Hours | 15 |
| Shielded Pre-Scan Box | 0.8m x 0.8m x 0.8m | Low (-4 to +10 dB) | 2 to 4 Hours | 5 |
Engineers specifying pre-scan facilities balance calibration complexity against operational risks. A facility decision checklist assists in determining necessary field validation rigors:
- EUT Physical Envelope Check determines whether the product leaves a minimum 0.2-meter clearance to the absorber tips inside the uniform field region.
- Frequency Coverage Alignment verifies that the field probe bandwidth matches both fundamental frequencies and critical amplifier harmonic outputs.
- Forward Power Margin Review confirms that the power amplifier chain delivers required drive levels with at least 3 dB headroom above calculated baseline power.
- Verification Schedule Definition establishes mandatory re-mapping intervals based on chamber usage intensity and hardware reconfiguration frequency.
Factory absorber reflection data does not guarantee internal field uniformity; actual field conditions inside an operational laboratory depend on internal loading and cable layout.
Dossier
Data gathered inside a pre-scanning enclosure serves as an internal risk mitigation tool rather than direct proof of regulatory compliance. Technical documentation submitted to regulatory authorities, such as European Notified Bodies or the Federal Communications Commission, demands test reports generated by accredited laboratories operating under ISO/IEC 17025 standards. However, relying on pre-scan immunity measurements to make critical design changes requires proof that the pre-scanning environment provided an accurate, calibrated field distribution.
Unverified pre-scan field data consistently leads to over-engineering board-level filtering, adding unit manufacturing costs without improving real-world electromagnetic immunity.
Integrating standardized field uniformity mapping into internal pre-scan test dossiers bridges the gap between preliminary engineering sweeps and accredited certification testing. When an internal engineering report documents that pre-scanning occurred inside an enclosure verified to IEC 61000-4-3 field uniformity criteria, design engineers gain confidence that observed immunity thresholds will mirror formal compliance results. Maintaining traceable calibration files for internal pre-scan enclosures shields product teams against unexpected failures during final compliance testing.
Establishing clear audit documentation requires maintaining physical records of calibration sweeps, antenna positioning, amplifier drive profiles, and field probe calibration certificates. Internal verification dossiers prove that pre-scan measurements relied on controlled, repeatable spatial field distributions rather than uncalibrated estimates.
Solid compliance management dictates that a pre-scanning field verification file remains valid only as long as the internal metal structure, absorber configuration, and antenna mounting points remain completely unaltered.