Dielectric Permittivity Drift in Specific Absorption Rate Testing
Dielectric parameter drift alters measured local SAR, necessitating daily fluid calibration, mathematical correction factors, and strict regulatory drift verification.
Solvent
Tissue-simulating liquids approximate the dielectric behavior of human muscle and cranial tissue across assigned RF channels. Compliance evaluations rely on these mixtures to map spatial energy absorption whenever a transmitter operates in close proximity to the body. Both relative permittivity and electrical conductivity dictate coupling into the phantom, which directly shapes the peak spatial-average Specific Absorption Rate logged by electric-field probes.
If the chemical composition drifts during lengthy scan routines, energy distributes differently through the medium and skews the SAR values.
Any shift in liquid temperature immediately shifts relative permittivity.
Fluid Physics and Evaporation Dynamics
Standard SAR recipes rely on blends of sugar, salt, deionized water, and glycol derivatives. Below 3 GHz, simple sugar-salt-water solutions deliver the high relative permittivity and conductivity required to simulate head and body tissue. Past 3 GHz, manufacturers swap sugar for oil-in-water emulsions or glycol solvents ~ principally diethylene glycol butyl ether ~ to hold loss tangents steady across wide bandwidths.
When left open to ambient lab air during multi-day testing runs, these organic mixtures begin to volatilize.
As water evaporates from the bath, conductivity steadily climbs.
Extended scans alter the initial mass ratios through basic surface evaporation. Because water vaporizes much faster than organic solubilizers, salt and glycol concentrate within open shells like the Specific Anthropomorphic Mannequin or broad flat tubs. The rising salt fraction pushes electrical conductivity higher, while the lost water lowers real relative permittivity.
Left unmonitored over a forty-eight-hour run, this surface evaporation routinely drifts dielectric values clean outside standard compliance bands.
Evaporation elevates conductivity while depressing relative permittivity in glycol-based phantom media.
Temperature Coefficients and Dielectric Shifts
Open phantoms gradually equilibrate with the ambient test bay during long measurement cycles. As the liquid warms, real relative permittivity drops along a negative temperature coefficient between minus 0.3 percent and minus 0.5 percent per degree Celsius. Electrical conductivity moves the other way, climbing positive 1.2 percent to positive 2.1 percent per degree Celsius as heat accelerates ion mobility through the solution.
Laboratories track room temperature continuously to catch these thermal swings early.
| RF Frequency Band (MHz) | Target Permittivity (ε_r) | Target Conductivity (σ – S/m) | Permittivity Temp Shift (% / °C) | Conductivity Temp Shift (% / °C) |
|---|---|---|---|---|
| 450 | 43.5 | 0.87 | -0.32 | +1.85 |
| 835 | 41.5 | 0.90 | -0.38 | +1.92 |
| 1900 | 40.0 | 1.40 | -0.42 | +1.98 |
| 2450 | 39.2 | 1.80 | -0.46 | +2.05 |
| 5800 | 35.3 | 5.27 | -0.51 | +2.12 |
| Data measured under controlled laboratory conditions between 20.0°C and 24.0°C per IEC/IEEE 62209-1528 baseline specifications. | ||||
Temperature differentials between the lab atmosphere, phantom liquid, and active transmitter distort local field distributions. An uncorrected swing of three degrees Celsius overnight can shift fluid conductivity by more than six percent, pushing the medium outside regulatory limits while the automated test sequence runs unnoticed. Keeping fluid temperature within plus or minus two degrees Celsius of the starting calibration baseline remains necessary to collect defensible exposure data.
Liquid degradation generally traces back to four physical and chemical mechanisms:
- Volatile alcohol evaporation alters the solvent-to-water balance during overnight test sequences.
- Salt precipitation sets up localized conductivity pockets in flat phantom tanks that sit unagitated for multiple days.
- Thermal stratification produces dielectric differences between the surface layer and the probe depth inside deep SAM phantoms.
- Bacterial degradation consumes organic thickeners in older liquid formulations, destabilizing dielectric loss tangents.
Sealed stock containers hold nominal dielectric values indefinitely, but rapid evaporation begins the moment the recipe is poured into an open test tank.
Probe
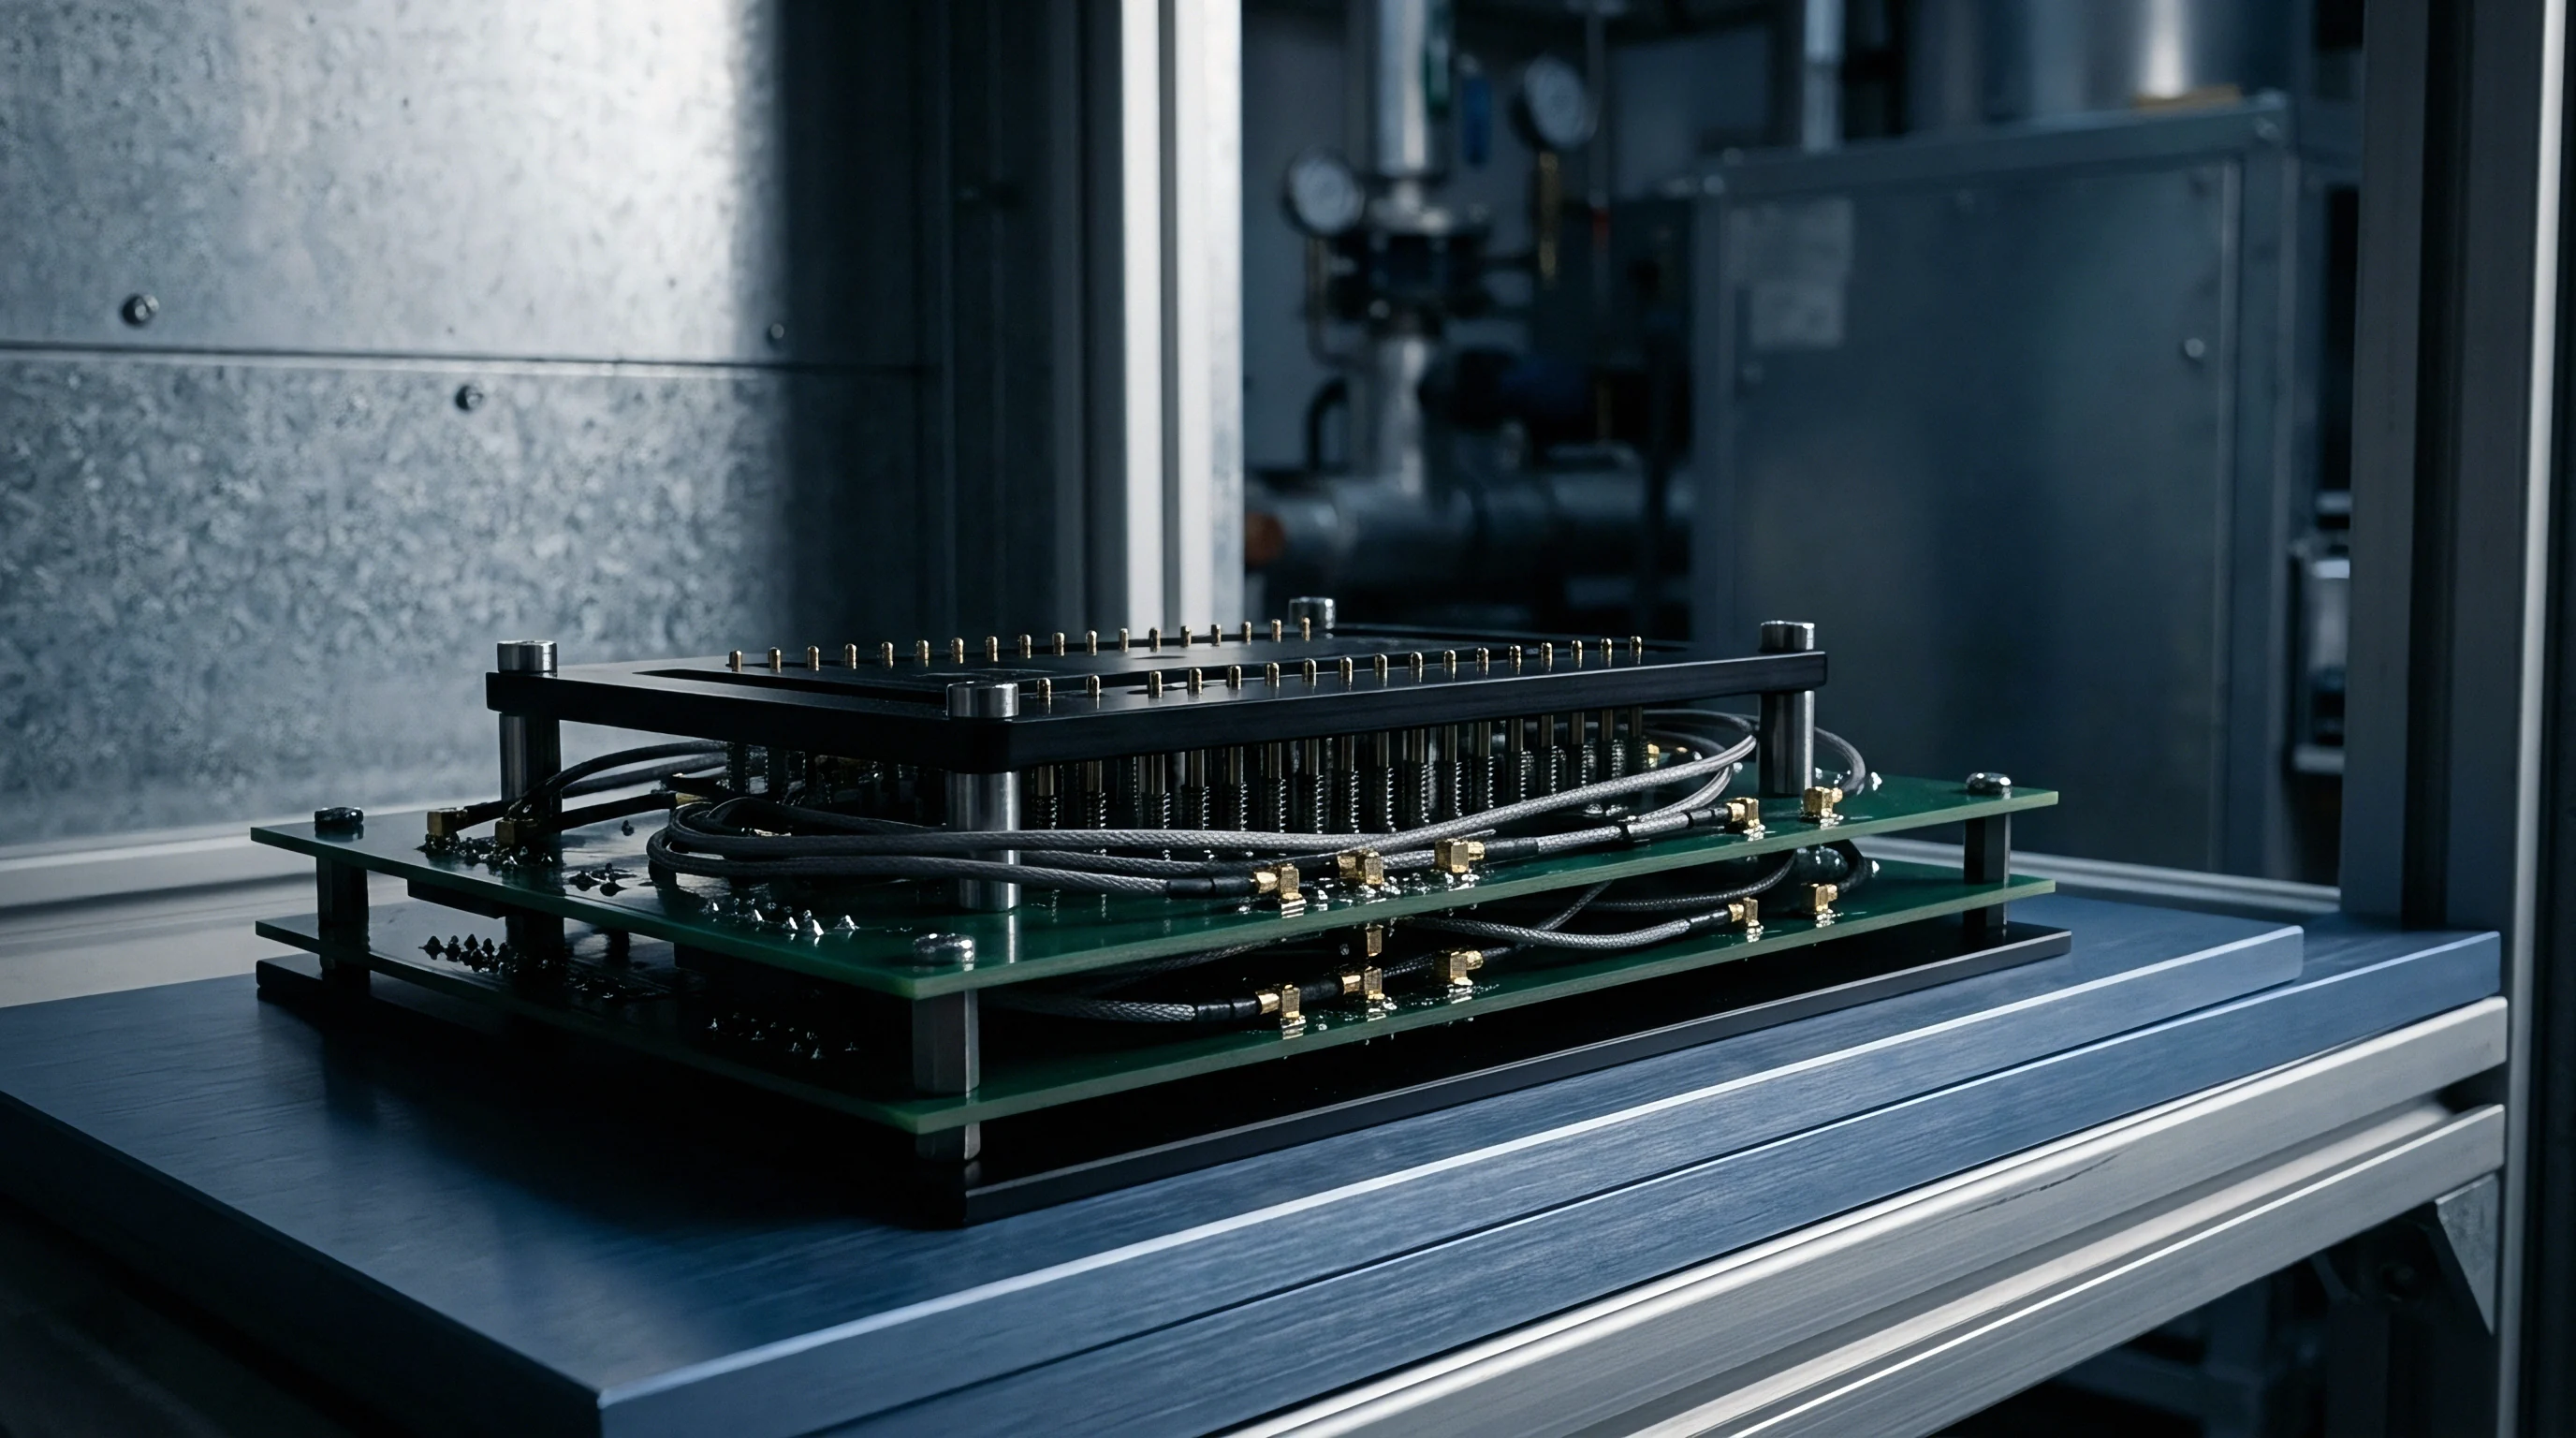
Open-ended coaxial immersion probes measure liquid dielectric properties via the complex reflection coefficient at the contact interface. Calculating valid permittivity and conductivity figures requires careful calibration before running any compliance checks. Minute air bubbles or physical burrs at the tip distort the fringing field, generating erroneous dielectric figures that carry straight into the final absorption metrics.
Coaxial probe tips require thorough baseline calibrations before use.
Metrology of Open-Ended Coaxial Systems
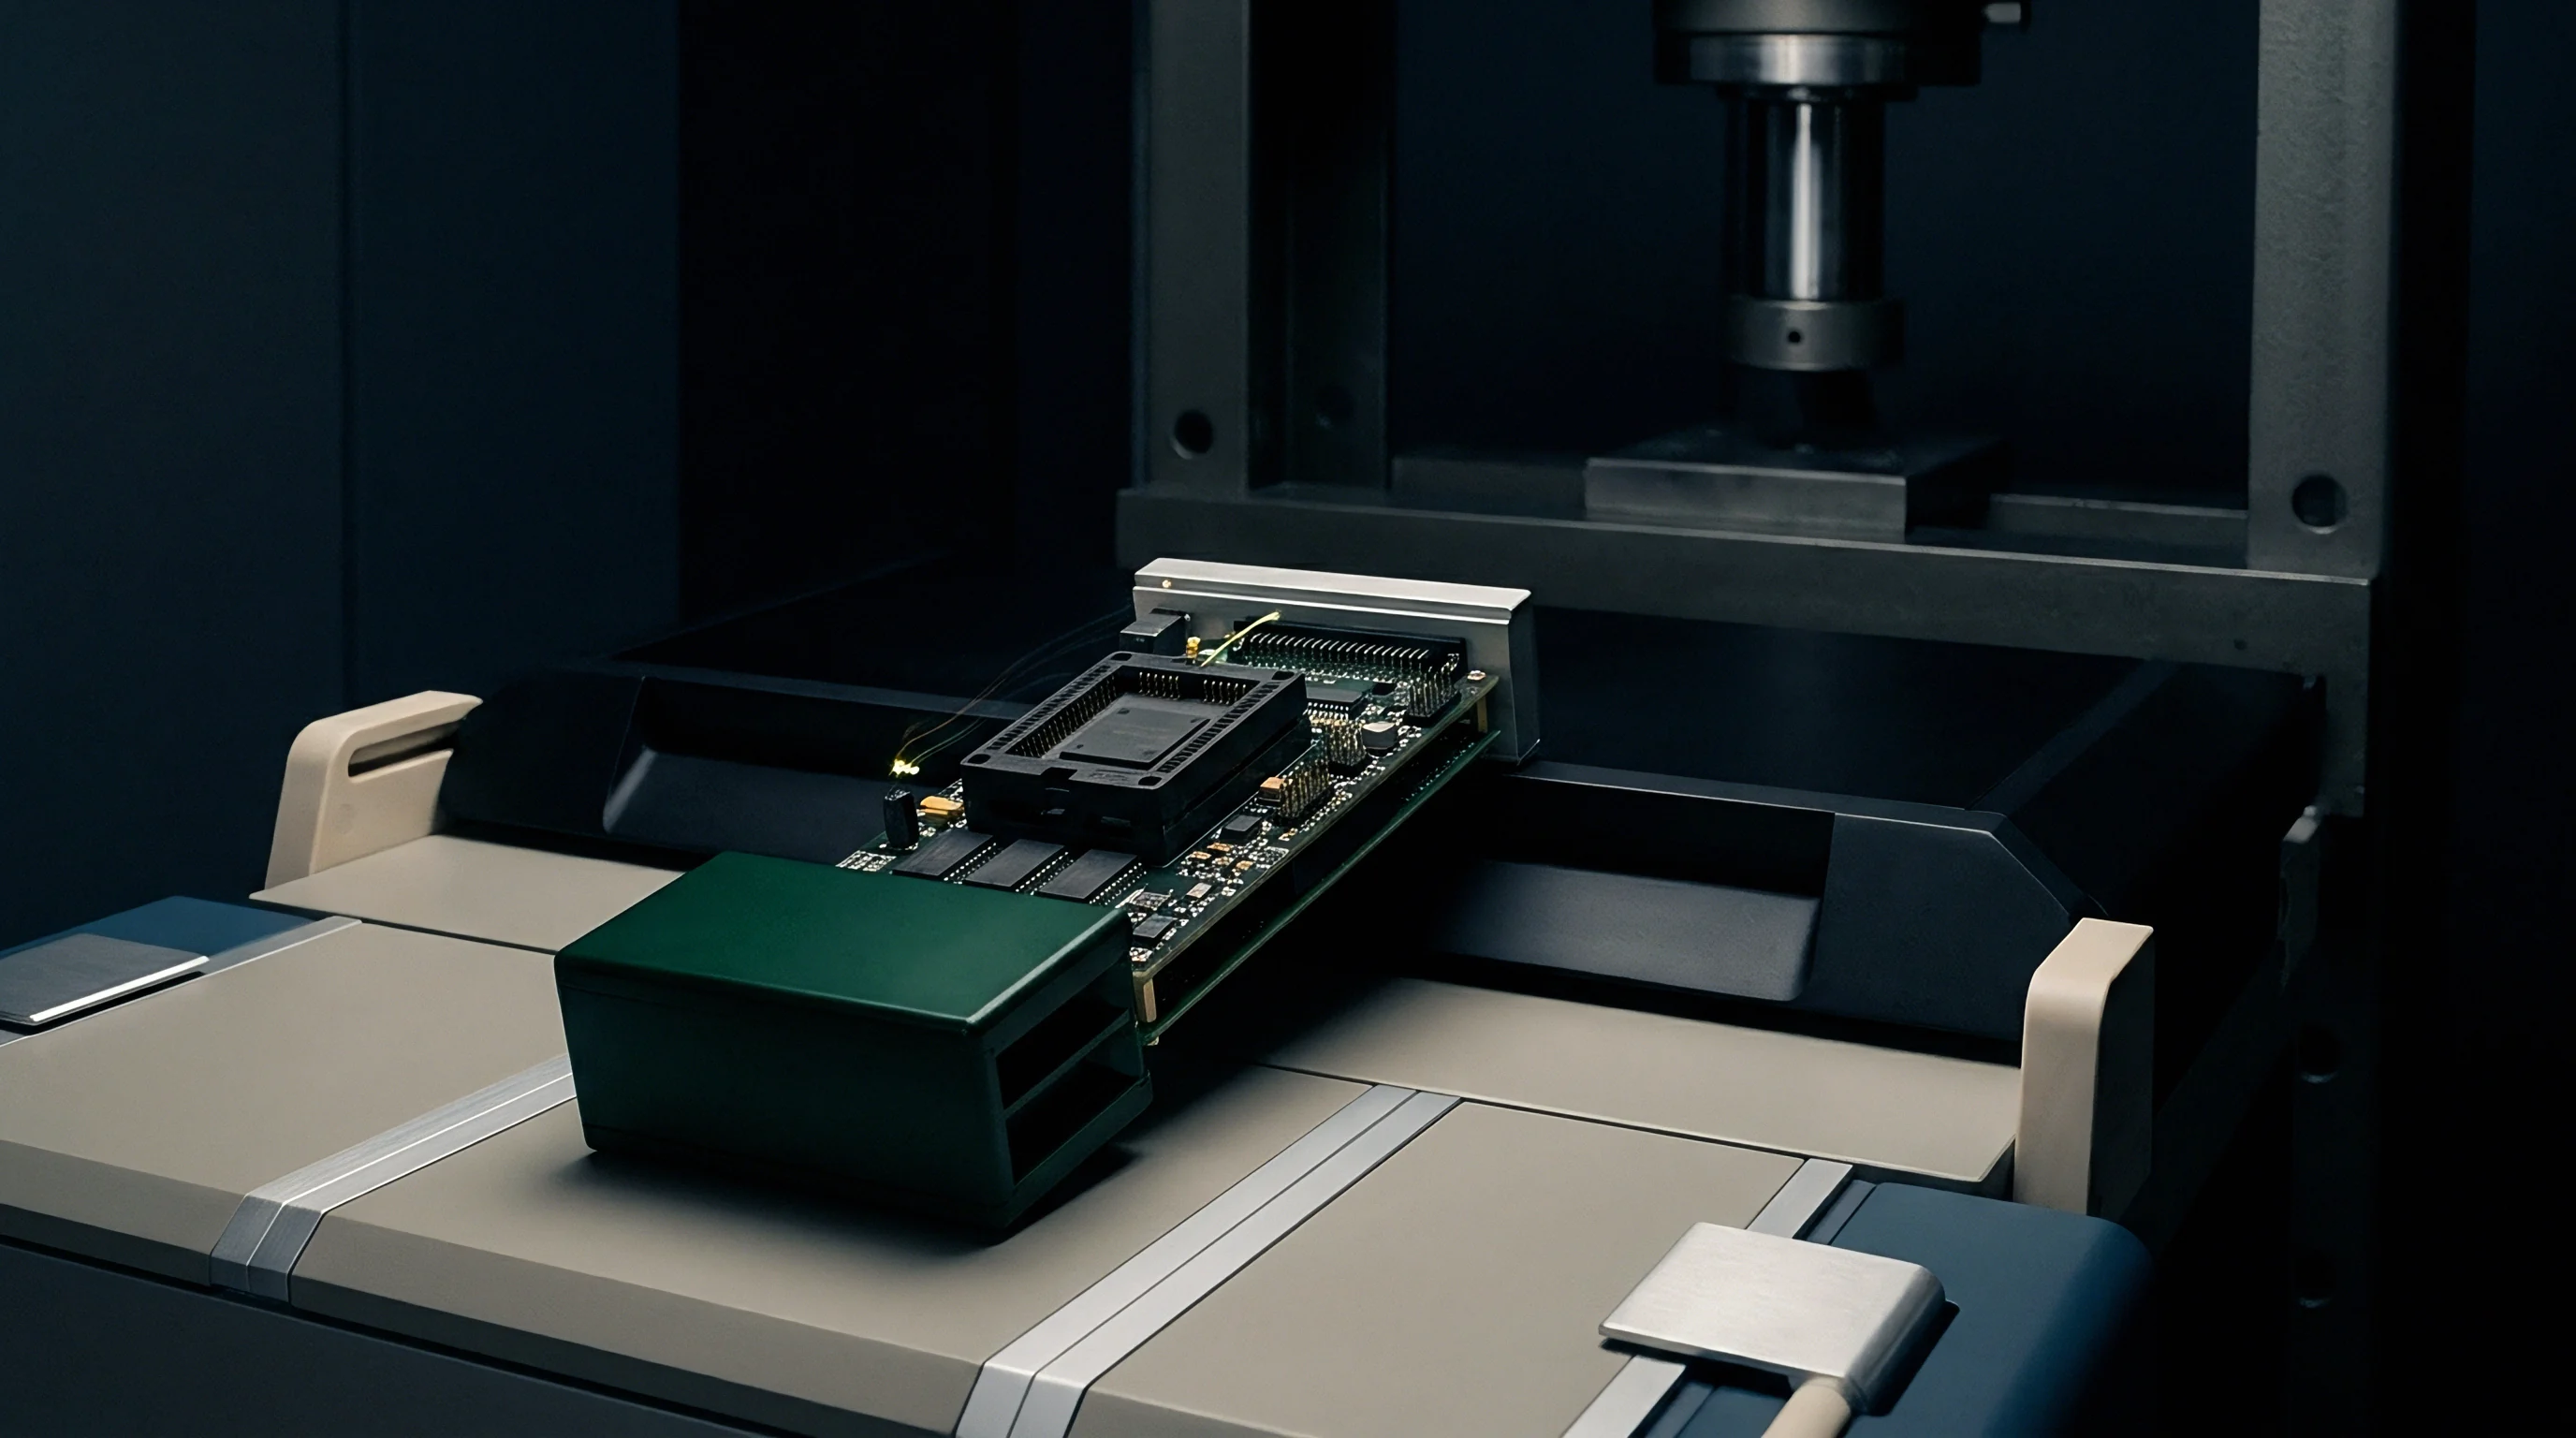
Vector network analyzers extract permittivity and conductivity by tracking phase and magnitude shifts in measured S-parameters. The probe face sets up a fringing electric field directly inside the surrounding tissue fluid. That reflection coefficient responds to the medium’s complex permittivity ~ both the real storage term (relative permittivity) and the imaginary loss term represented by electrical conductivity.
The analyzer logs these complex reflection coefficients at each frequency step.
Measurements above 3 GHz require slim probe diameters to prevent higher-order propagation modes across the aperture. Standard calibration follows a three-term error correction: an open reading in air, a precision shorting block, and deionized water held at a documented temperature. Any mechanical offset at the calibration plane or trace residue on the probe face introduces phase skew, biasing readings across the entire band.
Calibration Routines and Verification Sequences
Before starting daily SAR sweeps, operators check probe accuracy against reference liquids with established physical properties. Pure deionized water, ethanol, and traceable sugar-salt batches serve as standard verification media. Technicians profile the liquid across the transmitter’s entire operating band before pouring it into test phantoms.
Structured verification ensures uncorrected drift never corrupts the compliance record. Checking fluid validity before automated scans involves five steps:
- Thermometers log the phantom fluid temperature to ensure it remains within two degrees of the reference calibration.
- The network analyzer executes an open-short-load calibration against reference artifacts and pure deionized water at twenty-two degrees Celsius.
- Technicians dip the probe tip into the tissue medium, making sure no air bubbles cling to the sensing face.
- The acquisition software records permittivity and conductivity across every active channel assigned to the transmitter.
- Scripts calculate percentage drift against standard targets to clear the liquid before the robotic scanner starts.
Logging liquid parameters both immediately before and after testing prevents unnoticed drift from voiding completed SAR evaluations.
Calculus
Mathematical corrections adjust raw SAR values whenever fluid parameters stray from nominal target properties. Standards require these algorithms to offset fluid aging, protecting compliant hardware from spurious failures while preventing non-compliant devices from slipping through. Tracking absorption sensitivity against dielectric variation shows precisely how parameter drift will nudge reported exposure numbers up or down.
Parameter drift past five percent makes mathematical correction mandatory.
Sensitivity Coefficients and SAR Scaling
Variations in conductivity and permittivity alter electromagnetic field decay and spatial absorption depth inside the phantom. When relative permittivity drops, the wave decays more slowly, allowing energy to travel deeper and pushing up localized peak SAR. Rising conductivity increases attenuation near the phantom wall, reshaping power concentration based on antenna geometry and scan depth.
Calculated corrections then replace the raw SAR values in the report.
Under IEEE/IEC 62209-1528, sensitivity coefficients govern how 1g and 10g peak SAR respond to percentage offsets in fluid properties. The corrected result scales raw SAR by a factor derived from permittivity and conductivity drift:
SAR_corrected = SAR_measured (1 + C_epsilon delta_epsilon + C_sigma delta_sigma)
Here C_epsilon and C_sigma are the partial derivative sensitivity coefficients for peak SAR with respect to relative permittivity and conductivity, while delta_epsilon and delta_sigma are percentage deviations from nominal target values. Around 2450 MHz, C_epsilon is typically negative at roughly minus 0.45, while C_sigma is positive at approximately plus 0.70.
Peak spatial average SAR shifts up to 0.7 percent for every single percentage point change in tissue liquid conductivity at high wireless frequencies.

Worked Example of Mathematical SAR Correction
Take a 2450 MHz body-worn transmitter undergoing testing in a flat phantom. Regulatory targets specify a relative permittivity of 52.7 and electrical conductivity of 1.95 S/m. A pre-test probe sweep reveals actual bath values of 49.5 for relative permittivity (a minus 6.07 percent shift) and 2.08 S/m for conductivity (a plus 6.67 percent shift).
Permittivity shifts distort spatial absorption profiles throughout the liquid.
The automated scanner completes its area and zoom routines, recording an uncorrected raw peak 1g SAR of 1.25 W/kg. Because both dielectric deviations exceed the plus or minus five percent threshold, regulations mandate numerical correction before filing. Applying flat-phantom sensitivity coefficients for 2450 MHz (C_epsilon = -0.45, C_sigma = +0.70) yields the correction factor:
Correction Factor = 1 + (-0.45 -0.0607) + (+0.70 +0.0667)
Correction Factor = 1 + 0.0273 + 0.0467 = 1.0740
SAR_corrected = 1.25 W/kg 1.0740 = 1.3425 W/kg
That dielectric drift bumps the reported SAR from 1.25 W/kg to 1.34 W/kg. For hardware sitting just below the 1.6 W/kg limit, mathematical scaling of this magnitude can push the final filing into non-compliance.
| Frequency (MHz) | Permittivity Sensitivity (C_ε) | Conductivity Sensitivity (C_σ) | Max Drift without Correction (%) | Correction Boundary (%) |
|---|---|---|---|---|
| 835 | -0.35 | +0.45 | ±5.0 | ±10.0 |
| 1900 | -0.40 | +0.60 | ±5.0 | ±10.0 |
| 2450 | -0.45 | +0.70 | ±5.0 | ±10.0 |
| 5200 | -0.50 | +0.85 | ±5.0 | ±10.0 |
| 5800 | -0.55 | +0.95 | ±5.0 | ±10.0 |
Clause 7.8 of IEC/IEEE 62209-1528 enforces this numerical scaling whenever tissue liquid parameters drift between positive five percent and positive ten percent off target standards.

Tolerance
Regulatory agencies enforce rigid tolerances on tissue dielectric properties so test results hold up across different laboratories. Fixed acceptance windows stop test facilities from gaming exposure numbers with off-spec recipes. Once fluid drift crosses regulatory ceilings, authorities reject the test report outright, stalling the equipment authorization.
Standard compliance rules establish hard administrative boundaries for these fluids.
Regulatory Limits across Global Filings
The Federal Communications Commission and European notified bodies handle fluid deviations through different administrative thresholds. Under FCC KDB 865664 D01, targets carry a plus or minus five percent tolerance for relative permittivity and conductivity. When liquid parameters sit within five percent of nominal targets, measured SAR can be submitted unadjusted, provided the variation has not artificially depressed reported exposure.
Submitting uncorrected SAR data from drifting fluid invalidates the filing.
European filings governed by EN 50360 and EN 50566 allow wider fluid swings up to plus or minus ten percent under IEC/IEEE 62209-1528, as long as mathematical scaling corrects the final SAR figure across the deviation range. Once permittivity or conductivity drifts beyond ten percent, however, the run is void regardless of correction algorithms; the lab must dump the phantom and mix fresh fluid.
FCC KDB 865664 D01 invalidates test runs where target tissue dielectric parameters drift beyond positive or negative five percent without applied mathematical correction.
When Does Fluid Shift Force Test Invalidation?
Drift beyond ten percent voids the scan outright, requiring chemistry adjustments and a complete rerun. Scans also face immediate invalidation if post-test verification shows fluid parameters shifted more than one or two percent from the pre-scan baseline, which points to active chemical instability during data acquisition.
Higher frequency bands show steep sensitivity to minor dielectric changes.
Filing compliance reports with uncorrected, out-of-spec fluid numbers routinely triggers audit failures. Certification bodies screen fluid tables using automated scripts that cross-check recorded values against official targets across every active RF channel.
Laboratories verify four distinct fluid parameters before packaging regulatory dossiers:
- Target parameter audit confirms measured relative permittivity stays within five percent of nominal values on all active channels.
- Conductivity drift logging records pre- and post-scan fluid values to prove chemical stability over long test sequences.
- Mathematical SAR scaling applies correction factors to reported numbers whenever parameters drift between five and ten percent.
- Temperature tracking documentation proves phantom fluid stayed within two degrees Celsius of starting calibration levels throughout the run.
Regulatory committees continue to evaluate whether millimeter-wave power density assessments will need dynamic dielectric corrections comparable to those used in sub-6 GHz SAR testing.
Dossier
Equipment authorization packages filed with telecommunication certification bodies must provide dielectric calibration logs and liquid temperature histories for each scan. Reviewers inspect these records to ensure submitted SAR numbers reflect actual physical exposure rather than artificial dampening from degraded liquid. Gaps or inconsistencies in fluid tables immediately stall grant approvals.
Uncorrected dielectric drift leads directly to filing rejections.
Audit Vulnerabilities in Test Reports
Agencies routinely flag test reports when liquid logs reveal uncorrected drift past regulatory tolerances. Frequent mistakes include missing post-test fluid measurements, omitting temperatures alongside permittivity records, and misapplying correction formulas across multi-band devices.
Detailed calibration logs defend test claims during agency audits.
Telecommunications certification bodies maintain strict scrutiny over broadband tissue fluids used across wide frequency spans. While broadband liquids reduce phantom changeover time in high-throughput testing facilities, their dielectric properties curve across frequency differently than narrow-band single-frequency formulations. Audit agencies verify that broadband fluids meet target parameters at every individual channel frequency evaluated, rather than relying on a single center-frequency calibration point.
Vector network analyzer probe calibrations degrade quickly when test fluid temperatures shift during extended multi-band SAR measurement sequences.
Commercial Impacts of Chamber Invalidation
Documentation rejections disrupt launch timelines by forcing facilities to rebook scarce chamber time and run full retests. Automated SAR chamber time runs 1,500 to 3,000 USD per day. Re-evaluating an eight-band smartphone after liquid logs fail audit burns three to five chamber days, racking up substantial retest expenses and delaying market release by weeks.
Unscheduled chamber reruns quickly derail tight product release schedules.
| Regulatory Market | Target Drift Threshold (%) | Administrative Action on Non-Compliance | Schedule Delay (Weeks) | Retest & Refiling Cost (USD) |
|---|---|---|---|---|
| United States (FCC) | > ±5.0 without math correction | Dismissal of Grant Application | 3 to 6 | 8,500 – 18,000 |
| European Union (CE) | > ±10.0 absolute limit | Notified Body Certificate Denial | 2 to 4 | 5,000 – 12,000 |
| Canada (ISED) | > ±5.0 without math correction | Technical Acceptance Certificate Hold | 3 to 5 | 7,000 – 15,000 |
| Japan (MIC / Giteki) | > ±5.0 target deviation | Type Certified Construction Failure | 4 to 8 | 10,000 – 22,000 |
Skipping daily phantom fluid checks invites outright dossier rejection, piling multi-week delays and thousands of dollars in chamber fees onto the launch schedule.