Establishing Baseline Electromagnetic Quiet Zones for Pre Scan Testing
Establishing a verified pre-scan quiet zone baseline isolates host emissions from ambient noise, preventing costly formal accredited chamber retests.
Floor
Thermal agitation across receiver input impedances sets the physical lower limit for radiated spurious pre-scanning. Outside an accredited semi-anechoic chamber, capturing weak emissions requires establishing an exact instrumentation baseline before gathering radiated data. If system noise floor exceeds unsuppressed product emissions, non-compliances slip through early engineering checks and only surface during formal compliance testing under CISPR 32 or FCC Part 15.
Sensitivity Mechanics in Non Anechoic Space
Resolution bandwidth settings dictate the visible display noise floor on a spectrum analyzer. Standard commercial EMC pre-scans use a 120 kHz resolution bandwidth between 30 MHz and 1 GHz, per CISPR 16-1-1. Thermal noise across a 50-ohm load ~ calculated from Boltzmann’s constant, absolute temperature, and measurement bandwidth ~ yields a theoretical limit of -123 dBm at room temperature across that 120 kHz bandpass.
Without external amplification, a receiver noise figure typically sits between 10 dB and 15 dB. Placed near the antenna terminals, a high-gain, low-noise preamplifier (such as one with a 2.5 dB noise figure and 25 dB gain) lowers the combined noise figure, pulling weak signals out of the instrument noise and dropping the visible noise floor closer to theoretical limits.
Thermal noise across a 120 kHz resolution bandwidth sets the theoretical receiver sensitivity floor at -123 dBm before antenna factor corrections.

Transducer Factors and Instrument Sensitivity
Antenna factors convert terminal voltage into incident electric field strength, but they vary sharply across the 30 MHz to 1 GHz range. For typical biconical and log-periodic arrays, values often climb from 6 dB/m at 80 MHz to over 26 dB/m at 900 MHz. Higher antenna factors at higher frequencies raise the effective measurement noise floor, burying weak emissions beneath the analyzer trace.
Cable attenuation compounds these transducer losses as frequency rises. Double-shielded RG-223 cable, for instance, adds around 0.4 dB per meter at 100 MHz and reaches 1.5 dB per meter at 1 GHz. Mounting the preamplifier right at the antenna output overcomes cable loss, preserving dynamic range across the full sweep so pre-scans capture true product emissions rather than instrument noise characteristics.
Ambient
External RF energy easily floods unshielded test spaces, hiding device emissions beneath commercial radio, cellular downlinks, and municipal networks. Isolating product radiation from this background is the main hurdle in open-area or semi-shielded pre-scanning; without a verified baseline, ambient signals get mistaken for product failures, triggering wasted redesign cycles.
Temporal RF Mapping Protocols
Ambient spectra shift throughout the day as local traffic fluctuates. Capturing peak activity across key bands requires recording continuously over multiple 24-hour cycles. In dense urban areas, background fields frequently surpass 40 dBuV/m in FM broadcast bands (88 MHz to 108 MHz) and cellular downlinks (758 MHz to 788 MHz) ~ levels that fully mask Class B regulatory limits at a 3-meter distance.
Peak detectors capture maximum instantaneous background amplitudes, whereas quasi-peak detection separates continuous occupancy from transient impulse noise. Directional antennas help locate external transmitters so test engineers can distinguish plane waves from local DUT emissions ~ a necessary step, since single static sweeps fail whenever the ambient background shifts mid-test.
Signal Masking and Ambient Discrimination
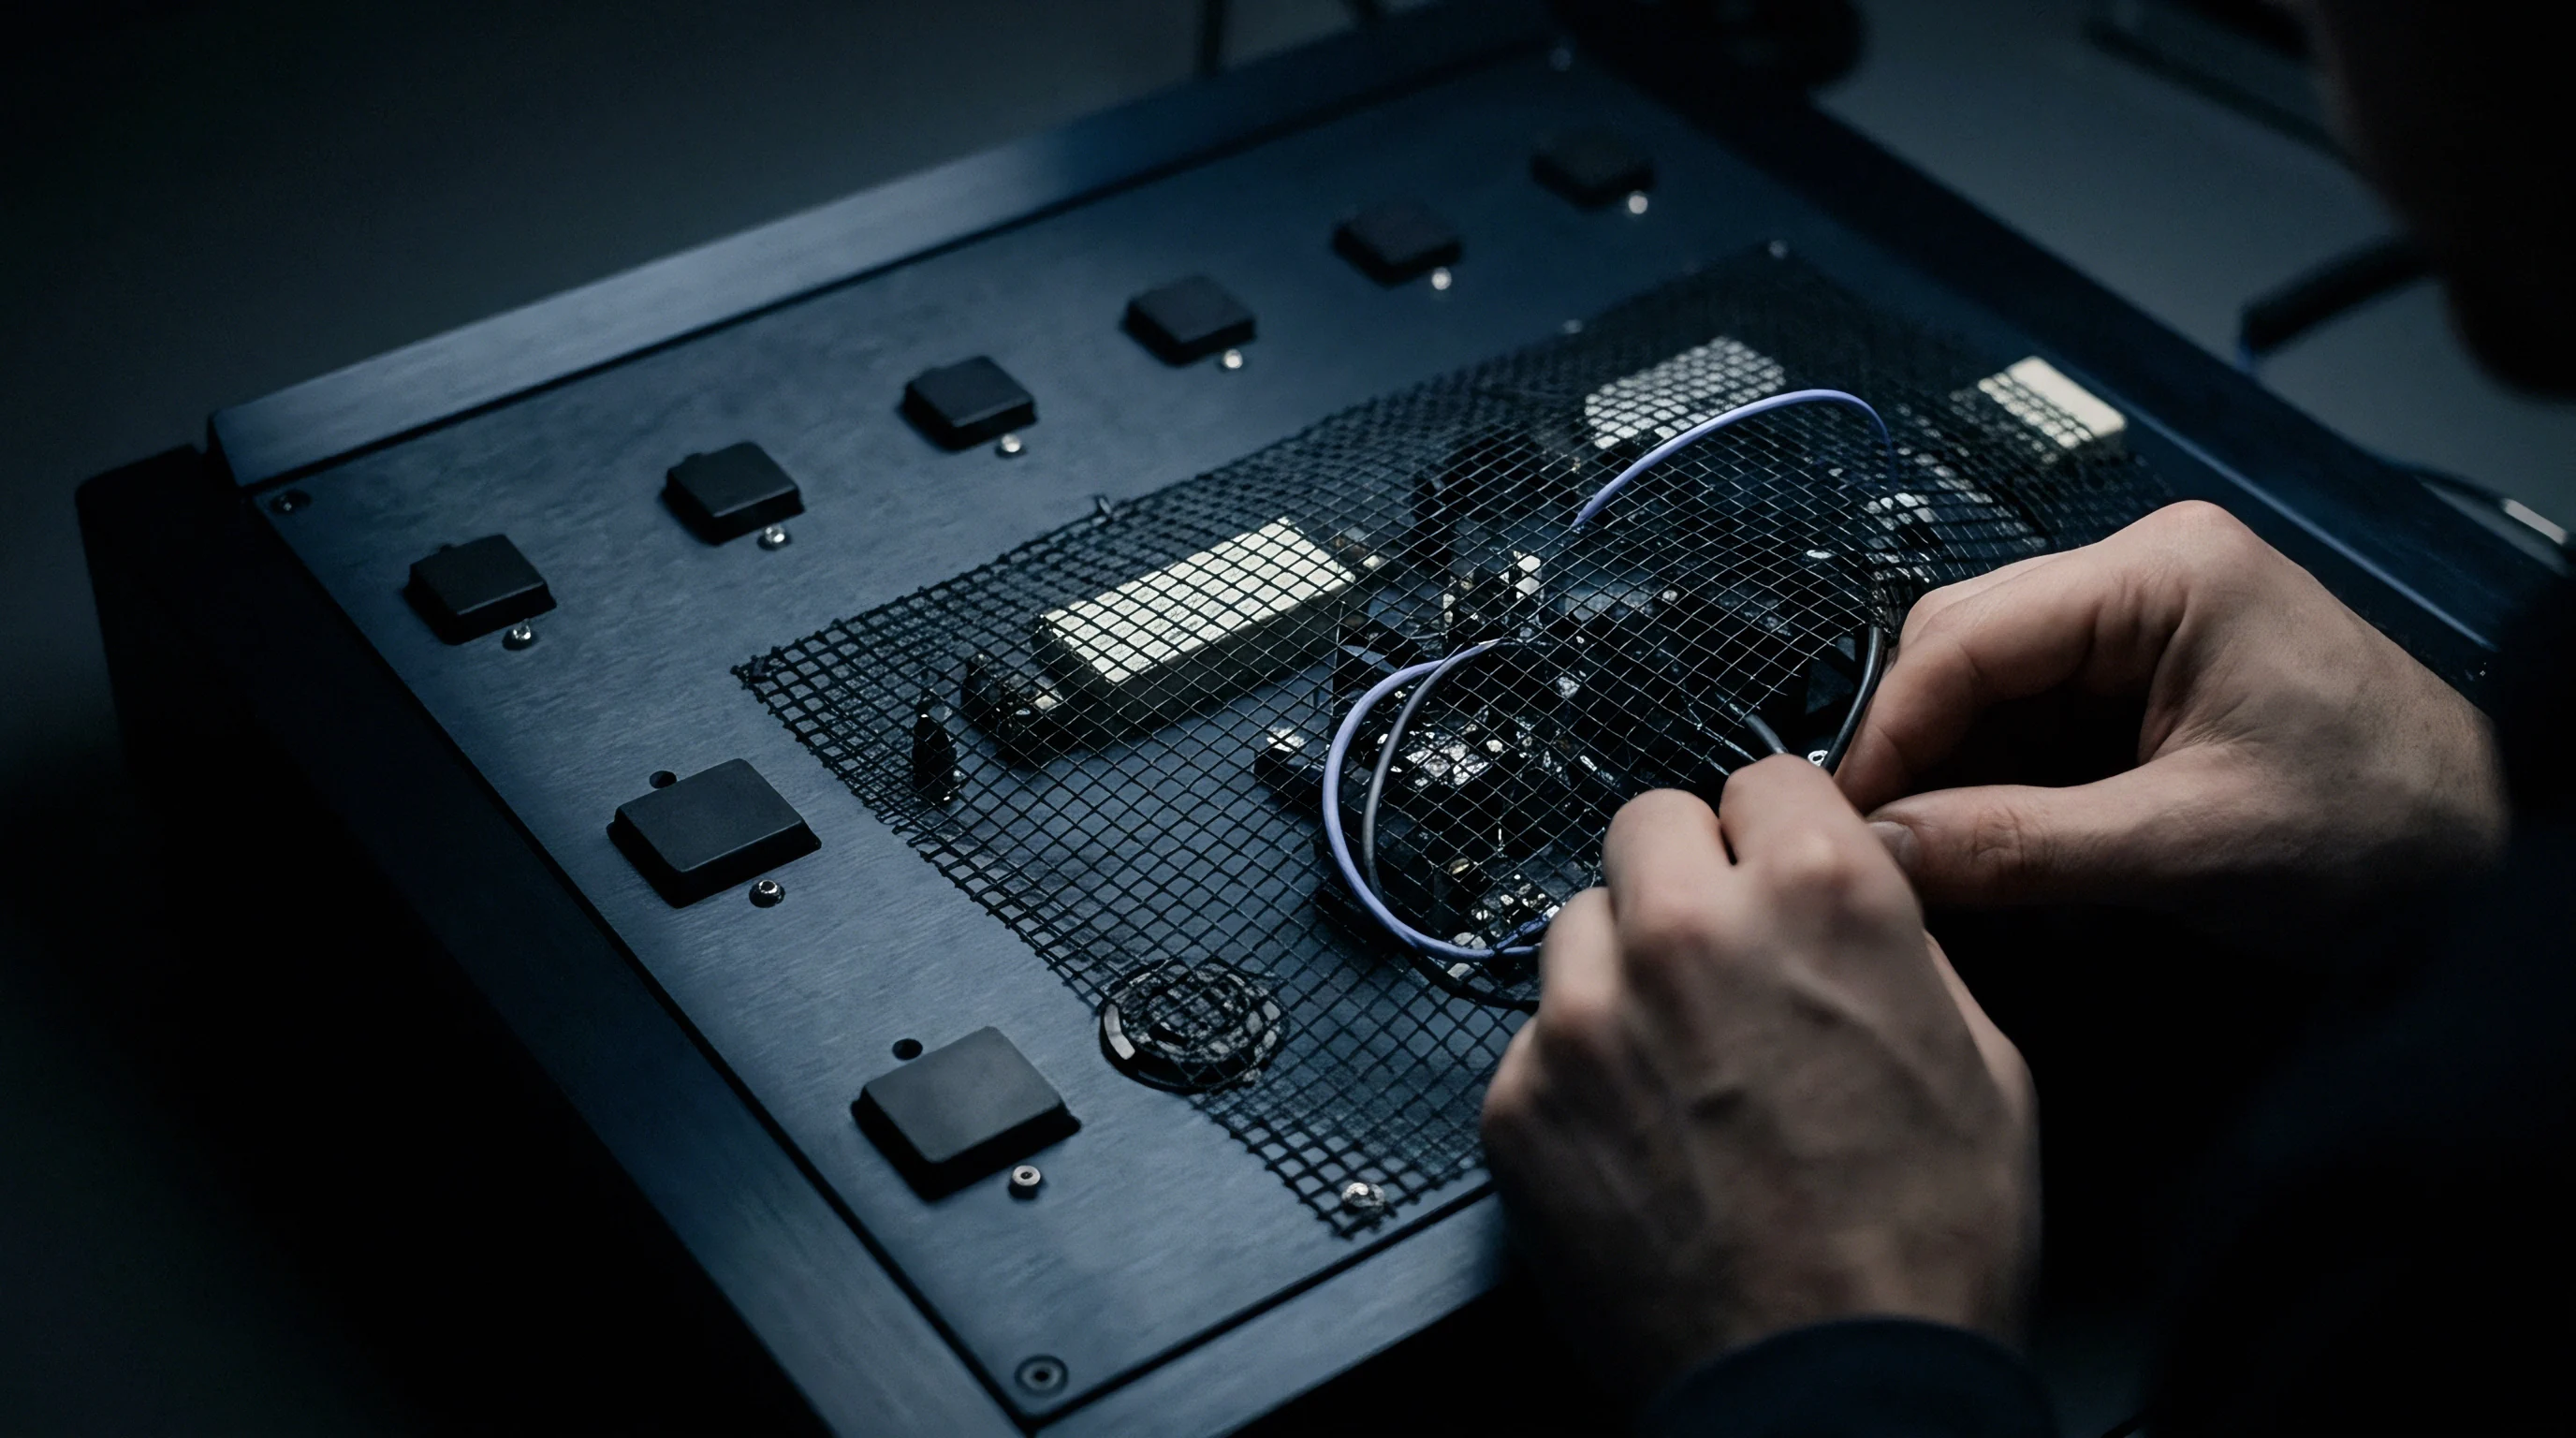
Separating product radiation from ambient signals relies on systematic power cycling and near-field probing. Powering down the unit under test reveals which signals belong strictly to the environment, allowing baseline subtraction software to isolate host emissions across unshielded bands.
| Frequency Spectrum | Primary Ambient Sources | Typical Field Strength | Mitigation Strategy |
|---|---|---|---|
| 30 MHz – 88 MHz | VHF Land Mobile, Industrial ISM | 25 to 35 dBuV/m | Ferrite absorber loading, near-field probing |
| 88 MHz – 108 MHz | Commercial FM Broadcasting | 40 to 60 dBuV/m | Faraday enclosure, localized baseline subtraction |
| 174 MHz – 216 MHz | VHF Digital Television | 30 to 45 dBuV/m | Orienting antenna null toward broadcast tower |
| 700 MHz – 960 MHz | LTE / 5G Cellular Downlinks | 35 to 55 dBuV/m | Modular shielded tent, coaxial line filtering |
| 2.4 GHz – 2.5 GHz | Wi-Fi, Bluetooth, ISM Heating | 45 to 65 dBuV/m | Local quiet tent, dynamic spectrum notch filters |
Reflections in unshielded spaces make baseline subtraction harder. Structural steel, walls, and lab furniture create standing waves and spatial resonances that alter ambient signals and device radiation profiles. Shifting the device under test along a grid verifies whether spectral peaks come from internal clock harmonics or external reflections, clarifying whether pre-scan spikes originate from environmental noise or the unit itself.

Attenuation
Decibel attenuation of external RF energy defines the boundary of any pre-scan quiet zone. Shielded enclosures, fabric tents, and line filters must work together to isolate the test unit from ambient spectrum noise, balancing weight, physical layout, and filter insertion loss on the lab floor.
Portable Enclosure Shielding Performance
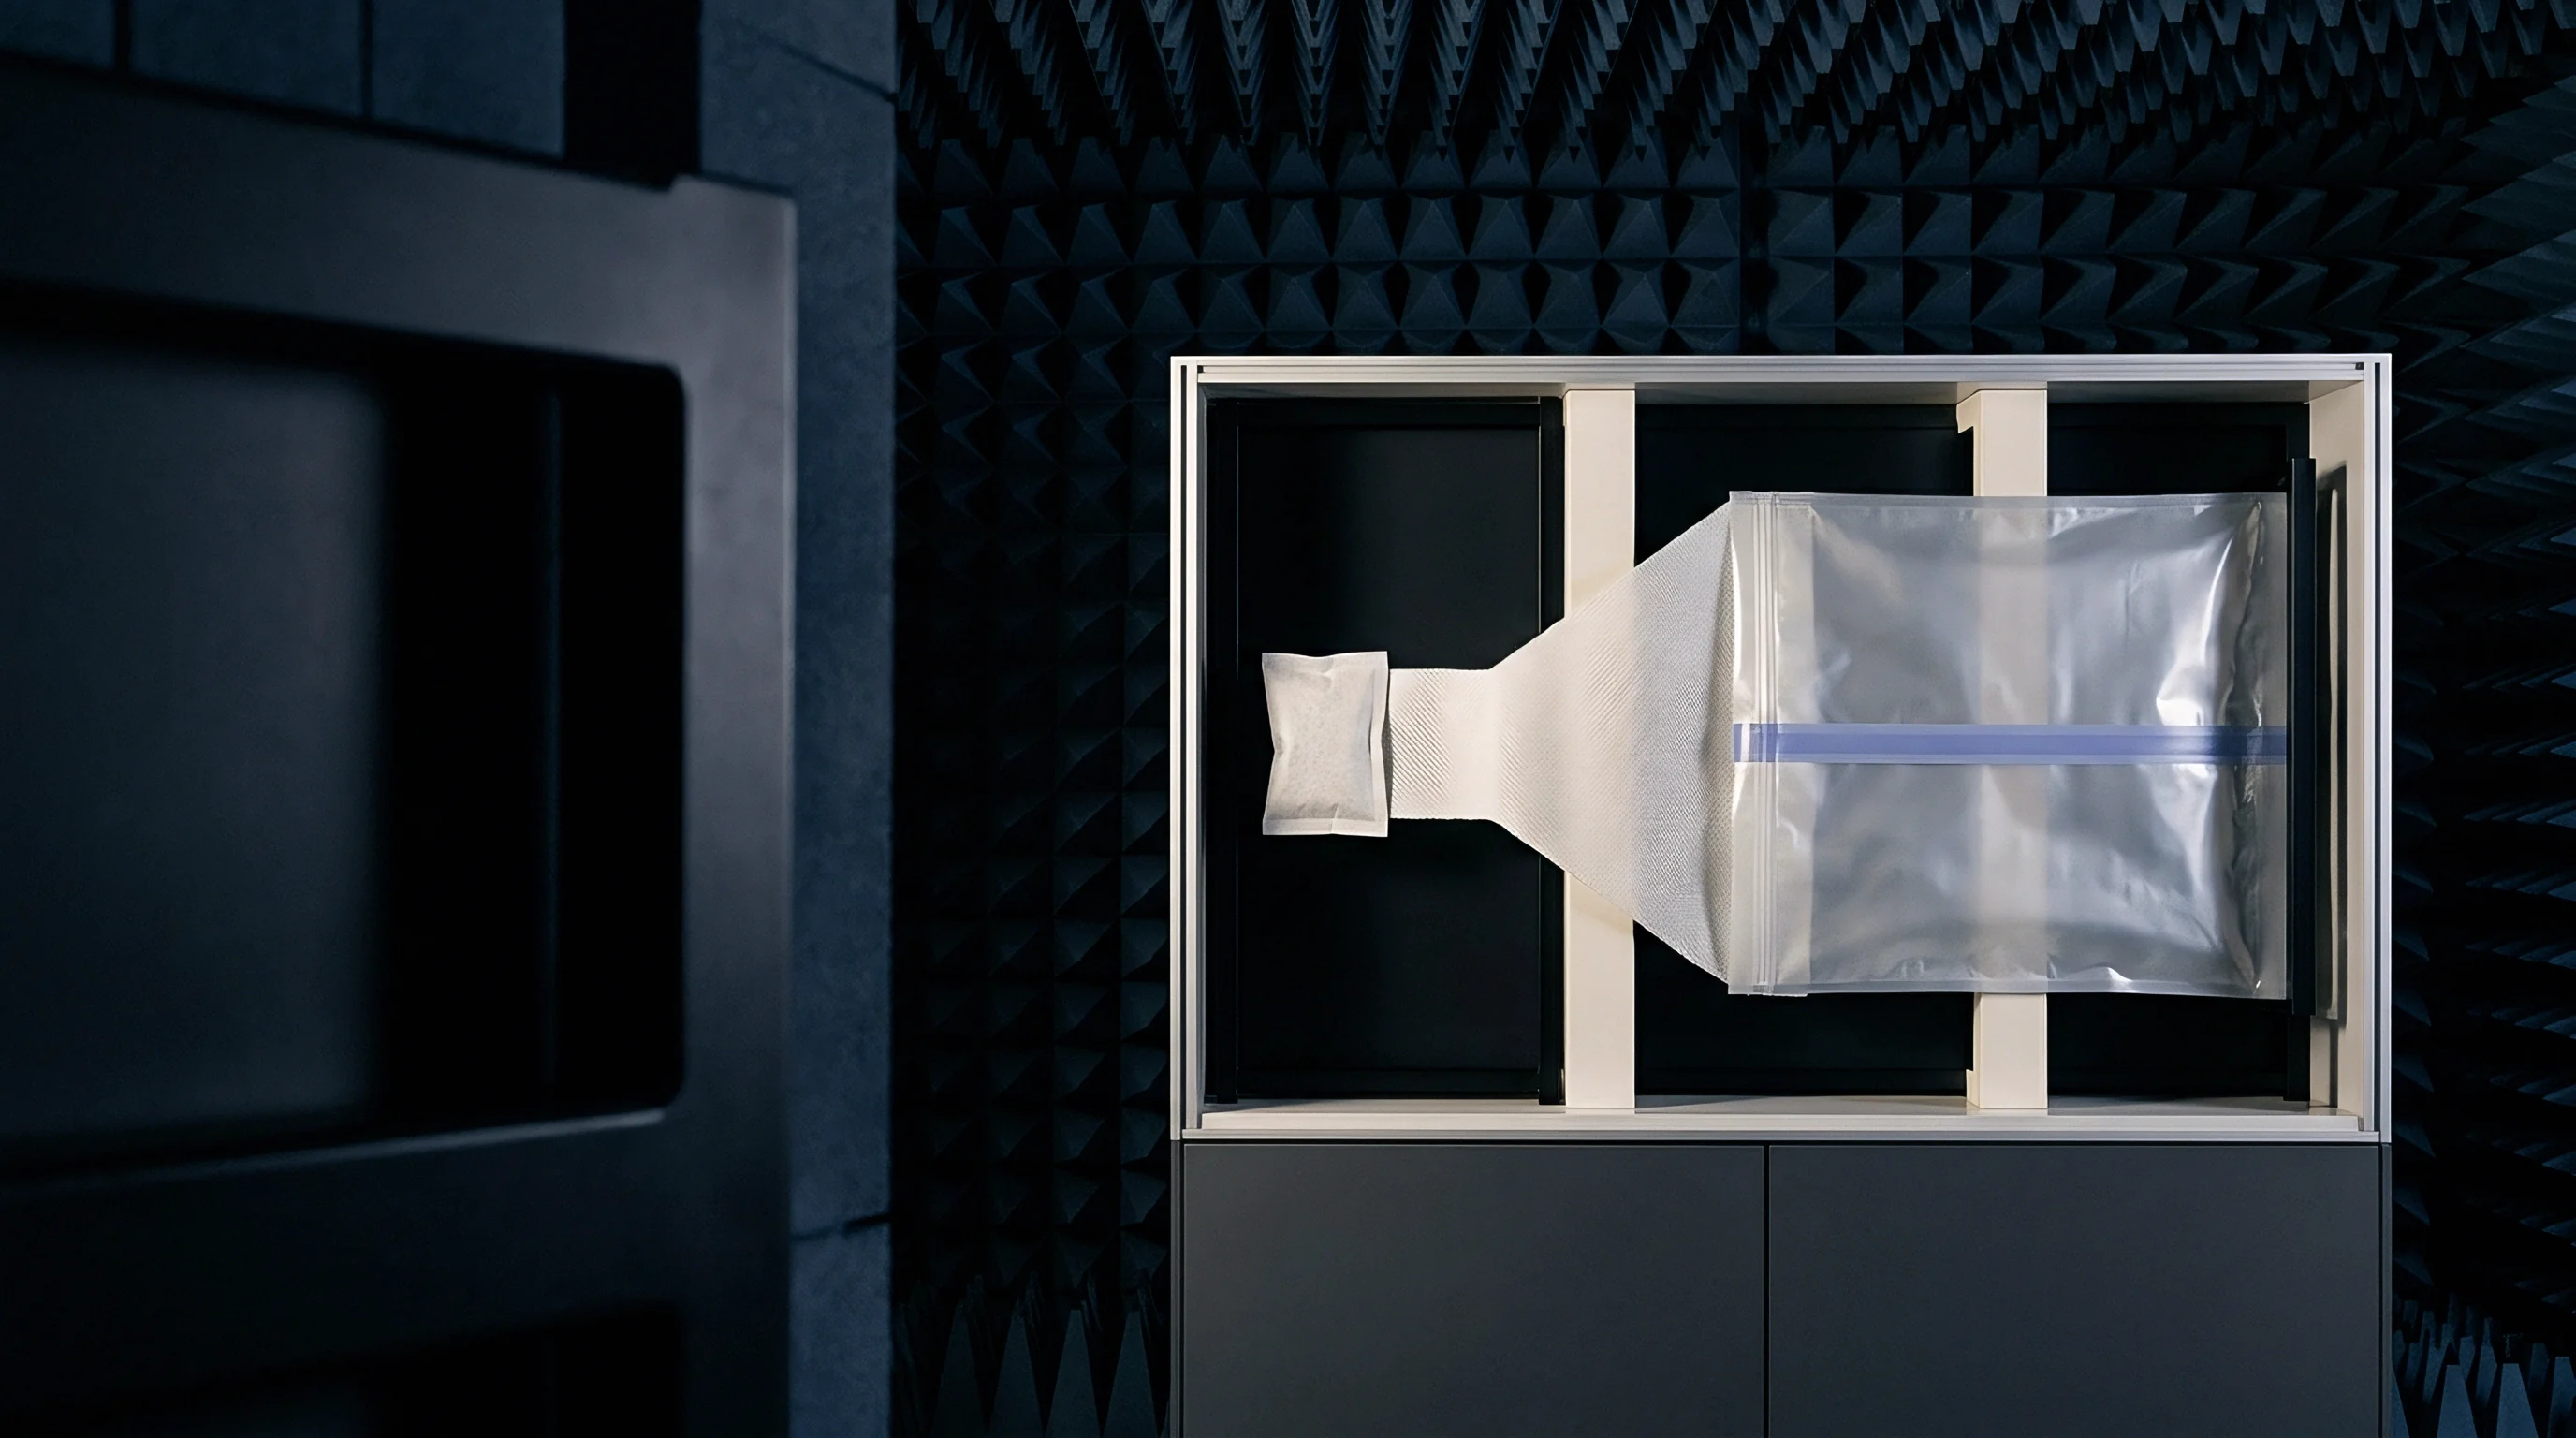
Flexible enclosures made from nickel-copper metallized textiles offer convenient isolation for quick pre-scans. Properly sealed double-layer fabric tents achieve 60 dB to 80 dB of shielding effectiveness from 30 MHz to 3 GHz, though performance drops at seam apertures, door zippers, and cable feedthrough panels.
Attenuations drop sharply whenever physical gaps exceed one-twentieth of the wavelength. At 1 GHz, a gap larger than 15 millimeters forms a slot antenna that lets ambient RF penetrate the interior. Maintaining frame grounding and conductive gasket compression across access panels prevents these apertures, while biconical antennas handle measurements across lower frequency bands.
A 60 dB enclosure attenuation rating reduces an external 50 dBuV/m ambient signal down to -10 dBuV/m inside the quiet zone.
Which Ambient Noise Thresholds Threaten Pre Scan Validity?
External field strengths need to stay at least 10 dB below the regulatory limit across target frequencies to prevent measurement corruption. If ambient noise sits just 3 dB below a Class B threshold, a fully compliant device emitting at that same frequency will combine vectorially to breach the limit, producing a false failure.
Mains power line interference also compromises quiet zone stability. Multi-stage AC line filters providing at least 70 dB of common-mode and differential-mode insertion loss from 150 kHz to 30 MHz block conducted grid noise and prevent power line leakage from entering the space.
- Mains Power Line Filtering integrates multi-stage inductor-capacitor networks achieving 70 dB insertion loss to block conducted power grid noise from entering the enclosure.
- I/O Signal Feedthrough Panels utilize filtered D-sub or shielded RJ45 pass-through connectors equipped with capacitive pi-filters to maintain enclosure wall shielding continuity.
- Internal Absorber Lining incorporates flexible polyurethane pyramidal foam or hybrid ferrite tiles covering enclosure walls to dampen internal reflections and cavity standing waves.
- Conductive Gasket Maintenance mandates periodic cleaning and surface resistance checks across door seams to prevent oxide formation and seam degradation.
Purchase specifications for modular quiet enclosures typically require shielding verification per IEEE Std 299 across twelve discrete frequencies before final site acceptance.
Metrology
Systematic validation creates documented confidence in pre-scan data. Because informal quiet zones lack the geometric rigor and free-space performance of accredited semi-anechoic chambers, reliable risk assessment depends heavily on careful calibration, transducer checks, and uncertainty modeling.

Reference Generators and System Calibration
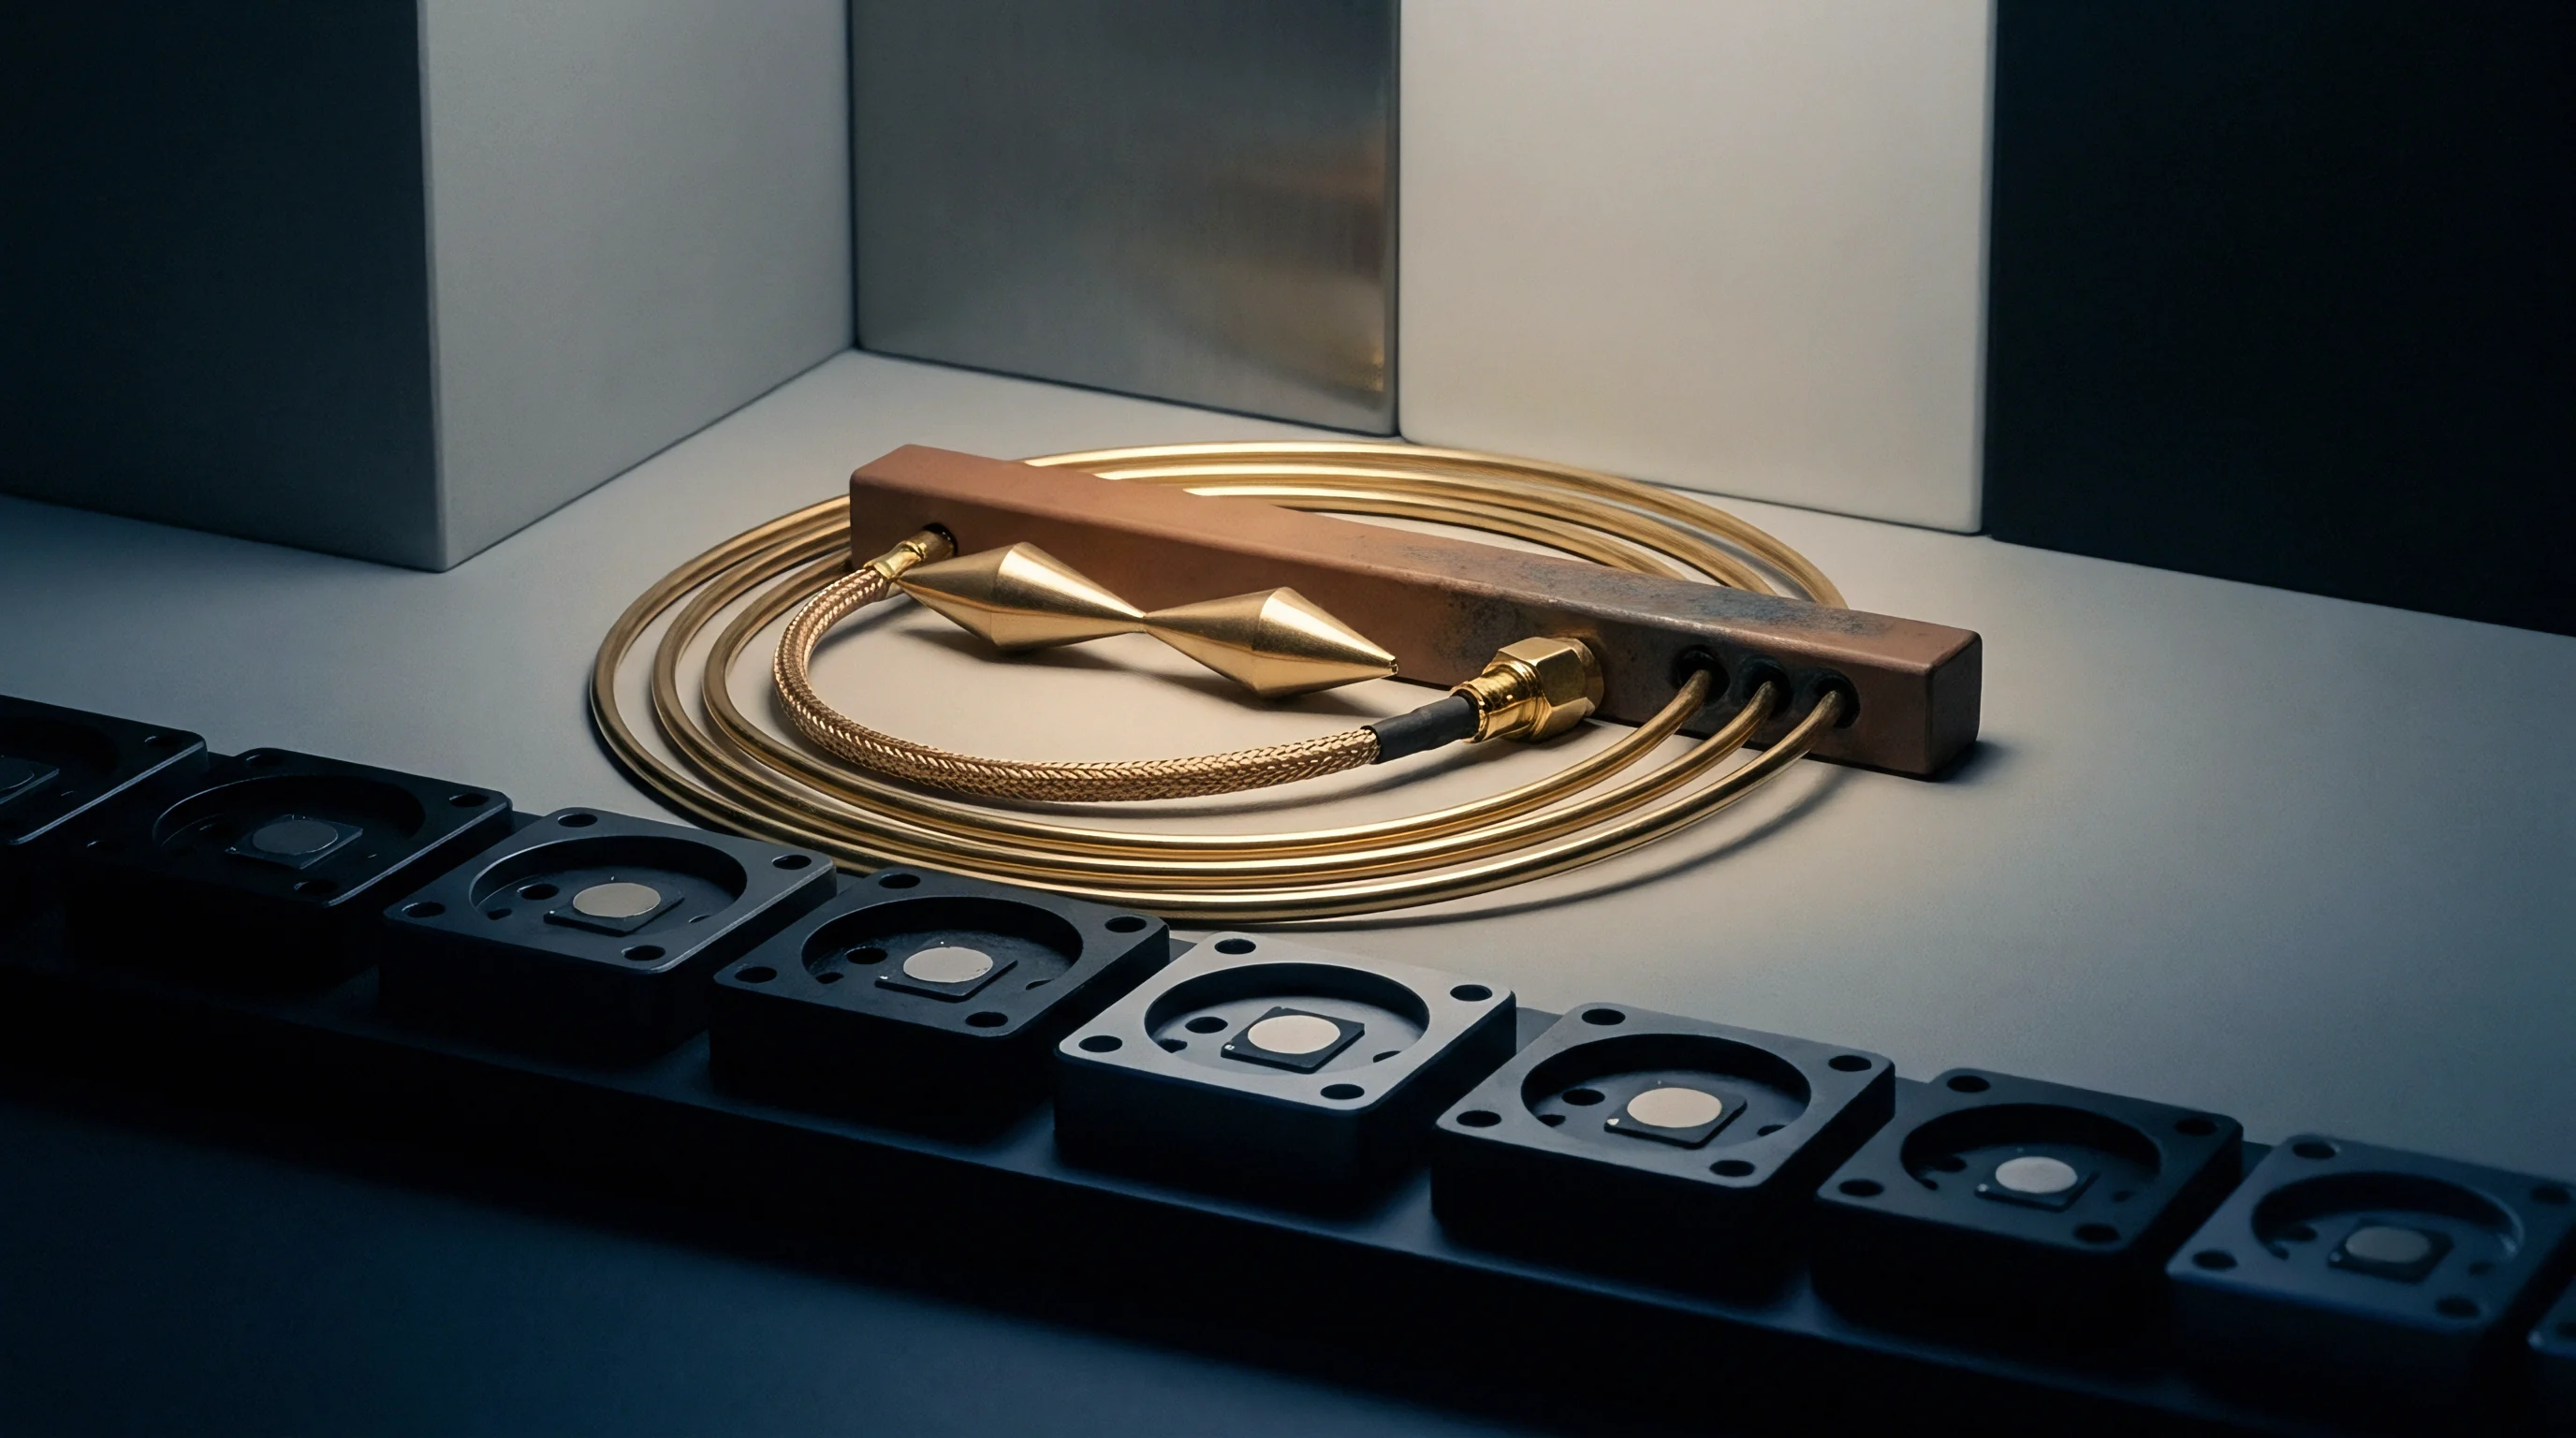
Comb generators provide stable broadband reference harmonics across the spectrum. Radiating a known harmonic pattern inside the quiet zone highlights antenna factor drift, cable wear, preamplifier gain compression, and spectrum analyzer amplitude drift.
- Position the reference comb generator at the exact geometric center of the test zone turntable.
- Orient the measurement antenna in vertical polarization at a fixed 3-meter distance.
- Execute a full frequency sweep from 30 MHz to 1 GHz using a peak detector and 120 kHz resolution bandwidth.
- Record spectral amplitude values at each 10 MHz harmonic peak across the frequency range.
- Compare measured values against calibrated baseline comb generator factory data to calculate drift.
- Repeat the sweep in horizontal antenna polarization to establish spatial symmetry factors.
Uncalibrated or sub-standard coaxial cabling can introduce massive errors: cable flexure during mast height adjustments changes impedance, while incorrect connector torque destabilizes calibration. Higher-frequency measurements using log-periodic arrays demand strict assembly tolerances to maintain repeatability.
Calculating Pre Scan Measurement Uncertainty
Uncertainty budgets for informal quiet zones must account for room reflections alongside basic instrument tolerances. While accredited chambers keep expanded measurement uncertainty under 4.0 dB per CISPR 16-4-2, unshielded or semi-shielded pre-scan setups routinely run between 7.5 dB and 11.2 dB due to ground plane reflections and ambient noise.
| Uncertainty Contributor | Probability Distribution | Standard Uncertainty (dB) | Sensitivity Coefficient |
|---|---|---|---|
| Receiver Amplitude Accuracy | Normal (k=2) | 0.50 | 1.0 |
| Antenna Factor Calibration | Normal (k=2) | 0.75 | 1.0 |
| Cable Loss Variation | Rectangular | 0.30 | 1.0 |
| Site Imperfection / Reflections | Triangular | 3.50 | 1.0 |
| Ambient Noise Interaction | U-Shaped | 1.80 | 1.0 |
| Combined Standard Uncertainty | Normal | 4.03 | 1.0 |
| Expanded Uncertainty (k=2, 95% Confidence) | Normal | 8.06 | 1.0 |
A practical calculation illustrates how this translates to internal limit lines. Take an FCC Part 15 Class B emissions limit of 40.0 dBuV/m at 3 meters (88 MHz to 216 MHz). Comparing an expanded pre-scan uncertainty of 8.06 dB against an accredited lab baseline of 4.00 dB yields a 4.06 dB delta.
Subtracting that delta plus a 3.0 dB site-imperfection margin establishes an internal pre-scan threshold of 32.94 dBuV/m; emissions above that line signal a high risk of failure in formal testing.
Without a three-axis positioning table, determining whether unmodeled ground reflections in a local pre-scan setup are masking high-frequency directional lobes remains a persistent headache for engineering teams.
Margin
Guardband margins bridge the gap between informal pre-scan checks and accredited chamber results. Building sufficient headroom into internal limits guards against surprise failures during certification, protecting schedules and budgets by accounting for measurement uncertainty, unit-to-unit production variance, and antenna positioning limits.
Guardband Allocation for Compliance Safety
A 6 dB margin below published limits is standard practice for open-area or semi-shielded pre-scanning. If elevated ambient noise or strong site reflections increase measurement uncertainty, expanding that guardband to 10 dB covers unmodeled field distortions and laboratory variance.
Component tolerances and assembly differences shift emission profiles across production runs. Variations in crystal frequencies, microcontroller edge rates, chassis screw torques, and cable harness routing can shift peak amplitudes by 2 dB to 4 dB between units, meaning internal baselines must accommodate manufacturing variability alongside bench uncertainty.
Pre-scan baselines reduce expensive chamber retests.
Financial Impact of Unverified Ambient Baseline
Accredited chamber time costs between $250 and $450 per hour, with wireless host certifications often running 16 to 24 chamber hours per filing. Failing a radiated emissions test at that stage stops evaluation, incurs lab stand-down fees, and forces redesign cycles ~ a common consequence when an unverified in-house baseline creates false confidence.
| Test Strategy Scenario | Initial Pre-Scan Setup Cost | Formal Chamber Hours Required | Retest Probability Risk | Estimated Total Cost to Grant |
|---|---|---|---|---|
| Direct Formal Testing (No Pre-Scan) | $0 | 32 hours ($12,800) | 45% | $24,500 (Inc. Retest) |
| Unverified In-House Pre-Scan Zone | $3,500 (Basic Rig) | 24 hours ($9,600) | 30% | $18,100 (Inc. Delay) |
| Calibrated Portable Quiet Zone | $12,000 (Enclosure) | 16 hours ($6,400) | 5% | $19,200 (Single Pass) |
Establishing a verified pre-scan baseline protects capital investment by ensuring products sent to accredited labs have better than a 95 percent chance of passing on the first attempt.
- Ambient Noise Contamination masks critical host emissions, letting regulatory non-compliances slip through until formal accredited chamber testing.
- Cable Harness Displacement introduces uncalibrated impedance shifts that obscure high-frequency clock harmonics during informal checks.
- Shielding Aperture Leakage allows cellular and broadcast signals into the test enclosure, triggering false failure readings.
- Inadequate Preamplifier Dynamic Range causes intermodulation distortion in measurement receivers, generating phantom spectral emission peaks.
Skipping electromagnetic baseline verification almost guarantees ambient RF noise will masquerade as product emissions, wasting costly chamber time and development budgets chasing phantom compliance failures.