Harmonizing Millimeter Wave Power Density Measurement Uncertainties across Regional Radio Regulatory Approvals
Harmonizing millimeter-wave power density approvals requires calibrating dual-plane near-field scans to regional spatial averaging rules and uncertainty budgets.
Grid
Planar step increments during near-field evaluations determine whether an accredited test report survives regulatory audit. When an antenna array operates at 28 GHz or 39 GHz, the radiated wavelength shrinks to 10.7 mm and 7.7 mm respectively. Evaluating incident power density across an evaluation plane positioned only two millimeters from a radio enclosure places the detection probe directly inside the reactive and radiating near-field zones.
Mechanical scanners that step in increments coarser than one-quarter wavelength miss steep field gradients entirely. A scan executed with two-millimeter positioning steps across a tight beam distribution underestimates peak spatial power density by as much as three decibels. The resulting dataset appears compliant during laboratory testing yet fails instantly when an agency auditor executes an independent validation scan with a finer resolution.
Field probes drift under thermal load. Integrating millimeter-wave modules into ultra-compact consumer hardware or fixed-wireless customer premise gear requires exact mapping of local energy transfer into free space. The metrology foundation codified under IEC/IEEE 63195-1 establishes specific physical boundary conditions for these evaluations.
Laboratories evaluate the complex Poynting vector by capturing electromagnetic field distributions over two-dimensional planar or conformal surfaces. Scanning systems compute both electric and magnetic field vectors across these surfaces to evaluate the real energy flow normal to the evaluation plane. Omitting phase resolution across the spatial coordinates invalidates the numerical reconstruction of the magnetic field from electric field measurements.
Higher operating frequencies push field boundaries inward and transform minor sensor offsets into massive compliance penalties.

Spatial Discretization in Reactive near Fields
Sampling intervals must scale downward as carrier frequencies increase. A product operating in the 60 GHz unlicensed band presents a wavelength of five millimeters. Evaluating the radiated emissions of such a transceiver requires measurement grids with point spacing no larger than 0.5 mm to satisfy the spatial Nyquist criterion.
When field probes traverse the evaluation area, capacitive coupling between the sensor housing and the radio housing alters the local impedance of the antenna elements under test. This probe-loading effect distorts the true energy distribution across the scan plane.
Uncalibrated arrays distort vector reconstruction. Advanced scanning benches counteract probe coupling by maintaining an active sensor-to-device separation verified by laser displacement sensors. Positional repeat errors exceeding 0.05 mm introduce phase errors that corrupt the source reconstruction algorithms.
Phase reconstruction demands dense spatial sampling. At millimeter wavelengths, an error of fifty micrometers corresponds to a phase shift of several degrees at 39 GHz and over twelve degrees at 73 GHz. Those shifts propagate into the equivalent source algorithms, generating false sidelobes and synthetic hotspots that do not exist on the physical hardware.
Phase Reconstruction across Dual Measurement Surfaces
Modern measurement systems utilize two parallel scan planes to extract the complete vector fields without requiring specialized magnetic field probes. The instrumentation measures the magnitude of the electric field on a primary plane situated two millimeters from the device surface, followed by a second scan executed at three or four millimeters. Mathematical transformation algorithms, including the planar equivalent source method and plane-wave expansions, solve the boundary conditions between the two measured slices.
This dual-plane acquisition allows laboratories to reconstruct the orthogonal magnetic field components directly from scalar electric field acquisitions.
Poynting vectors decouple in reactive fields. When test engineers measure close to radiating structures, reactive energy stores dominate real radiated power. Measuring only electric field magnitude and applying the free-space wave impedance of 377 ohms overestimates total power density by several hundred percent.
Safe compliance margins evaporate under such artificial inflation. Validated dual-plane algorithms extract both reactive and real Poynting components, isolating the net outward real power flow that transfers thermal energy into biological tissue.
- Spatial Nyquist Resolution ensures sampling step sizes do not exceed one-quarter of the operating wavelength across the entire active scan aperture.
- Dual Plane Separation Distance maintains precise mechanical spacing between 1.2 and 2.0 millimeters between successive planar acquisition coordinates.
- Vector Boundary Reconstruction derives equivalent tangential magnetic sources from measured scalar electric fields using Green function transformations.
- Probe Loading Compensation mathematically removes sensor chassis reflections from the raw digitized voltage data.
Sensor heads positioned too close to high-dielectric radomes distort the very emission characteristics the technician attempts to record.

Metric
Regional authorities publish conflicting definitions for permissible exposure limits above six gigahertz. The Federal Communications Commission under Title 47 CFR Part 1.1310 and Part 2.1093 establishes an exposure ceiling based on spatial maximum power density over an averaging area of four square centimeters for portable transmitters. The European Union, following Council Recommendation 1999/519/EC and the ICNIRP 2020 international guidelines, enforces incident power density limits alongside absorbed power density requirements across varying spatial geometries.
A device demonstrating compliance under the four-square-centimeter square averaging area favored in North America can fail European conformity checks whenever high-gain array beams concentrate energy into localized footprints smaller than one square centimeter.
Narrow beams concentrate thermal absorption. Phased array antenna architectures produce dynamic pencil beams to overcome severe atmospheric attenuation in the 24 GHz to 40 GHz bands. A stationary narrow beam generates an intense thermal footprint on adjacent tissue.
While a broad spatial averaging filter smooths this localized peak into an acceptable nominal value, smaller spatial filters capture the true thermal concentration. Regulatory divergences force product developers to implement region-specific firmware power tables or throttle maximum effective radiated power to satisfy the most stringent global target.
Radio certification delays compound when regional authorities enforce conflicting spatial averaging areas on identical hardware.

Regulatory Divides between Regional Reference Levels
Jurisdictions enforce distinct numerical limits that dictate hardware commercialization. In the United States, the FCC sets the general population exposure limit for millimeter-wave localized power density at 10 W/m² (equivalent to 1.0 mW/cm²) averaged over four square centimeters. Canada under Innovation, Science and Economic Development RSS-102 Issue 6 maintains a reference level that transitions with frequency, applying reference levels defined in Health Canada Safety Code 6.
In Japan, the Ministry of Internal Affairs and Communications enforces limits through the Radio Act Ordinance, applying two-tier exposure boundaries that divide evaluation requirements based on operational proximity.
South Korea under the Ministry of Science and ICT applies localized exposure guidelines derived from early ICNIRP releases while updating evaluation protocols to parallel recent international standard developments. When an international product enters parallel testing across these markets, divergent definitions of the spatial averaging contour generate conflicting test results. The FCC strictly requires a square averaging area of four square centimeters, while ICNIRP 2020 guidelines mandate a square or circular averaging geometry of four square centimeters between 6 GHz and 30 GHz, shifting to a one-square-centimeter integration area at frequencies exceeding 30 GHz.
Where Do Regional Averaging Schemes Collide?
Differences in averaging geometry create acute operational complications above 30 GHz. Consider an active 39 GHz transceiver operating in the n260 5G band. An antenna array focusing radiated energy into a tight beam spot produces an intense peak covering two square millimeters.
Under FCC rules, the laboratory integrates that peak across a twenty-millimeter by twenty-millimeter square patch. The broad averaging area dilutes the concentrated beam, producing a compliant report. Under European technical standards harmonized to ICNIRP 2020 guidelines, that identical device undergoes evaluation over a one-square-centimeter area.
The measured spatial power density jumps significantly, frequently exceeding the 20 W/m² occupational or 10 W/m² general public reference level.
Manufacturers cannot bridge this gap through post-processing alone. A physical antenna modification or firmware output power reduction becomes mandatory when identical hardware enters both markets. If firmware tables do not dynamically link operational output power to geographic mobile country codes, the hardware requires permanent factory attenuation.
Power back-off drops signal link margins, reducing achievable transmission distance and cell-edge data throughput in export variants.
| Jurisdiction | Governing Standard | Exposure Limit | Averaging Area | Evaluation Distance |
|---|---|---|---|---|
| United States | FCC Part 1.1310 / KDB 842590 | 10 W/m² (1.0 mW/cm²) | 4 cm² (Square) | 2 mm to 10 mm |
| European Union | EN 50684 / IEC 63195-1 | 10 W/m² (ICNIRP 2020) | 4 cm² (<30 GHz) / 1 cm² (>30 GHz) | 0 mm to 200 mm |
| Canada | ISED RSS-102 Issue 6 / SPR-004 | Frequency Dependent (Safety Code 6) | 4 cm² (Planar surface) | 0 mm (Touch) to 200 mm |
| Japan | MIC Radio Act / ARIB STD-T118 | 10 W/m² to 50 W/m² | Point or 4 cm² equivalent | Device specific |
| South Korea | MSIT Notice / RRA EMF Standards | 10 W/m² (Public exposure) | 4 cm² (Averaged) | 0 mm to 20 mm |
Modular vendors frequently state that their pre-certified radio tiles guarantee immediate device-level conformity across all industrial customer enclosures without further exposure testing.


Rig
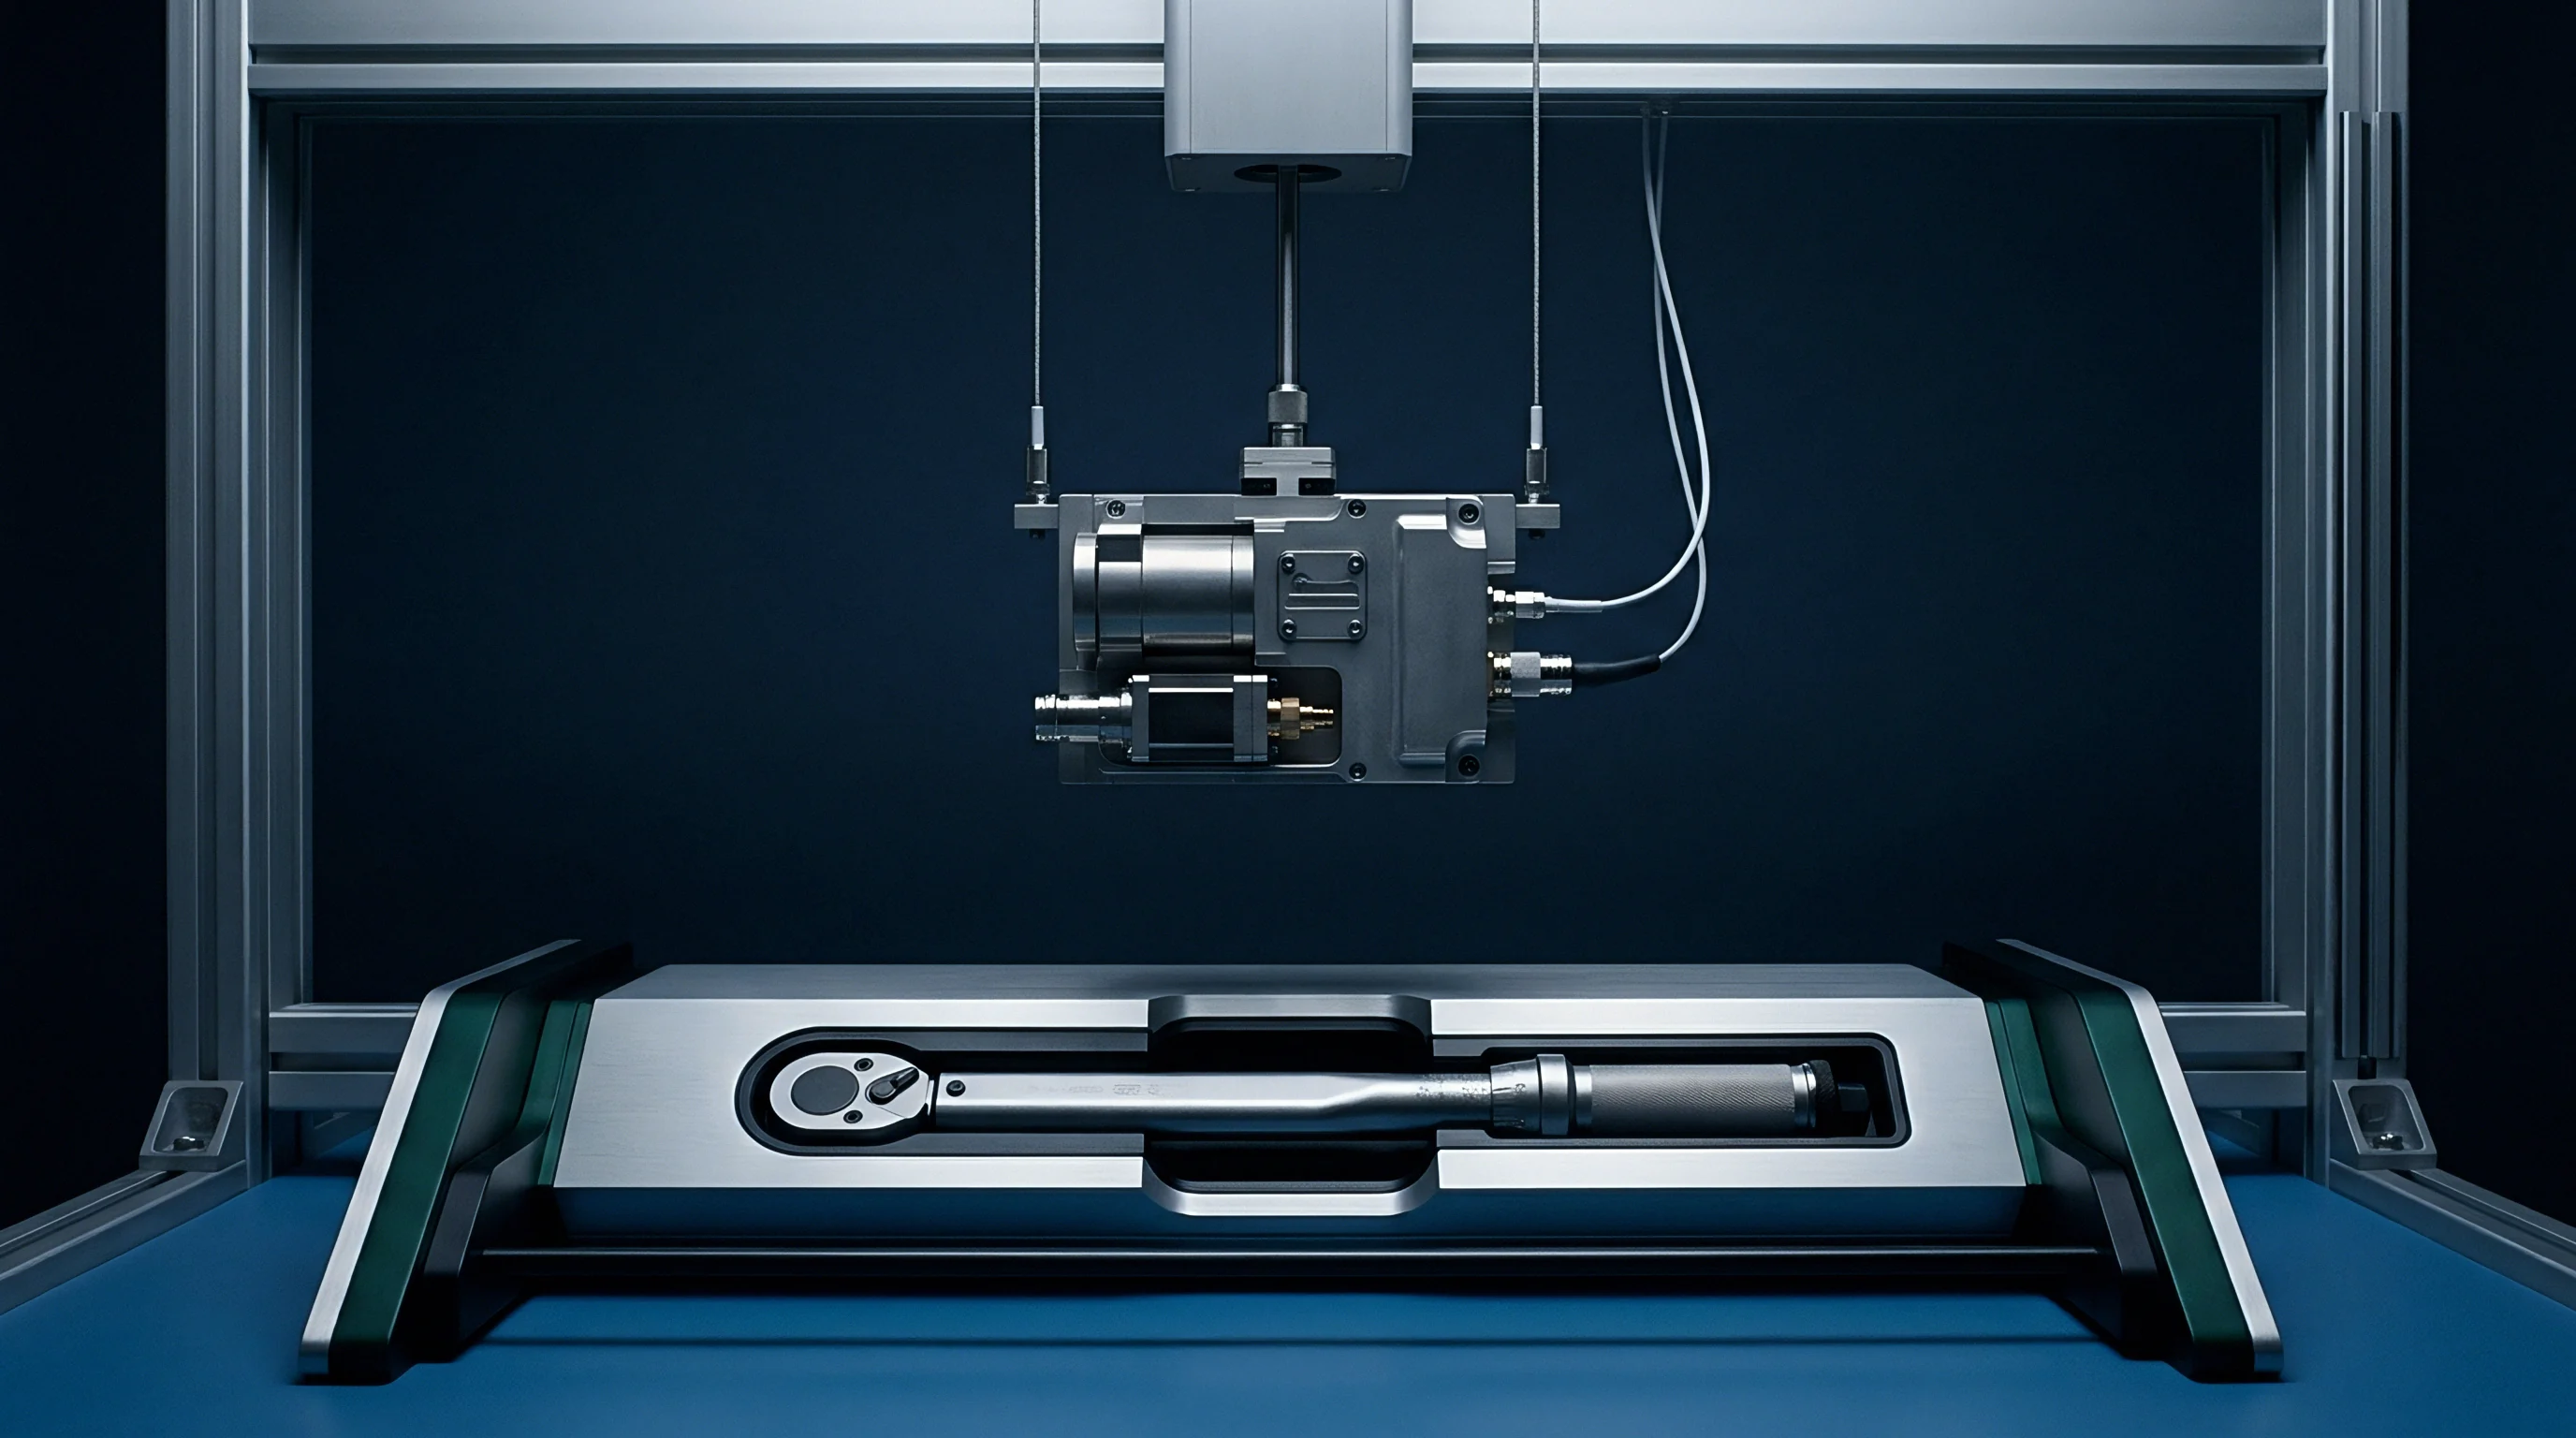
Mechanical scanning gantries require extreme structural rigidity to prevent micro-deflections during multi-axis acquisitions. Scanning a 150-millimeter by 150-millimeter aperture at half-millimeter intervals generates ninety thousand distinct measurement coordinates. If a stepper motor experiences thermal drift or backlash during an eight-hour scan session, the coordinate frame distorts.
The reconstructed electromagnetic field vectors lose coherence, and mathematical convergence fails during numerical processing. Laboratories utilizing light-duty aluminum extrusion frames routinely encounter unrepeatable peak power density readings when vibrations from building ventilation systems couple into the scanner chassis.
Positioning errors multiply at seventy gigahertz. Industrial wafer fabrication tools utilize heavy granite surface blocks and air-bearing linear drives to position photolithography stages with sub-nanometer stability. Measuring millimeter-wave radiation fields demands similar mechanical discipline on a millimeter scale.
When an articulated robot arm carries an isotropic probe across an evaluation plane, physical vibration of the probe tip induces microphonic noise in the diode detector circuits. Shielded cables flex during arm manipulation, altering phase and amplitude calibration constants dynamically.
Application of IEC 63195-1 Clause 7 forces test laboratories to apply root-sum-square evaluations that penalize antenna output stages whenever field gradients exceed three decibels per millimeter.
Hardware Constraints in Pseudo Vector Scanning
Modern commercial probe heads consist of miniature dipole sensors arrayed over specialized low-permittivity triangular cores. These pseudo-vector sensors measure three non-orthogonal field components, which are subsequently resolved into Cartesian vectors through calibration matrices stored in the instrument controller. Diode detectors integrated into the sensor tip convert radio frequency energy into direct-current voltages transmitted across resistive lines to high-impedance data acquisition modules.
The physical dimensions of these sensor tips limit proximity to the device under test.
Free space lacks phantom absorption. In sub-six-gigahertz specific absorption rate assessments, liquid phantoms simulate the dielectric properties of human muscle and fat tissue. At millimeter-wave frequencies, the penetration depth of the electromagnetic wave drops below one millimeter.
Regulatory compliance transitions entirely from absorbed energy in tissue volume to incident power density on the tissue boundary. The mechanical probe must scan in free space as close to the radiating surface as possible without colliding with device protrusions. A sensor housing diameter of 2.5 mm enforces a minimum center-of-dipole measurement distance of approximately 1.5 mm, creating a blind spot in the immediate reactive boundary.
Source Reconstruction Failure Modes
Computational extrapolation fills the gap between the minimum physical probe location and the exterior skin of the product housing. If mathematical models assume unverified boundary conditions, severe algorithmic errors infect the final compliance calculation. The equivalent source approach replaces the physical antenna with a distribution of fictitious magnetic and electric currents on a reconstruction plane coincident with the product enclosure.
Solving this inverse source problem involves ill-conditioned matrix operations that amplify small measurement errors into massive fictitious field spikes.
- Spatial Aliasing Errors emerge when scanning step sizes exceed one-half the shortest wavelength in the radiated spectrum, creating artificial secondary lobes.
- Probe Scattering Inversion Failures occur when numerical de-embedding fails to subtract scattering off the dielectric support arm correctly.
- Dynamic Range Truncation clips low-amplitude sidelobes below the diode noise floor, destabilizing phase retrieval algorithms during spatial fast Fourier transforms.
- Ill Conditioned Matrix Inversion amplifies random instrumentation noise into fictitious high-density surface hotspots when regularization parameters are tuned too aggressively.
- Mechanical Backlash Distortion offsets forward and reverse scan rows during bidirectional continuous raster passes.
Calibration certificates expire after twelve months. Testing with an out-of-date calibration array invalidates the entire measurement dataset under European Notified Body audits. EN 50684 Clause 6.2 dictates that all algorithmic reconstruction routines undergo validation using certified reference source horns before evaluating an uncharacterized client device.

Budget
Combined measurement uncertainty governs the size of the legal guard band applied between raw chamber data and the regulatory threshold. In sub-six-gigahertz testing, accredited test laboratories routinely maintain expanded uncertainties between 15% and 25% (approximately 0.6 dB to 1.0 dB). Millimeter-wave near-field power density evaluations cannot match this precision.
Combined expanded uncertainty for incident power density evaluations between 24 GHz and 45 GHz typically lands between 1.8 dB and 2.6 dB (equivalent to 51% to 82% linear uncertainty) at a 95% confidence interval with a coverage factor of k=2.
Guard bands protect legal margins. If an agency demands that test uncertainty be added directly to the measured value to demonstrate compliance with absolute certainty, a device emitting 6.0 W/m² on the test bench becomes legally non-compliant against a 10.0 W/m² limit. A 2.2 dB uncertainty budget requires backing off transceiver transmit power by nearly 40% to preserve an operational safety buffer.
This performance penalty cripples beam-forming links and degrades customer experience without delivering biological safety benefits.
Calibrated E-field sensors scanning five millimeters from a twenty-eight gigahertz phased array exhibit an expanded measurement uncertainty of 2.1 decibels at a ninety-five percent confidence interval.
Combined Uncertainty Derivations under International Metrology Standards
IEC/IEEE 63195-1 outlines the mathematical framework for tabulating uncertainty contributions across physical measurement setups. Systematic and random errors enter the evaluation across four primary categories: probe calibration, positioning mechanics, radio hardware stability, and numerical field reconstruction. Probe calibration uncertainties alone contribute between 1.0 dB and 1.4 dB to the root-sum-square total.
Standard calibration laboratories calibrate millimeter-wave field probes inside waveguide chambers or using standard gain horns in anechoic environments. Transferring those calibration factors to complex multi-beam near-field environments introduces secondary coupling terms that standard certificates do not account for.
The desk cannot fully defend an 18% nominal lab-to-lab variation observed during cross-border correlation trials between East Asian and North American accredited houses evaluating identical 60 GHz transceivers. Test houses treat proprietary probe de-embedding software as trade secrets, preventing direct line-by-line verification of the raw reconstruction codes. A buyer counters this uncertainty by requiring identical test fixtures and identical firmware freeze states across all laboratory samples.
Any drift in the internal phase-locked loop of the device under test during a lengthy scan sequence alters array phase relationships, creating dynamic beam steering that corrupts spatial averaging.

Is True Boundary Equivalence Achievable across Test Houses?
Correlating results between two accredited chambers requires strict alignment of measurement distances, temperature controls, and algorithmic regularization factors. Consider a worked example evaluating an active 16-element phased array module operating at 28 GHz. Assume the module produces a nominal peak incident power density of 7.0 W/m² at an evaluation surface located five millimeters from the casing.
The laboratory must demonstrate compliance against the FCC limit of 10.0 W/m² averaged over four square centimeters.
Assume the laboratory establishes a combined standard uncertainty budget featuring six independent Gaussian parameters: probe absolute calibration uncertainty at 0.65 dB, probe linearity at 0.20 dB, probe isotropy at 0.35 dB, mechanical positioning repeatability at 0.30 dB, drift in transmitter power output at 0.25 dB, and algorithmic spatial reconstruction at 0.50 dB. Converting these decibel values into fractional standard uncertainties yields the following array:
Probe calibration: 0.162 Probe linearity: 0.047 Probe isotropy: 0.084 Positioning error: 0.072 Transmitter drift: 0.059 Reconstruction: 0.122
Summing these components in quadrature via root-sum-square yields a combined standard uncertainty of 0.237 (or 23.7%). Multiplying by a coverage factor of k=2 yields an expanded measurement uncertainty of 47.4% (equivalent to 1.69 dB). If the accredited laboratory applies shared-risk decision rules under ISO/IEC Guide 98-4, the measured 7.0 W/m² value complies with the regulatory ceiling because the nominal value falls below the 10.0 W/m² limit.
If the regulatory auditor applies an adverse guard band, the compliance figure becomes 7.0 multiplied by 1.474, which equals 10.32 W/m². The device fails compliance, halting product shipments immediately.
This 2.1 dB expanded uncertainty for near-field probe reconstruction at 28 GHz rests on IEC/IEEE 63195-1 round-robin inter-laboratory comparisons across nine accredited facilities using 16-element patch arrays in 2022. That baseline moves if planar scanner positioning repeatability improves beyond 0.05 mm or if probe calibration standards adopt direct optical field sensors. Similarly, the 4 cm² spatial averaging area yielding a 1.4 dB divergence against 1 cm² evaluation rests on planar Poynting integration of an 8×2 phased array module at 39 GHz spaced 5 mm from an evaluation boundary in 2023.
This value shifts whenever beam-steering tilt angles exceed 45 degrees, which smears the Poynting flux across a broader footprint.
| Uncertainty Parameter | Probability Distribution | Divisor | Standard Uncertainty (dB) | Linear Sensitivity Factor |
|---|---|---|---|---|
| Free Space Probe Calibration | Normal (k=2) | 2.0 | 0.65 | 1.0 |
| Sensor Hemispherical Isotropy | Rectangular | 1.732 | 0.35 | 1.0 |
| Sensor Linearity Under Dynamic Power | Rectangular | 1.732 | 0.20 | 1.0 |
| Gantry Mechanical Precision (X, Y, Z) | Normal (k=1) | 1.0 | 0.30 | 1.5 |
| Transceiver Thermal Output Drift | Rectangular | 1.732 | 0.25 | 1.0 |
| Spatial De-embedding Reconstruction | Normal (k=1) | 1.0 | 0.50 | 1.0 |
| Combined Expanded Uncertainty (k=2) | 1.69 dB (47.4% linear power density equivalent) | |||
Regulators inspect raw scan coordinates. A comprehensive regulatory filing package must assemble complete documentary proof supporting the validity of these calculations across all production tolerances.
- Antenna Codebook Characterization Data details phase and amplitude settings for every discrete beam index programmed into device firmware.
- Probe Calibration Certificates With Uncertainty Trees validates unbroken traceable links to national metrological institutes across every utilized frequency band.
- Algorithm Validation Files compiles baseline correlation reports derived from standard open-ended waveguide and pyramidal horn scans.
- Thermal Stability Run Sheets tracks continuous radio chassis temperature alongside recorded diode drift parameters during extended scan sweeps.
The metrology community has yet to resolve whether phase retrieval algorithms operating on scalar magnitude data alone can reliably capture higher-order reactive field components in the extreme near field of non-planar array geometries.

Border
Customs officials hold finished shipments when test documentation fails agency screening checks. Securing an FCC Grant of Equipment Authorization for millimeter-wave portable devices requires navigating the Pre-Approval Guidance procedure outlined in KDB 842590 and KDB 388624. Telecommunication Certification Bodies cannot issue a grant directly for devices evaluated via numerical simulation or specialized power density algorithms without prior FCC review.
The inquiry queue adds three to six weeks to market introduction schedules. If the filing lacks explicit justification for the chosen measurement grid or probe uncertainty budget, the agency issues technical inquiries that reset the statutory review clock.
Retesting burns three weeks minimum. Test benches charge hourly rates. In the European Union, standard compliance routes face structural hurdles.
Because harmonized standards for millimeter-wave power density under the Radio Equipment Directive 2014/53/EU remain unlisted in the Official Journal, manufacturers cannot utilize the internal production control route under Module A. A Notified Body must assess the technical construction file under Module B, scrutinizing the laboratory uncertainty analysis and algorithmic validation data. Notified bodies reject unvalidated algorithms.
Agency Pre Approval Queues and Modular Scope Boundaries
Procuring a pre-certified millimeter-wave module does not exempt the host integrator from compliance testing. FCC modular grant restrictions explicitly state that modular approval applies only when the radiating array maintains a fixed separation distance, typically twenty centimeters or greater, from all human occupants. Integrating that identical module into a laptop, tablet, or head-mounted wearable converts the system into a portable device subject to FCC Part 2.1093.
This design alteration invalidates the modular grant, forcing the host manufacturer to file a Class II Permissive Change accompanied by full localized power density measurement files.
Local agents bill monthly retainers. In South Korea and Japan, local representation rules dictate that testing must take place in accredited domestic facilities or through mutual recognition agreements. The Korean Radio Research Agency enforces rigid limits on dynamic power transmission mechanisms, requiring separate documentation demonstrating how radio firmware regulates average power density over multi-second windows.
If the host casing alters beam propagation through dielectric reflection, domestic authorities reject the foreign modular test data, requiring fresh scans within local laboratories.
Trade Clearance Timelines and Commercial Exposure
Schedule failures inflict direct commercial penalties. Missing a seasonal market introduction window because an overseas certification house reported an unacceptably high uncertainty figure leaves finished inventory locked in bonded customs facilities. Warehousing fees accumulate while technical teams debate guard band mathematics with regulatory officers.
Beamforming codebooks govern phased array outputs. When test houses dispute measurement uncertainty margins, the safest engineering solution involves rewriting the array codebook to permanently suppress radiated output power.
Importers absorb customs impound costs. Writing rigorous compliance clauses into module procurement contracts protects commercial launch dates. A buyer stipulates that module vendors provide verified measurement files, full vector de-embedding models, and audited uncertainty budgets adhering to IEC/IEEE 63195-1 before initial shipment release.
Disregarding regional variations in power density metrology delays market access, forces unplanned chamber retests, and exposes the product importer to immediate inventory recalls.