Hardware Trace Profiling Protocols for Multi-Layer Interconnect Bus Arbitration Faults
Hardware trace profiling protocols isolate interconnect arbitration faults by capturing cycle-accurate bus state packets via embedded cross-trigger monitors.


Trap
When four high-bandwidth DMA engines issued concurrent burst requests across an AMBA AXI crossbar, monitoring logic caught a grant freeze on read data channel three. An incomplete write transaction had pinned the response channel open, stalling the round-robin arbitration controller’s internal state machine and quietly starving downstream traffic. Hardware trace modules tapped directly into these crossbar junctions exist precisely for this reason: catching transient lockups before bus timeouts bring down the host processor.
These monitors track master requests, slave acknowledgments, and grant vectors cycle by cycle across multi-layer fabrics. Hooking trace logic into the crossbar means placing taps on arbitration control lines, command buffers, and address decoders. Those taps feed markers into an embedded cross-trigger matrix, synchronizing triggers across independent clock domains without loading down timing-critical paths with parasitic capacitance.
A hardware trace probe positioned behind an unbuffered crossbar tap degrades path timing beyond synthesis limits.
Configurable mask and match registers filter transaction signals to isolate intermittent arbitration faults. If an illegal master-grant sequence fires, the trace hardware freezes the preceding clock cycles so the arbitration controller’s priority history can be reconstructed.
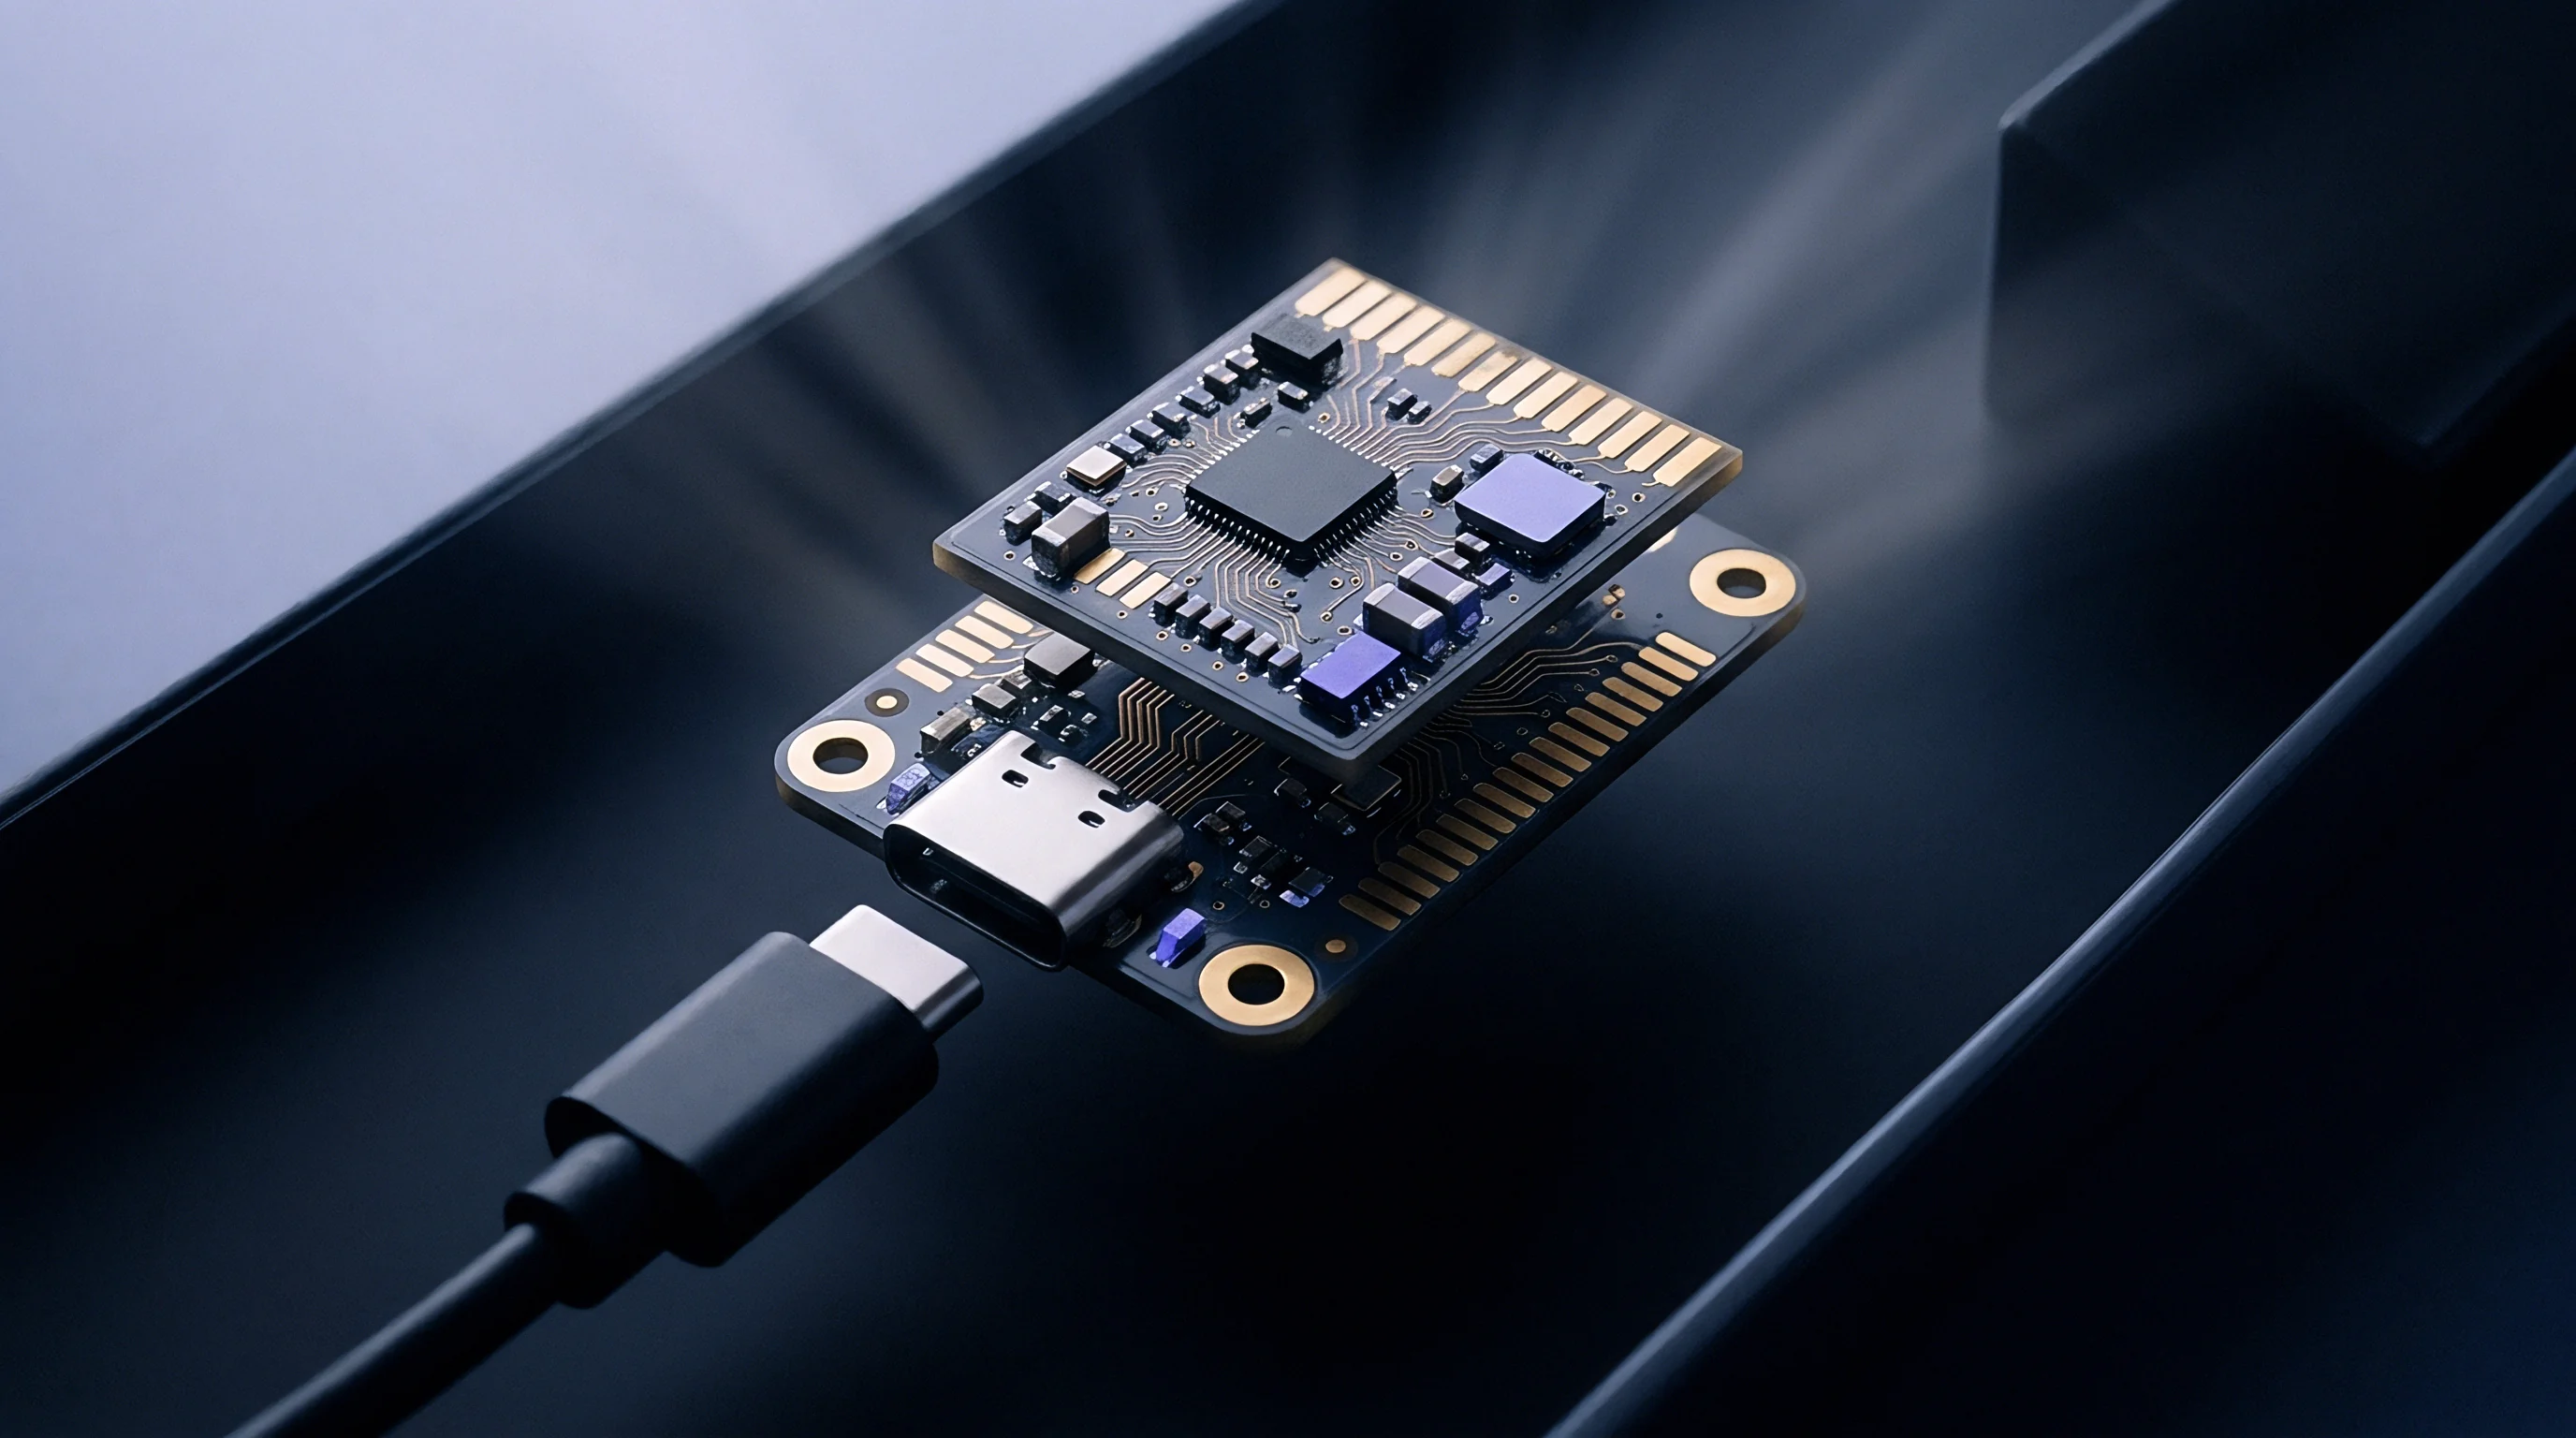
Arbitration Failure Mechanisms in Multi-Layer Crossbars
Distributing link bandwidth across heterogeneous cores requires intricate scheduling logic within the interconnect. Peak bus traffic invariably surfaces corner cases ~ subtle arbitration bugs that static timing analysis will never catch.
- Livelock Priority Cycles occur when competing masters swap priority ranks back and forth on alternating cycles, so neither transaction ever secures an active grant.
- Burst-Length Starvation happens when extended DMA write bursts tie up slave channels past their planned buffer limits, locking out real-time audio or sensor pipelines.
- Crossbar Grant Deadlocks develop through circular dependencies across multi-layer bridges, where multiple address lines remain asserted while waiting on slave ready signals that never arrive.
- Asynchronous Clock Phase Slippage causes missed grant handshakes at asynchronous bridge crossings, dropping packet frames without flagging an error.
Capturing what happened right before a lockup requires enough buffer depth behind the trace pipeline. Raw bus transitions pass through lossless compression hardware, turning raw signal toggles into compact packet streams that feed either on-chip circular buffers or dedicated export pins, giving visibility into contention leading up to the failure.
Under randomized traffic profiles, separating a temporary latency spike from a true structural deadlock is rarely straightforward.

Transit
Trace packet formats compress wide, high-speed bus activity down to serial or byte-wide streams suited for off-chip export or internal memory. Standard protocols define the framing, headers, and timestamp formats needed to link third-party trace sinks with arbitrary interconnect topologies, letting engineers tie hardware grant arbitration directly back to software execution.
The table below outlines common trace protocol standards used in multi-layer interconnect diagnostics, along with their packet overhead and supported features.
| Protocol Standard | Arbitration Packet Overhead | Cycle-Accurate Timestamping | Max Data Throughput | Sink Interfaces |
|---|---|---|---|---|
| MIPI STP v2 | 12 percent | Supported (64-bit counter) | 10 Gbps per lane | High-Speed Serial Trace Port |
| ARM CoreSight ATB | 8 percent | Supported (System correlation) | Native On-Chip Bus Width | ETB, ETF, ETR Sinks |
| Nexus IEEE 5001 | 15 percent | Supported (Variable width) | 5 Gbps per lane | Parallel, Aurora Gigabit |
| RISC-V N-Trace | 6 percent | Supported (Absolute or Delta) | Native System Interconnect | SBA, Dedicated Trace Buffer |
Hardware encoders convert physical bus toggles into discrete transaction packets, generating arbitration records whenever master request registers update or slave channels assert backpressure. Turning that raw trace data into a cycle-accurate arbitration profile follows a standard sequence:
- Set the encoder mask registers to filter out unrelated peripheral traffic and isolate the target master request vectors and grant lines.
- Arm the on-chip circular buffers to log interconnect state transitions continuously.
- Tie monitor trigger outputs into the cross-trigger matrix so any detected fault initiates high-resolution capture.
- Pull the compressed packet stream off the chip via external debug hardware or software trace collectors.
- Decompress the trace frames through protocol parsers, aligning timestamps with master priority counters.
- Calculate cycle differentials between request assertions and grant acknowledgments to map out actual bus latency curves.
Cycle-accurate timestamps burn considerable bandwidth. Most architectures compensate by packing fine-grained delta values into the main stream, reserving full 64-bit reference timestamps for periodic synchronization frames or unrecoverable bus faults.
Bandwidth demands on the trace network climb steeply with each additional interconnect layer.

Verification
Diagnosing arbitration failures usually requires marrying post-silicon trace captures back to formal simulation. Rebuilding a deadlock scenario means correlating asynchronous trace streams collected across several clock domains, which depends heavily on the cross-trigger matrix to align capture windows across disparate processing clusters and bridges.

Can Cross-Trigger Protocols Isolate Interconnect Deadlocks?
Cross-trigger networks give trace blocks a way to broadcast halt signals across the entire chip the moment an arbitration fault occurs. If a monitor catches a transaction exceeding its starvation threshold, it signals the cross-trigger matrix, freezing core execution counters and locking trace buffer memory simultaneously. Freezing the system instantly preserves the exact crossbar register states that caused the lockup.
Trace analysis tools parse the dumped buffer data into transaction timelines. Plotting master priority shifts alongside actual grant events makes it possible to single out whichever engine violated bus scheduling rules.
Compliance with IEEE 1149.7 system debug standards mandates that internal trace cross-trigger networks must not share silicon signal paths with monitored functional interconnect channels.
Isolating subtle faults requires trace logic that can filter on combinations of live transaction states. During bring-up and simulation, synthetic master drivers inject pathological congestion patterns to stress arbitration state transitions, while trace profiling records latency distributions to expose hidden flaws before tape-out.
Under-provisioning trace buffer depth before tape-out leaves bring-up teams blind whenever intermittent stalls take several thousand cycles to manifest.
Paperwork
Handing custom trace IP over to a foundry or integration partner demands rigorous documentation. The transfer package has to spell out macro boundaries, clock domain crossing constraints, and testbench coverage metrics in detail, establishing boundaries that prevent integration mistakes and clarify responsibility on both sides.
A complete handoff package contains synthesis scripts, testbenches, and functional specs complete enough to support dual-sourcing or turnkey fabrication without back-and-forth clarification.
- Synthesizable RTL Source Files provide fully commented SystemVerilog covering the probes, bus monitors, packet encoders, and cross-trigger routing logic.
- Static Timing Constraint Files define setup and hold limits for trace taps to ensure they do not pull down crossbar operating speeds.
- UVM Testbench Suites supply automated test environments that verify packet encoding against protocol specifications under edge-case conditions.
- Trace Receiver Driver Libraries include C APIs for decoding raw trace packet streams inside host diagnostic utilities.
- Pin Allocation Specifications set physical trace port assignments, signaling levels, and PCB breakout layout rules.
Ownership terms dictate whether internal probe and monitor logic can be modified down the line. Licensing contracts distinguish between single-project tape-outs and broader derivative rights, heading off disputes over reused debug blocks.
Standard procurement contracts place full financial liability for mask respins on the integrator if unverified changes to the debug IP cause silicon failures.
Tariff
Adding on-chip trace profiling comes down to trading silicon area against post-silicon bring-up schedules. Encoders, taps, and dedicated SRAM buffers increase die size and drive up unit costs, but deep trace visibility cuts weeks off hardware bring-up and lowers the risk of field recalls.
The table below outlines typical area penalties and engineering overhead for different trace tiers implemented in a 7nm multi-layer interconnect fabric.
| Trace Implementation Scope | Added Gate Count | Silicon Area Overhead at 7nm | Added NRE Cost | Debug Cycle Reduction |
|---|---|---|---|---|
| Basic Tap Probes | 45,000 gates | 0.08 square mm | $35,000 USD | 15 percent |
| Standard Crossbar Monitoring | 180,000 gates | 0.28 square mm | $110,000 USD | 40 percent |
| Full Protocol Multi-Core Trace | 520,000 gates | 0.82 square mm | $280,000 USD | 70 percent |
| Custom Deep Packet Inspection | 1,150,000 gates | 1.75 square mm | $490,000 USD | 85 percent |
Cost estimates for trace IP have to account for licensing, UVM testbench development, and layout sign-off. Quoted NRE figures from third-party IP vendors frequently leave out the internal engineering time required to wire cross-trigger controls into host software tools.
Integrating complete multi-layer trace profiling blocks adds $280,000 USD in upfront engineering fees while reducing silicon debug timetables by four months.
Planned production volume largely dictates how much trace logic makes the cut. Low-volume, high-margin parts readily sacrifice die area for visibility to de-risk delivery schedules, while high-volume consumer silicon trims trace down to minimal tap points to protect unit margins.
- Trace IP License Fees cover upfront licensing for encoder cores, cross-trigger blocks, and dedicated trace sinks.
- Verification Headcount Hours track engineering time spent closing UVM functional coverage under fault injection scenarios.
- Silicon Area Amortization accounts for the per-die cost increase resulting from trace macro area across wafer production runs.
- Physical Layout Iterations include extra place-and-route passes needed to close timing across distributed trace taps.
Embedded diagnostic trace logic is often treated as timing-neutral, yet unbuffered trace taps regularly force dedicated buffer insertion cycles during late-stage synthesis.