Metrological Uncertainty Budgets and Guardbanding Rules for Production Lot Verification
Guardbanding converts metrological measurement uncertainty into tightened acceptance limits to prevent defective production lots from reaching field deployment.


Variance
Measurement results on an automated production test bench deviate from true values due to continuous physical perturbations. Quantifying these departures demands structured uncertainty evaluation according to established metrological protocols such as ISO/IEC Guide 98-3. Type A evaluation calculates statistical dispersion from repeated measurements under repeatability conditions.
Type B evaluation relies on non-statistical information including instrument calibration certificates, manufacturer datasheets, sensor drift specifications, and ambient laboratory observations. Combining these two distinct evaluation paths constructs the standard uncertainty budget for production lot screening.

Evaluation of Type a and Type B Uncertainties
Repeated test runs on identical hardware yield sample variance that defines Type A uncertainty. Calculating the arithmetic mean and sample standard deviation across ten or twenty sequential DUT readings isolates random instrument noise from device instability. Data drives the decision.
Type B evaluation addresses systematic error distributions where empirical statistical sampling is impractical during high-throughput testing. Instrument calibration reports supply standard uncertainties derived from expanded uncertainty values divided by the stated coverage factor. When manufacturer documentation provides upper and lower tolerance limits without specifying a confidence interval, metrologists assume a rectangular probability distribution and divide the semi-range by the square root of three.
Gaussian distributions apply when historical calibration records show stable, normally distributed instrument drift over multiple recalibration cycles.
- Random Statistical Noise takes the form of thermal fluctuations and electromagnetic interference captured across repeated trial cycles.
- Reference Instrument Drift originates from aging voltage standards, resistor networks, and counter crystals between factory calibration intervals.
- Environmentally Induced Offsets arise from ambient factory floor temperature swings, humidity changes, and localized air currents near test stations.
- Resolution Limitations stem from digitizer analog-to-digital converter quantization steps and meter display rounding limits.

Combined Uncertainty Derivations and Expanded Bands
Individual uncertainty components convert into standard uncertainties expressed in the unit of the measurand before summation. Partial derivatives of the functional measurement model form sensitivity coefficients that weigh each component according to its functional impact on the final output value. Uncorrelated components sum under quadrature, where the combined standard uncertainty equals the square root of the sum of squared weighted standard uncertainties.
A combined standard uncertainty of 1.2 millivolts expands to a 2.35 millivolt guardband at a 95 percent confidence interval when degrees of freedom exceed thirty.
Multiplying combined standard uncertainty by coverage factor k yields expanded uncertainty U. A coverage factor of k=2 establishes approximately a 95.45 percent coverage probability under an assumed normal distribution. When Type B components with finite degrees of freedom or dominant single-source non-Gaussian distributions contribute significantly to total variance, calculate the effective degrees of freedom using the Welch-Satterthwaite equation. This equation scales coverage factor k to maintain standard confidence coverage.
Noise corrupts the signal.
Miscalculating the combined standard error leaves testing facilities blind to latent defect rate spikes, forcing unbudgeted warranty recalls once products land in field deployments.


Probe
Automated test equipment relies on mechanical and electrical interfaces that introduce immediate physical errors into measurement circuits. Pogo pin contact interfaces accumulate oxidation and solder flux contaminants, altering series resistance dynamically over thousands of actuation cycles. Cable harnesses experience dielectric absorption, high-frequency signal attenuation, and phase shifts when micro-coaxial lines flex during high-volume robotic socketing.

Physical Sources of Measurement Error on Factory Jigs
Contact resistance on test sockets fluctuates between 20 milliohms when clean and over 500 milliohms when contaminated. This parasitic resistance alters voltage drop measurements across current-sense shunts and skews low-resistance continuity checks. Fixtures degrade with wear.
Thermal electromotive force develops at junctions between dissimilar metals, creating microvolt-level DC offsets when high-power DUTs heat local fixture pins relative to cold bench reference junctions.
Compliance with ISO 14253-1 reduces the specification bandwidth by exactly the expanded measurement uncertainty when no explicit decision rule is negotiated in the supply contract.
High-frequency RF testing adds complex parasitic loading to the metrology budget. Uncompensated trace capacitance and lead inductance on interface boards alter return loss and distort harmonic power readings. Automated test software must apply de-embedding matrix corrections to shift the measurement reference plane directly to the pins of the module under test.

Calibration Cycles and Systematic Drift Control
Systematic drift in bench instrumentation alters measurement bias between routine calibration dates. Establishing zero-drift baseline performance demands structured daily or shift-level verification procedures on factory floors. Calibration records reveal drift.
- Clean contact points on test socket pins using dry isopropyl alcohol swipes to remove accumulated solder flux residues.
- Measure open-circuit and short-circuit impedance vectors using a calibrated LCR meter across the operating frequency band.
- Record baseline path resistance for each signal trace and calculate the mean parasitic offset across fifty insertion cycles.
- Subtract baseline parasitics from raw automated test software readings prior to lot evaluation.
Manufacturing vendors frequently claim that probe pin wear and thermal equilibrium shifts fall within ordinary bench noise tolerances and refuse to re-screen batches without additional engineering fees.


Guardband
Production screening applies decision thresholds inside stated specification limits to compensate for expanded measurement uncertainty. Pure specification boundaries accept bad units whenever measurement error skews a defective device reading back into the passing zone. Guardbanding establishes an acceptance boundary shifted inward from the lower and upper specification limits by a distance derived directly from expanded measurement uncertainty U.

Mathematical Formulation of Guardband Limits
Defining guardband factor w determines the stringency of production lot screening. Setting w equal to zero implements simple acceptance, where acceptance limits equal specification limits. Setting w equal to 1.0 shifts the acceptance limit inward by 100 percent of expanded uncertainty U, effectively eliminating consumer risk at the expense of increased producer risk.
Standard guardbanding formulas set lower acceptance limit LAL equal to lower specification limit LSL plus w times U, while upper acceptance limit UAL equals upper specification limit USL minus w times U.
Consider a practical lot verification scenario for an RF power module with a target output power specification of 30.0 dBm plus or minus 0.5 dBm (LSL = 29.5 dBm, USL = 30.5 dBm). Production test bench calibration establishes an expanded measurement uncertainty U of 0.15 dBm at k=2 (coverage probability 95.45 percent). Application of a 100 percent guardband rule (w = 1.0) calculates new operational acceptance thresholds: lower acceptance limit becomes 29.65 dBm (29.5 + 0.15) and upper acceptance limit becomes 30.35 dBm (30.5 – 0.15).
Devices measuring 29.55 dBm pass simple acceptance but fail under guardbanded rules. This inward shift of 0.30 dBm reduces total usable specification bandwidth from 1.0 dBm to 0.70 dBm, representing a 30 percent contraction in operational manufacturing yield space.
Tighter test uncertainty ratios reduce false rejection costs far faster than increasing lot sample sizes.
Evaluating test uncertainty ratio (TUR) determines whether complex probability-based guardband multipliers become necessary. TUR expresses the ratio of product tolerance span to expanded measurement uncertainty U. When TUR exceeds 4:1, simple acceptance yields acceptable risk levels for non-critical commercial hardware. TUR levels below 4:1 mandate explicit guardbanding to maintain consumer risk limits below acceptable bounds.
| Test Uncertainty Ratio | Expanded Uncertainty (k=2) | Guardband Multiplier | Usable Specification Bandwidth | Probability of False Accept |
|---|---|---|---|---|
| 10:1 | 1.0% | 0.0 x U | 100.0% | 0.1% |
| 4:1 | 2.5% | 0.5 x U | 97.5% | 0.8% |
| 3:1 | 3.3% | 1.0 x U | 93.4% | 1.9% |
| 2:1 | 5.0% | 1.0 x U | 90.0% | 4.2% |

Probability of False Accept and False Reject Trade-Offs
Guardband selection balances consumer risk against producer risk. Consumer risk defines the probability of accepting a lot containing non-conforming items, known as Probability of False Accept (PFA). Producer risk defines the probability of rejecting a lot comprised entirely of conforming units, known as Probability of False Reject (PFR).
Shift decision boundaries inward to decrease PFA while sharply increasing PFR. Unnecessary scrap results. Guardband factors alter risk.
- Test Uncertainty Ratio Exceeding Four To One allows simple acceptance rules where specification limits match factory decision thresholds directly.
- Test Uncertainty Ratio Below Four To One demands formal guardband offsets equal to expanded uncertainty to cap consumer risk below two percent.
- High Unit Scrap Value justifies investing in lower-uncertainty reference instrumentation to recover guardbanded specification bandwidth.
- Asymmetric Defect Consequences dictates shifting decision boundaries inward on critical performance parameters while relaxing non-critical bounds.
Section 5.2 of ANSI/NCSL Z540.3 assigns all measurement uncertainty to the supplier unless the procurement agreement explicitly stipulates a shared risk decision boundary.


Sampling
Statistical lot sampling evaluates production batches without testing 100 percent of manufactured units. Standard acceptance sampling frameworks like ISO 2859-1 for attributes and ISO 3951-1 for variables establish lot disposition based on sample size code letters and acceptance numbers. Measurement uncertainty degrades the discriminating power of sampling plan operating characteristic curves.
Measurement errors compound rapidly.

Integrating Measurement Bandwidth into Sampling Plans
Measurement uncertainty blurs the boundary between acceptable quality limit (AQL) and rejectable quality level (RQL). Uncorrected measurement noise shifts operating characteristic curves rightward, causing test benches to accept lots with true defect rates higher than target AQL levels. Correcting variable sampling plans demands adjusting sample standard deviation calculations by subtracting variance introduced by the measurement system itself.
When applying ISO 3951-1 variable sampling, calculate the adjusted quality statistic k-factor by incorporating total standard uncertainty. Narrowing specification limits via guardbanding protects the lot tolerance percent defective (LTPD) threshold. Tolerance limits remain fixed.
- Uncertainty Budget Dossier details every Type A and Type B component, sensitivity coefficient, and combined degree of freedom calculation.
- Gauge Repeatability And Reproducibility Report documents operator variation, equipment variance, and total process variability percentages.
- Traceability Chain Certificates validates that factory reference standards trace directly to national metrology institutes.
- Automated Limits Configuration File provides readable source scripts containing raw guardbanded thresholds used by factory test benches.

Should Producer Risk Transfer to the Buyer under Tight Tolerances?
Tightening specification bands to satisfy demanding system integration requirements compresses factory yield. When test equipment measurement uncertainty consumes more than 30 percent of total tolerance bandwidth, small measurement shifts cause large, compliant production volumes to fail acceptance screening. The contract defines liability.
Contract terms assign financial ownership of false lot rejections. Buyers enforcing custom performance boundaries without accounting for factory bench capability absorb the cost of yield loss through higher unit prices. Factories operating legacy test equipment without traceable calibration transfer metrological risk back onto buyers through elevated field defect rates.
Whether factories ought to absorb the capital overhead of sub-PPM test equipment when buyers tighten tolerance bands without increasing unit purchase prices remains unsettled across commercial contract practice.


Conformity
Formal conformity assessment reports require explicit statement of decision rules used during lot screening. ILAC-G8:09/2019 sets international guidelines for specifying conformity or non-conformity with technical specifications. Standard conformity statements fall into simple acceptance, guardbanded acceptance, or non-binary conditional decision categories.
Documenting these rules eliminates post-delivery disputes regarding lot acceptability.
Factory test floor temperature shifts of three degrees Celsius distort high-precision analog lot verification beyond the entire guardband window.
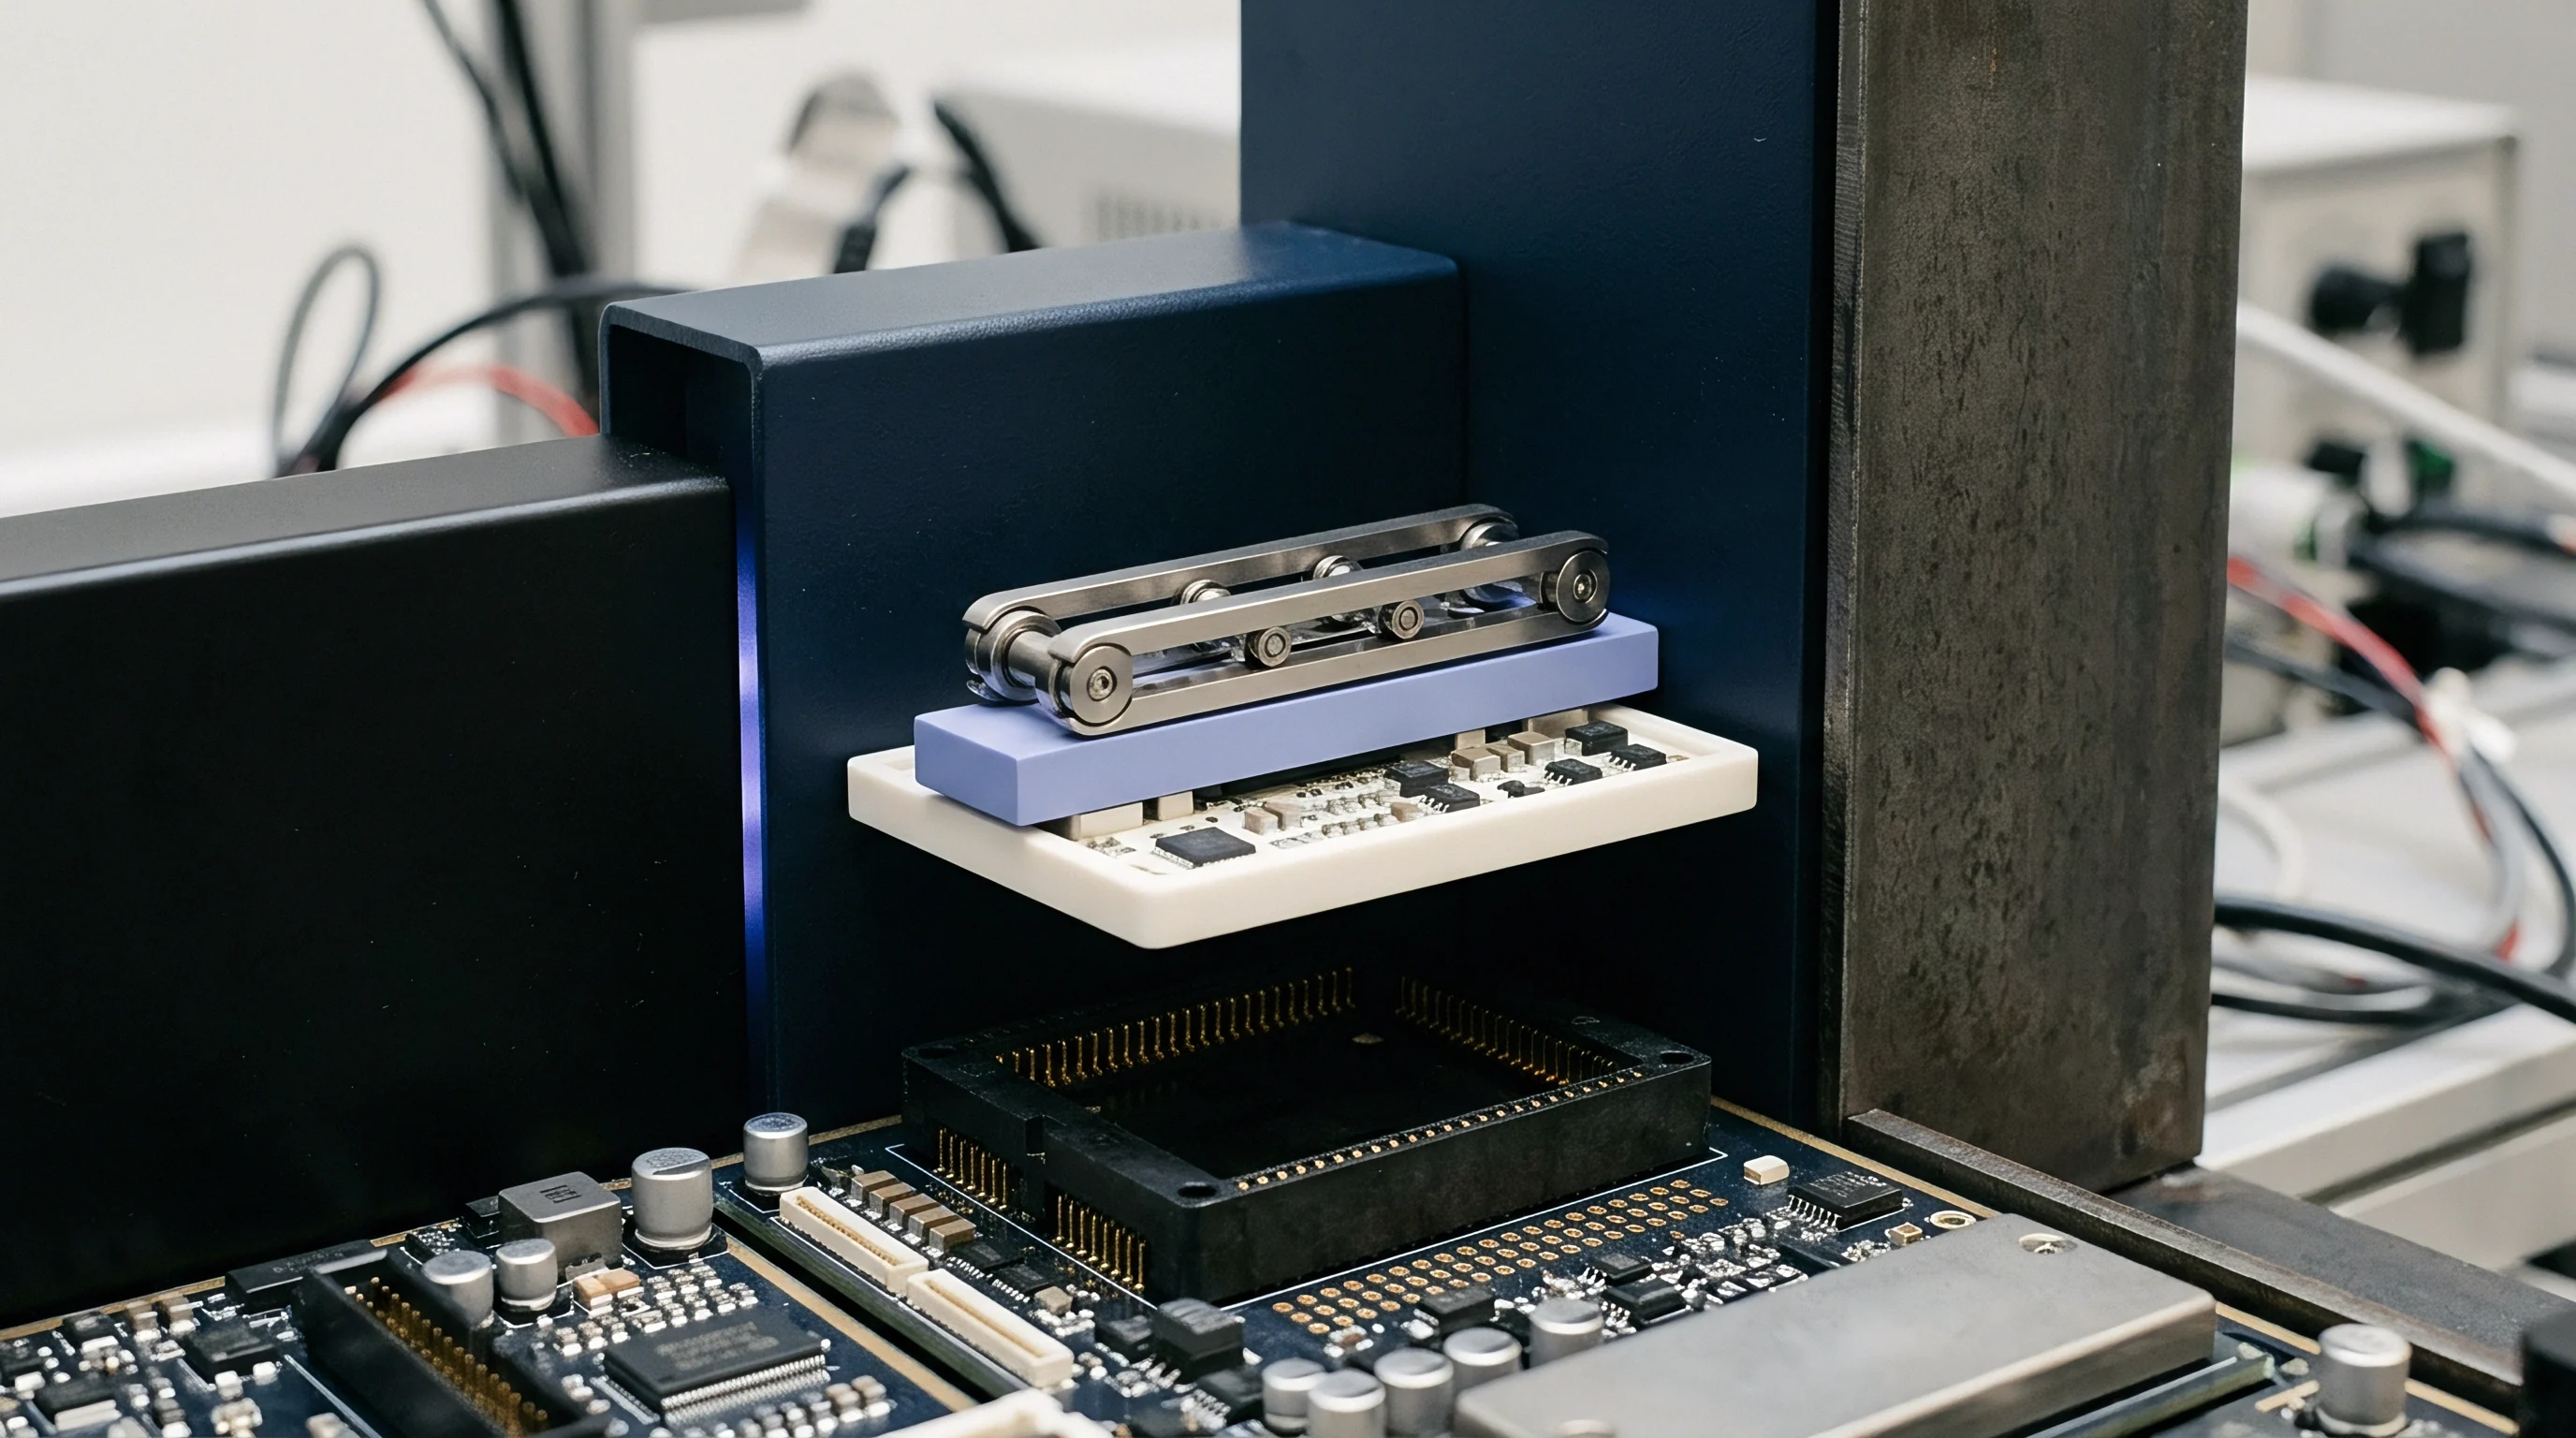
Decision Rules under ILAC Guidelines
Simple acceptance rules apply shared risk principles where buyer and supplier agree to accept lot disposition directly from measured values. Under shared risk, the consumer accepts the probability that items near tolerance boundaries may non-conform, while the producer accepts the risk that valid items may fail. Guardbanded decision rules eliminate shared risk by applying safety zones derived from expanded uncertainty U.
| Standard Framework | Decision Rule Type | Guardband Width | Maximum Consumer Risk | Commercial Allocation |
|---|---|---|---|---|
| ISO 14253-1 | Binary Guardbanded | 1.0 x U | Under 0.1% | Supplier absorbs uncertainty |
| ILAC-G8:09/2019 Clause 5.1 | Simple Acceptance | 0.0 x U | Up to 50.0% | Shared risk between parties |
| ILAC-G8:09/2019 Clause 5.2 | Non-Binary Guardbanded | 1.0 x U | Under 2.0% | Buyer sets safety margin |
| ANSI/NCSL Z540.3 Method A | Probability Banded | 1.65 x U | Under 2.0% | Strict supplier verification |

Contractual Clauses for Shared Metrological Risk
Supply agreements specify metrological acceptance parameters within master purchase contracts. Clear contracts prevent costly lot rejection deadlocks when second-source calibration laboratories yield divergent test measurements on disputed shipments. Shared risk lowers cost.
Standard procurement wording defines reference calibration conditions, target test uncertainty ratios, explicit guardband multipliers, and arbitration laboratory escalation paths. Omitting these parameters forces recourse to default statutory provisions under ISO 14253-1, which automatically imposes strict guardbanding against the supplier.
Shared risk strategies reduce lot rejection frequency whenever measurement capability matches product design margins.


Yield
Imposing conservative guardbands directly impacts production lot yield and unit landed cost. Shifted decision thresholds reject units whose true values lie within specification limits but whose measured values fall inside the uncertainty guardband. False rejections create unnecessary scrap, increase rework cycles, and increase unit cost amortizations across surviving production volumes.
Tight bounds increase scrap.
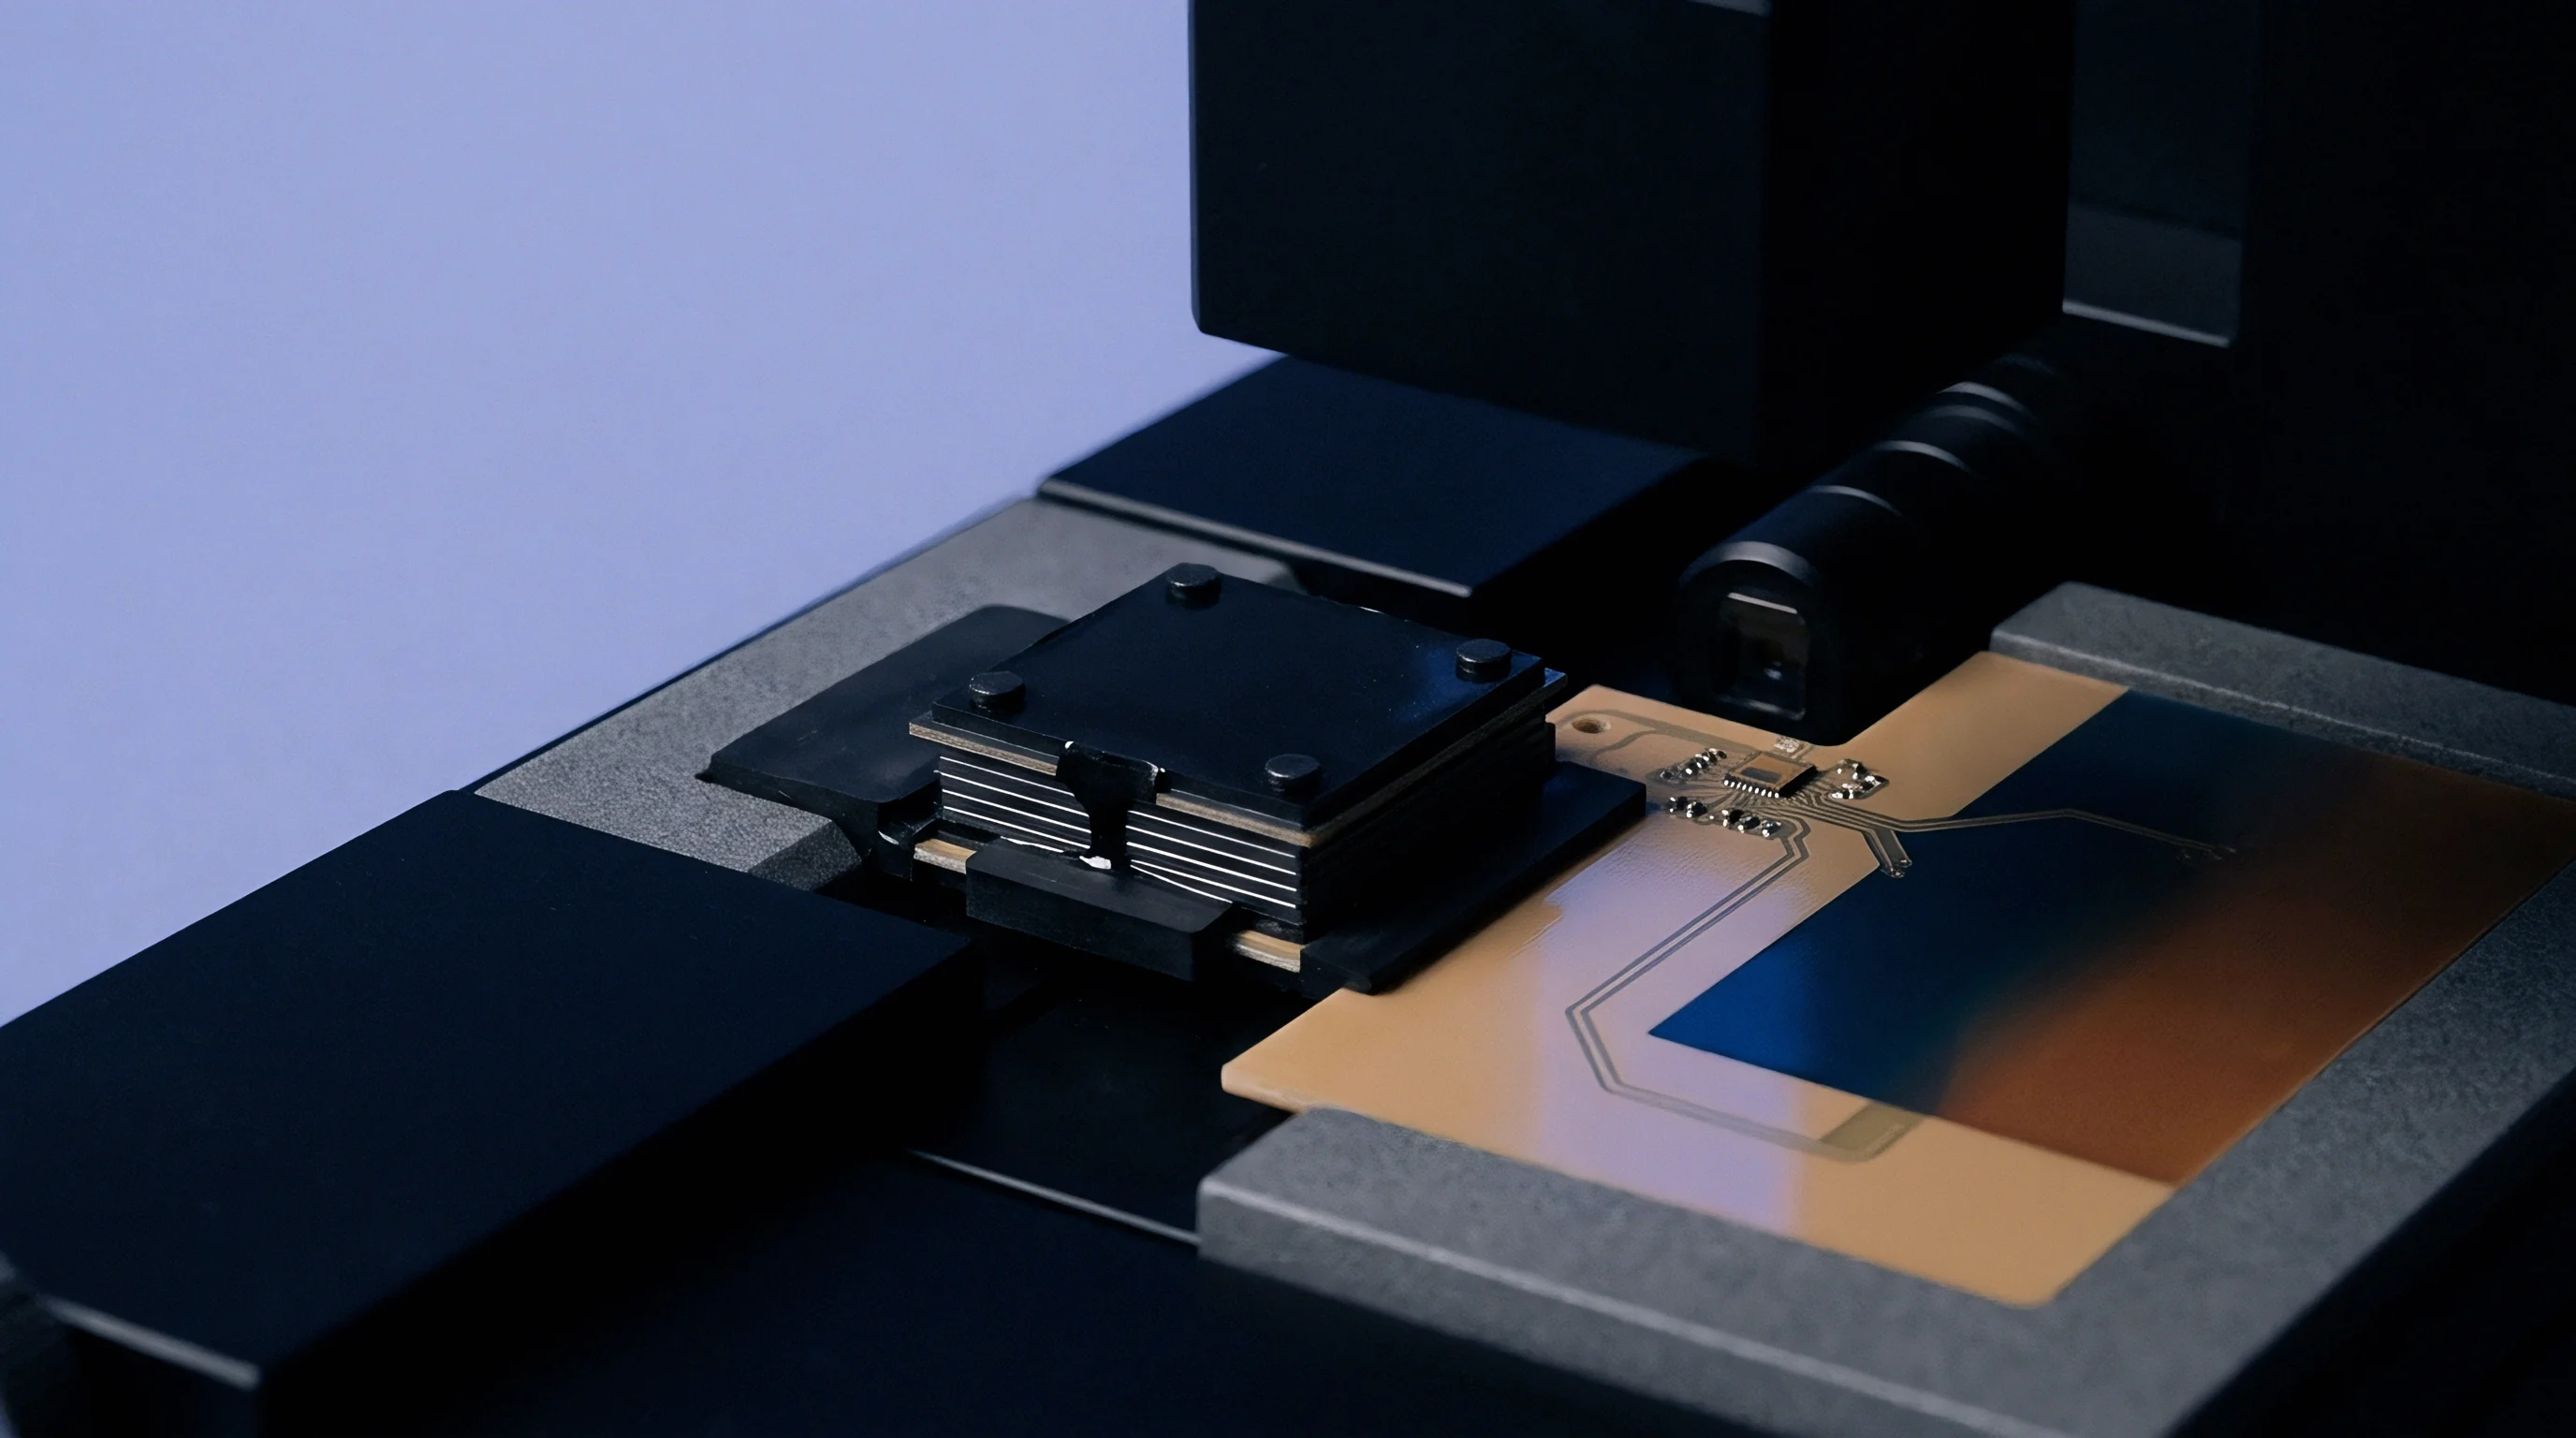
Financial Consequences of Over-Guardbanding Production Lots
Quantifying financial trade-offs between test uncertainty reduction and scrap costs guides capital equipment budgeting. High scrap rates caused by wide guardbands frequently cost significantly more over a single production year than upgrading bench instrumentation to achieve higher test uncertainty ratios.
| Guardband Policy | Effective Yield | False Rejection Rate | Scrap Cost Impact | Field Defect Liability |
|---|---|---|---|---|
| None (Simple Acceptance) | 98.5% | 0.1% | $1,500 | $42,000 |
| Moderate (0.5 x U) | 96.2% | 1.8% | $19,000 | $8,500 |
| Strict (1.0 x U) | 92.8% | 4.5% | $52,000 | $1,200 |
| Ultra-Strict (1.65 x U) | 88.4% | 8.1% | $96,000 | $0 |
| Assumes $10 per unit manufacturing cost and $350 average field warranty claim cost. | ||||

Commercial Dispute Resolution for False Lot Rejections
Re-testing rejected lots introduces measurement bias if automated test parameters are altered without engineering review. Standard lot verification rules require that rejected batches undergo re-screening only on calibrated reference test benches exhibiting a test uncertainty ratio of 10:1 or better. The buyer owns scrap.
False rejections destroy margin.
Contractual dispute resolution workflows mandate joint testing at independent ISO/IEC 17025 accredited laboratories using identical test fixtures and software routines. The party whose measurement results deviate furthest from the accredited reference laboratory findings pays all third-party auditing fees and transport expenses. Test engineers optimize overall financial output by aligning guardband offsets directly with the true economic impact of field failures.