Complex Co-Located Transmitter SAR Permissive Change Evaluation Protocols in Modular Systems
Co-located modular SAR permissive change compliance depends on distance, combined transmit power, and SPLSR calculations to avoid Class II testing.

Exclusion
A pre-certified 5G sub-6 GHz module pushing 24 dBm conducted power into a 2 dBi host antenna at 5 mm separation breaches portable exposure limits almost immediately. Packing multiple radios into a single small housing forces engineering teams to calculate single and combined RF exposure levels before committing to enclosure tooling. Within 20 cm of the body, Specific Absorption Rate evaluation dictates market access across North America, Europe, and Asia-Pacific.
Permissive change rules set by regulators determine whether a host device inherits the module’s existing grant or requires full SAR bench testing in liquid phantom tanks.
The line between calculation and physical lab testing comes down to exclusion thresholds. Under FCC KDB 447498 D04 interim guidance, standalone exclusion relies on a formula linking transmitter frequency and physical separation between antenna and body. Transmitters operating below 300 MHz follow separate propagation curves, whereas modules between 300 MHz and 6 GHz derive thresholds from localized tissue absorption physics.
In several sub-6 GHz industrial handheld designs, minor variations in enclosure wall thickness pushed operating parameters past the calculation limit, forcing mid-qualification hardware revisions.

Mathematical Thresholds for Standalone RF Exposure
Calculating standalone exclusion for a co-located module starts with maximum conducted output power, including manufacturing tune-up tolerances. Maximum power to the antenna, adjusted for duty cycle, sets the threshold parameter. Up to 20 mm separation, the threshold scales linearly with distance alongside a non-linear frequency correction factor.
Between 100 MHz and 6 GHz at distances up to 400 mm, these formulas establish maximum radiated power before physical testing is required.
Handheld and body-worn designs often leave modules with just 5 mm to 15 mm of clearance. At 2.4 GHz, an EIRP above 3 mW at 5 mm forces a single-transmitter SAR measurement. At 5.8 GHz, higher tissue attenuation drops that power threshold even lower for the same geometry.
If an engineer picks a high-gain antenna for a Wi-Fi 6E module to offset chassis losses, the boosted field strength usually voids exclusion, pulling every co-located radio into complex multi-transmitter evaluation protocols.
| Frequency (GHz) | 5 mm Separation | 10 mm Separation | 15 mm Separation | 20 mm Separation |
|---|---|---|---|---|
| 0.450 | 22.0 mW | 44.0 mW | 67.0 mW | 89.0 mW |
| 0.835 | 9.0 mW | 19.0 mW | 29.0 mW | 39.0 mW |
| 1.900 | 3.0 mW | 7.0 mW | 11.0 mW | 15.0 mW |
| 2.450 | 3.0 mW | 6.0 mW | 10.0 mW | 13.0 mW |
| 5.250 | 1.0 mW | 3.0 mW | 5.0 mW | 7.0 mW |
| 5.850 | 1.0 mW | 2.0 mW | 4.0 mW | 6.0 mW |

Frequency Scaling across Multi-Band Modules
Most modern platforms run across multiple bands: a cellular module might combine 700 MHz LTE with 3.5 GHz 5G NR mid-band, while a neighboring Wi-Fi 7 module shifts dynamically between 2.4 GHz, 5 GHz, and 6 GHz. Higher frequencies don’t penetrate as deep, concentrating heat near surface tissue. Lower frequencies penetrate deeper into phantom liquid, spreading out spatial SAR patterns and making overlap with nearby transmitters more likely.
A 2.4 GHz transceiver operating at 13 dBm conducted power requires a minimum 11 mm separation from the human body to bypass SAR measurement protocols under FCC KDB 447498 D04.
Multi-band exclusion relies on a normalized exposure ratio: output power divided by the threshold calculated at that radio’s center frequency. For a single radio, a ratio under 1.0 grants exclusion. In multi-radio setups, individual ratios are summed.
If the total stays at or below 1.0, the entire host bypasses co-located testing. Once that sum exceeds 1.0, integration teams must either increase physical antenna separation, apply dynamic power backoffs, or run full multi-transmitter SAR testing to support a Class II Permissive Change.
Whether global regulators will harmonize sub-6 GHz volumetric E-field summation thresholds across jurisdictions remains to be seen.


Shield
Placing a metal shield between a main cellular antenna and a Wi-Fi patch shifts electric field distribution across the dielectric housing. Spatial interaction between adjacent antennas dictates near-field coupling strength. When two transmitters operate at the same time in a compact enclosure, their near-field emissions can interact constructively, creating localized SAR peaks well above single-antenna baselines.
Ground plane design strongly influences RF exposure behavior in portable devices. Truncating the host ground plane distorts return currents, pushing RF energy into the plastic housing and toward contact points with the body. Antenna separation is the three-dimensional physical vector separating peak near-field current regions on radiating elements, not just a straight air gap between trace centers.
Shortening this vector increases mutual coupling, exciting inactive antenna structures into secondary parasitic radiators that distort local field gradients.

Physical Antenna Separation and Dielectric Detuning
Antenna placement involves tight layout trade-offs. Placing a cellular main antenna at the bottom edge of a tablet and a Bluetooth transceiver at the top corner leaves 200 mm of separation, isolating their near-field patterns completely. Placing sub-6 GHz MIMO antennas within 15 mm of a 5 GHz Wi-Fi array in a handheld device causes severe near-field coupling.
Dielectric materials around antennas shift peak exposure locations. Polycarbonate, ABS, glass-filled resins, and rubber overmolding all alter the effective wavelength of signals right next to tissue. High-permittivity plastics draw electric fields toward the outer housing wall, concentrating SAR into tighter tissue volumes.
Meanwhile, material loss tangent reduces radiation efficiency while pushing more energy dissipation into phantom fluid during bench testing.
Ground plane cutouts beneath dual-radio trace launches suppress near-field antenna coupling before E-field hotspots overlap within host enclosures.

Proximity Sensor Trigger Failures and Near-Field Distortion
Proximity sensors embedded in host housings dial back transmitter power when body contact is detected. Resting a tablet on a lap shifts the local dielectric constant, telling host firmware to reduce power. Shield cans, ground plane extensions, and FPC traces near sensor electrodes add parasitic capacitance that shifts trigger thresholds.
If sensors fail to trigger reliably at specified distances, radios keep transmitting at full power, blowing past SAR limits.
Coupling between active antennas and sensor lines creates secondary failure modes. Strong RF fields from cellular transmitters can rectify into sensor front-end ICs, corrupting baseline readings and causing power to toggle erratically. Dedicated ground fills and inline ferrite suppression on sensor traces prevent RF rectification.
Hardware design teams must isolate sensor lines from antenna keep-out zones to protect detection accuracy during simultaneous transmission.
- Capacitive Sensor Detuning Parasitic capacitance from adjacent metallic frame elements shifts sensor baseline thresholds, preventing power reduction triggers when body phantom proximity occurs within 5 mm.
- RF Rectification Interference High-power near-field emissions inject high-frequency noise into sensor analog traces, causing false triggers or disabling automatic power step-downs during transmission.
- Dielectric Loading Shifts Custom housing wall thickness variations pull near-field electric peak locations outward, raising measured 1g tissue SAR despite identical antenna input power.
- Parasitic Radiator Coupling Inactive co-located antennas absorb near-field energy from primary radiators, re-emitting RF energy and creating unintended SAR hotspots across host housing seams.
Increasing physical separation between co-located radiators lowers peak local absorption far more reliably than tweaking firmware backoff tables.

Summation
Assessing simultaneous transmit ratios across multi-radio platforms requires evaluating SAR spatial overlap across a 3D coordinate grid. Once multiple certified modules transmit at the same time, standalone exclusions no longer apply on their own. Engineers sum the simultaneous SAR ratios to see if formal multi-transmitter lab testing is required.
The calculation sums the 1g or 10g SAR values for all active co-located radios. If individual 1g SAR values for cellular, Wi-Fi, and Bluetooth radios are 0.8 W/kg, 0.5 W/kg, and 0.1 W/kg, the scalar sum comes out to 1.4 W/kg. Since 1.4 W/kg is below the 1.6 W/kg limit, the system complies without further testing.
But when peak values add up to more than 1.6 W/kg, scalar addition triggers expensive hardware redesigns unless spatial separation analysis can be used.

Calculating Peak Location Separation Ratios
Spatial separation analysis uses physical distance between peak SAR coordinates to bypass unnecessary chamber testing. The Peak Location Separation Ratio (SPLSR) calculation maps 3D coordinates for the highest 1g SAR points of each active radio inside the device volume. If two hotspots are sufficiently far apart, absorption from one drops off before reaching the peak zone of the other.
The formula takes the combined SAR sum raised to the 1.5 power and divides it by the 3D distance between the two peak locations in the phantom. For 1g SAR, a ratio of 0.04 or lower achieves compliance by exclusion. For 10g extremity SAR, that threshold expands to 0.10.
On a rugged tablet project, a 42 mm spatial separation between a 5G NR n77 hotspot and a 6 GHz Wi-Fi hotspot yielded a ratio of 0.028, bypassing physical co-located chamber testing.
| Radio Configuration | Max 1g SAR Radio 1 (W/kg) | Max 1g SAR Radio 2 (W/kg) | Scalar Sum (W/kg) | 3D Peak Distance (mm) | Calculated SPLSR | Compliance Pathway |
|---|---|---|---|---|---|---|
| LTE Band 4 + Wi-Fi 2.4 GHz | 0.72 | 0.45 | 1.17 | N/A | N/A | Excluded (Sum < 1.6) |
| 5G NR n77 + Wi-Fi 5 GHz | 1.15 | 0.68 | 1.83 | 54.2 | 0.046 | Full Co-located Testing Required |
| 5G NR n41 + Wi-Fi 6E | 0.98 | 0.54 | 1.52 | N/A | N/A | Excluded (Sum < 1.6) |
| LTE Band 13 + Wi-Fi 6E | 1.05 | 0.82 | 1.87 | 68.5 | 0.037 | Excluded via SPLSR Calculation |
| 5G NR n258 + Wi-Fi 5 GHz | 0.85 | 0.89 | 1.74 | 22.1 | 0.104 | Full Co-located Testing Required |
Is Volumetric E-Field Averaging Required for Multi-Radio Arrays?
When peak locations sit close together and the separation ratio exceeds 0.04, neither scalar sums nor spatial separation will validate compliance. Test engineers must execute volumetric E-field summation across the entire 3D phantom measurement grid. Automated systems export raw spatial field data for each transmitter measured separately in the host geometry, which is then normalized, phase-aligned, and summed point by point across millions of grid coordinates.
Volumetric summation captures actual field decay curves through tissue-equivalent media. Two 0.9 W/kg hotspots separated by 15 mm might give a simple scalar sum of 1.8 W/kg, but point-by-point addition often shows off-axis roll-off keeping peak exposure to 1.45 W/kg at any single grid location. Demonstrating compliance this way lets integrators avoid simultaneous chamber runs, saving lab fees while preserving transmitter power.
Failing to record 3D peak SAR coordinates during initial single-transmitter scans forces lab technicians to repeat full area scans across all operating modes during permissive change filings.
Backoff
Real-time power control algorithms track cumulative RF energy dissipation in human tissue over rolling time windows. Dynamic backoff frameworks ~ such as Time-Averaged SAR or Smart Transmit ~ manage exposure across co-located modules on the fly. Instead of locking modules to low power limits for worst-case conditions, these algorithms allow temporary high-power bursts when link quality drops, stepping power back down before rolling limits are breached.
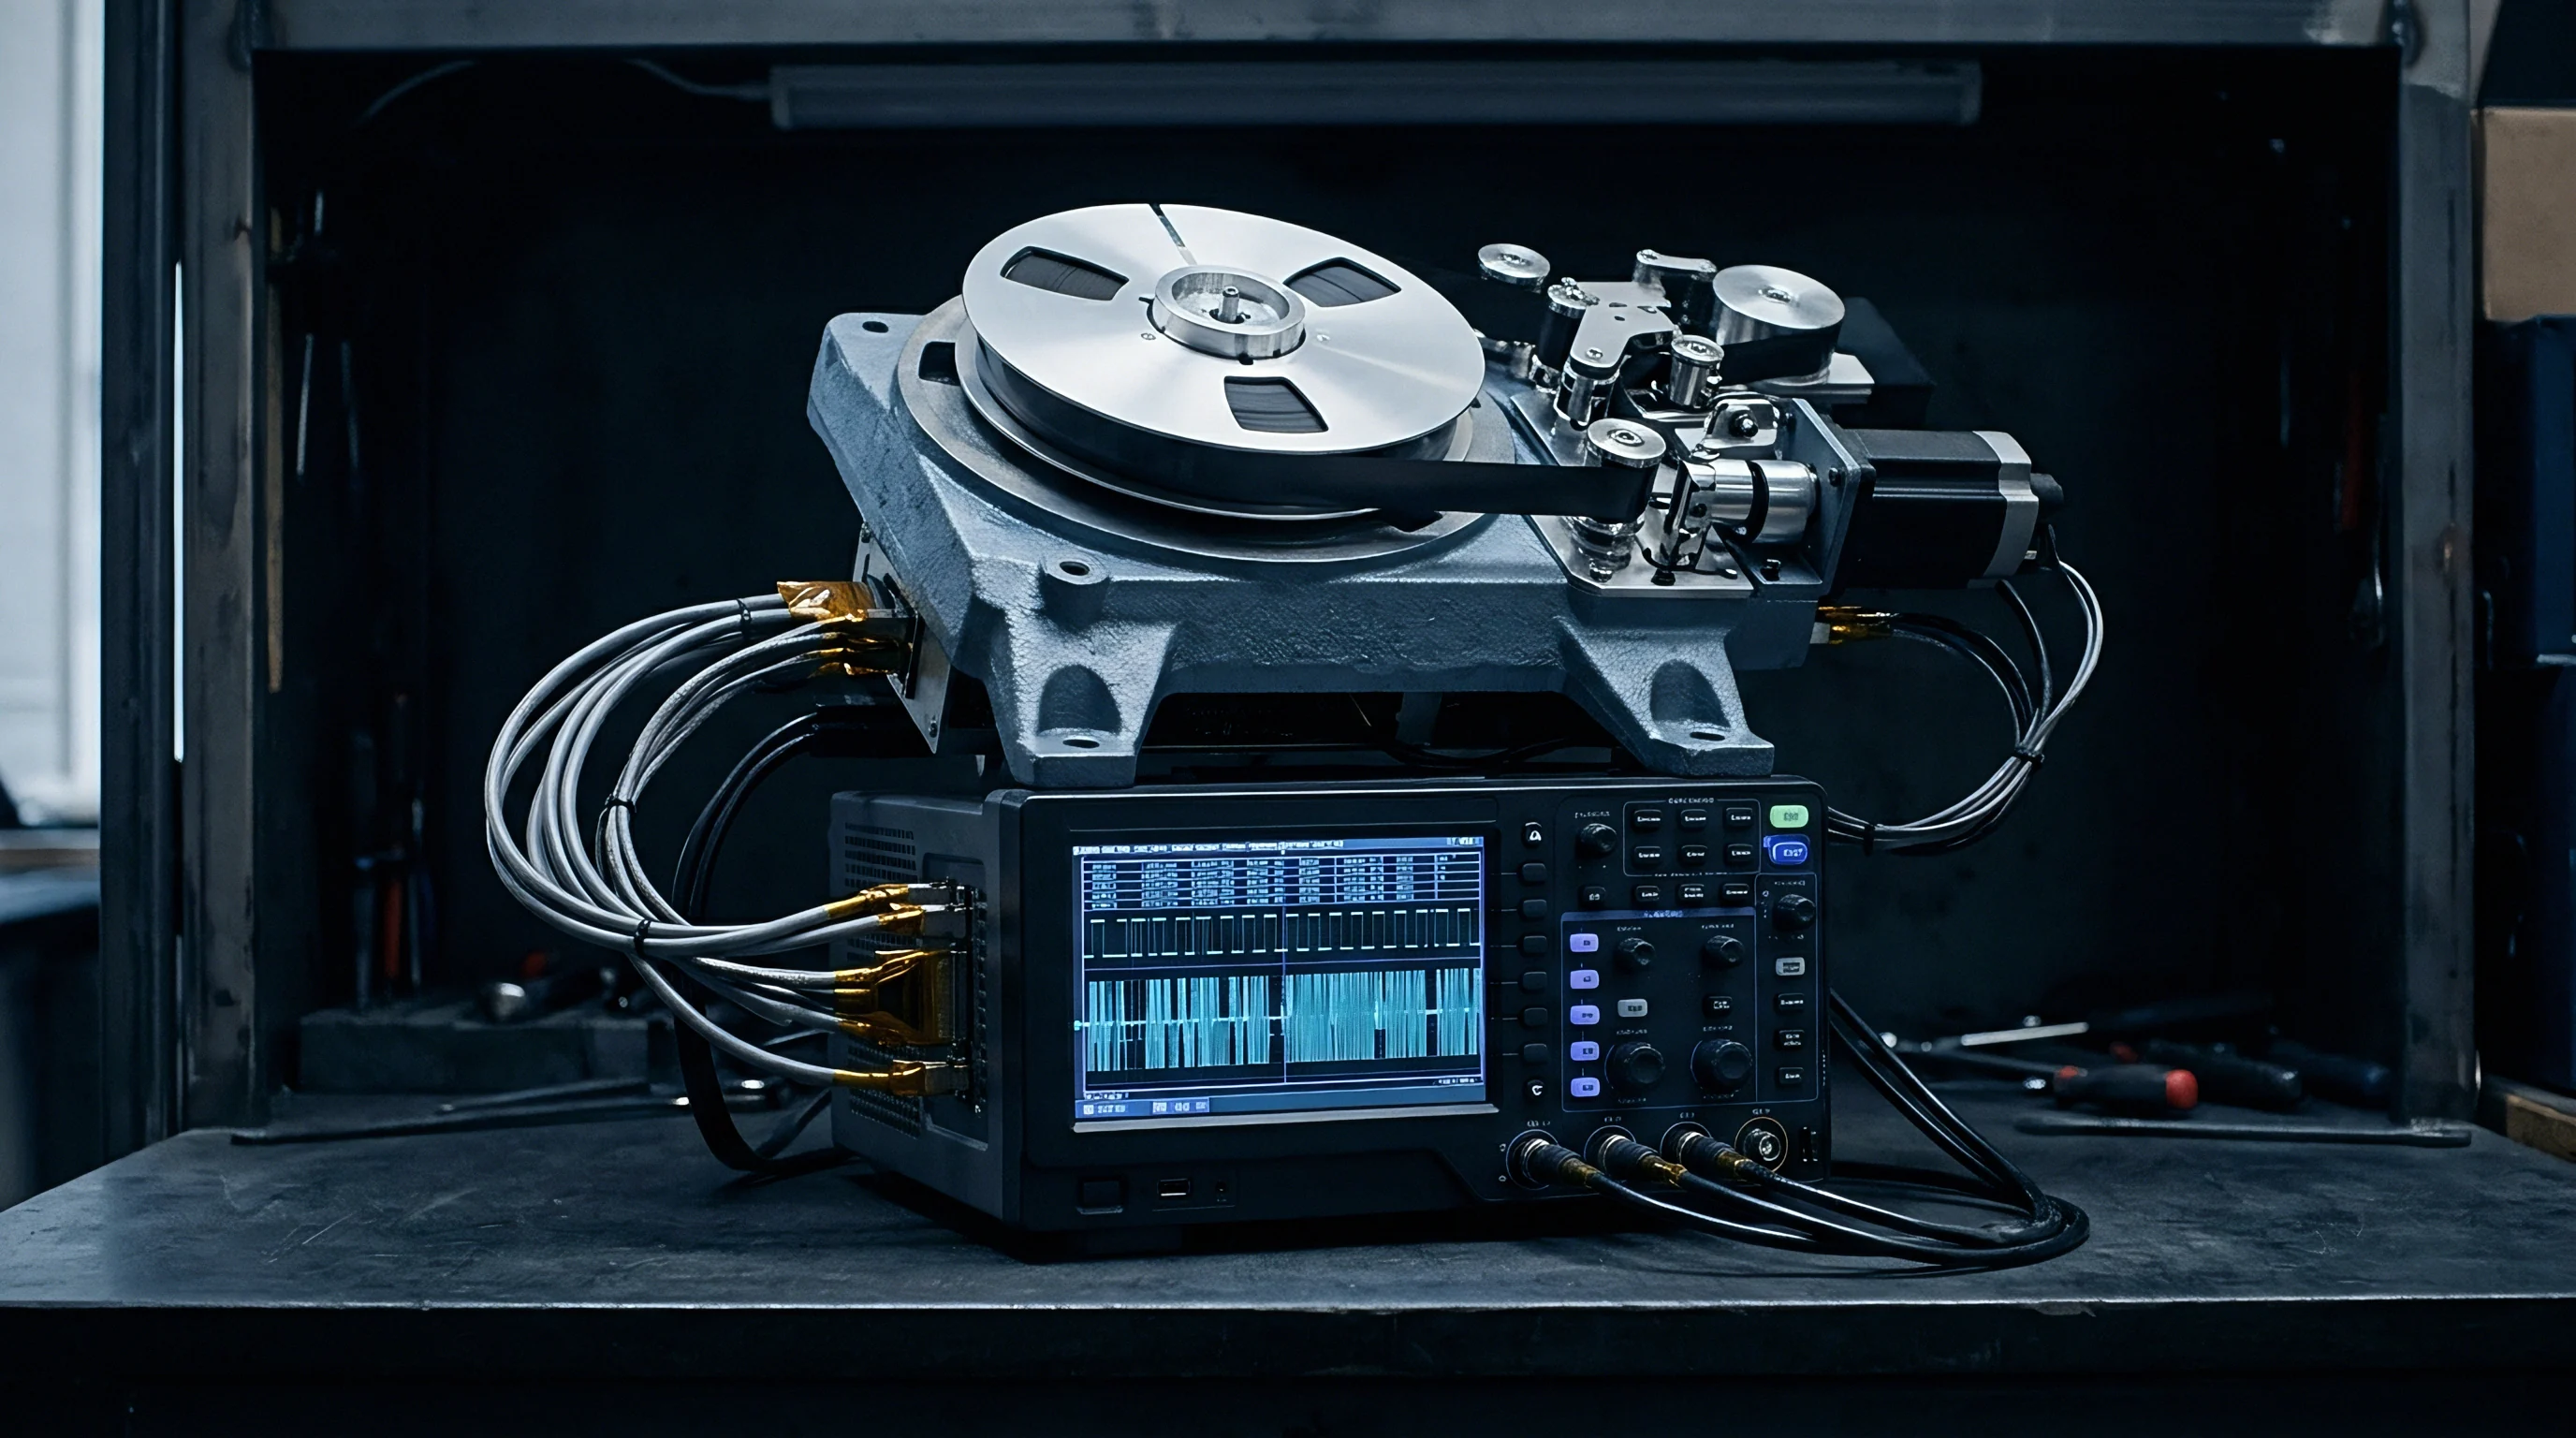
Dynamic backoff architecture requires tight integration between cellular baseband modems, Wi-Fi chipsets, host operating systems, and proximity sensors. Firmware state machines maintain a continuous energy balance register. When weak cellular signals push a radio to maximum power, the host algorithm throttles Wi-Fi transmit power or limits active MIMO spatial streams to keep cumulative exposure within bounds.

Time-Averaged Power Control Algorithms
Regulatory time-averaging intervals depend on the frequency band. Sub-3 GHz operations use a 100-second moving average window, while 3 GHz to 6 GHz allocations enforce a 60-second window. Above 6 GHz, power density limits drop to 4-second windows.
Algorithms calculate instantaneous power levels to track normalized exposure ratios across active radios in real time.
A cellular modem transmitting at full 24 dBm consumes most of the instantaneous exposure budget. If a user starts a large Wi-Fi upload at the same time, the dynamic SAR controller calculates that total energy will breach 1.6 W/kg within 12 seconds and commands the Wi-Fi module to drop power by 4 dB, stabilizing the rolling average without dropping cellular throughput.
- Flash host firmware with vendor-specific dynamic SAR driver tables mapping power step-downs to verified sensor states.
- Connect co-located radio antenna ports to high-speed directional couplers feeding calibrated RF power meters.
- Mount finished host device against tissue-equivalent phantom inside automated 6-axis DASY SAR measurement system.
- Initiate simultaneous cellular data call and Wi-Fi transmission using wireless communication test sets.
- Trigger physical proximity sensor by introducing phantom tissue slab within target 5 mm activation zone.
- Capture real-time power drop response times across directional couplers to verify step-down completion within 100 ms.
- Record 100-second continuous SAR area scan to confirm time-averaged exposure remains below 1.6 W/kg limit.

Firmware State Machine Execution for Simultaneous Radios
Firmware execution logic must manage multi-radio arbitration without introducing race conditions or software freezes. Host driver architectures rely on lookup tables pre-stored in non-volatile memory that define max allowable power vectors for every valid state, covering active band combinations, voice call status, Wi-Fi frequency, and proximity sensor states.
Compliance under IEC/IEEE 62209-1528 clause 7.2 dictates that time-averaged power algorithms update transmit levels within rolling 100-second windows for frequencies below 3 GHz.
Validating state machine logic requires testing edge cases. If an OS update stalls driver execution threads, baseband modems might miss power step-down commands. Hardware watchdog timers must force fallback to safe lower power tables if software communication drops for more than 200 milliseconds.
System architects also need to confirm that backoff routines hold up across OS sleep, wake, and thermal throttling transitions.
Module vendors often claim firmware backoff tables work autonomously in any host, overlooking how antenna loading and chassis ground planes alter the calibrated SAR ratios baked into default driver builds.

Filing
Submitting modular radio modifications to Telecommunication Certification Bodies demands strict adherence to equipment authorization rules governing transmitter co-location. Integrators using pre-certified modules often assume host integration is purely administrative paperwork. But altering antenna gains, reducing separation distances, or enabling new multi-transmitter modes triggers permissive change protocols that dictate whether the product can ship immediately or requires formal TCB approval.
Permissive changes under FCC rules fall into two main categories. Class I Permissive Changes apply to modifications that do not degrade RF parameters, increase reported SAR levels, or introduce new simultaneous transmission modes. No regulatory filing is required prior to marketing Class I changes, though engineering documentation must be retained in corporate compliance files.
Class II Permissive Changes apply when hardware or software alterations increase reported RF exposure levels, change antenna types, or enable co-location with radios not covered under the original modular grant.
Regulatory Boundaries for Class I and Class II Changes
Deciding on a permissive change path comes down to comparing new host SAR data against original grant parameters. If a pre-certified Wi-Fi module showed a standalone SAR of 0.4 W/kg on its original grant, but host enclosure reflection pushes it to 0.7 W/kg, the change exceeds Class I limits. That elevated SAR level forces a Class II Permissive Change filing backed by host-specific lab test reports.
Modifying grant conditions across multi-vendor assemblies creates authorization hurdles. If Module A’s grant permits co-location only with specific low-power Bluetooth transceivers, integrating Module A alongside a high-power 5G NR module invalidates Module A’s grant conditions. The host integrator must file a Class II Permissive Change under their own grantee code or obtain a grant change authorization letter from the module manufacturer.
TCB reviewers scrutinize trace routing carefully.
| Modification Parameter | Measured Impact | Regulatory Classification | Filing Requirement | Required Test Data |
|---|---|---|---|---|
| Antenna Type Swap (Same Gain) | SAR drops from 0.8 to 0.6 W/kg | Class I Permissive Change | No Filing (Internal File Only) | Radiated spurious & internal SAR log |
| Antenna Gain Increase | Standalone SAR increases 15% | Class II Permissive Change | Formal TCB Submission | Full SAR lab test report |
| Enclosure Separation Reduced | Distance shrinks from 15 mm to 5 mm | Class II Permissive Change | Formal TCB Submission | Proximity sensor & SAR report |
| New Simultaneous Radio Enabled | Combined SAR Sum = 1.35 W/kg | Class II Permissive Change | Formal TCB Submission | SPLSR & Co-located test data |
| Dynamic SAR Firmware Flash | Power backoff step-down active | Class II Permissive Change | Formal TCB Submission | Time-averaged power validation |
Host Platform Permissive Change Strategy Matrix
Choosing the right equipment authorization path minimizes market launch delays while preserving legal distribution rights across global territories. Lead engineers must audit modular grant notes before freezing host PCB layouts. Certain modular grants carry strict restrictive conditions forbidding body-worn configurations entirely, rendering permissive changes impossible without undergoing full original equipment certification under a new FCC ID.
A host device incorporating an pre-authorized radio module with altered antenna gain figures automatically invalidates standalone modular grant exemptions.
Documenting permissive change compliance demands clear traceability across design files. Regulatory authorities perform market surveillance, pulling commercial products off retail shelves for verification testing. If regulatory test labs uncover co-located SAR overruns or undocumented antenna changes, authorities issue immediate sales halts and administrative fines.
Establishing a standardized change evaluation protocol protects corporate product lines against compliance enforcement actions.
- Grant Restrictive Audit Reviewing original modular grant conditions identifies co-location prohibitions and power restrictions prior to host PCB spin commitment.
- Antenna Gain Verification Measuring 3D passive antenna patterns inside calibrated chambers confirms real host gain remains within original modular filing envelope limits.
- Co-Location Exemption Calculation Computing standalone ratio sums and SPLSR figures establishes mathematical compliance proof for internal Class I filing technical dossiers.
- TCB Dossier Assembly Consolidating tissue liquid calibrations, probe certificates, spatial SAR plots, and firmware driver documentation ensures rapid Class II approval.
FCC KDB 178919 D01 section III.D specifies that introducing simultaneous transmission modes not covered in the original grant requires a Class II Permissive Change supported by SAR evaluation data.


Dossier
Assembling a regulatory submission package for co-located transmitters means auditing lab probe calibrations, tissue liquid recipes, and test bench repeatability. Telecommunication Certification Bodies regularly reject permissive change dossiers that lack clear trace geometry documentation or explicit power measurement uncertainty calculations. Technical documentation must demonstrate that SAR evaluation procedures strictly followed international measurement standards including IEC/IEEE 62209-1528 and FCC KDB publication protocols.
Submission validity relies heavily on lab quality control. SAR testing uses robotic arms to position miniature E-field probes inside liquid-filled phantom shells shaped like heads or torsos. Small errors in tissue dielectric property mixing can shift measured SAR values by over 15 percent, invalidating pass/fail conclusions.
Sourcing managers and compliance directors must verify that contract testing facilities hold active ISO/IEC 17025 accreditation with specific scope coverage for multi-transmitter RF exposure evaluation.

Laboratory Audit Criteria for Co-Located SAR Measurements
Auditing third-party SAR test reports demands systematic verification of measurement parameters. Reviewing engineers must cross-check reported conducted transmit power levels against target tune-up tolerances declared in host product specifications. If the laboratory performs SAR testing on a module operating 2 dB below maximum tune-up power, reported SAR values must be scaled mathematically to reflect absolute worst-case production output.
Tissue dielectric properties need bench verification prior to every testing sequence. Mixtures of water, sugar, salt, cellulose, and diethylene glycol butyl ether must match target permittivity and conductivity values within a strict 5 percent window across the measurement frequency span. If dielectric logs reveal permittivity drift beyond allowable limits, SAR hotspots shift spatially, invalidating the spatial separation ratio calculations used for permissive change exemptions.
Commercial Cost Mechanics and Test Time Budgeting
Co-located SAR testing adds substantial expense to product development budgets. Standalone testing for a single-band radio module costs between $4,000 and $8,000 in commercial laboratories. Adding co-located multi-radio evaluations, proximity sensor trigger validations, and dynamic time-averaged power backoff tests pushes total fees to between $25,000 and $50,000 per host model.
Test time directly impacts launch schedules. A complete multi-band, multi-radio co-located SAR evaluation requires 40 to 80 bench hours inside accredited phantom chambers. Each operating band demands area scans, zoom scans, and multi-channel evaluations across left, right, front, back, and corner host orientations.
If state-machine power backoff verification fails mid-test due to a firmware bug, testing halts and lab reservation blocks are wasted. Hardware teams should validate dynamic power control algorithms internally using directional couplers before booking official chamber time.
Documenting tissue fluid dielectric properties within 5% of target values across the full 700 MHz to 6 GHz evaluation range ensures the compliance dossier withstands regulatory audits without requiring re-testing.