Multi Band Total Isotropic Sensitivity Verification under Carrier Limits
Carrier limits require verifying multi-band total isotropic sensitivity with transmitters operating at full output power to ensure link budget survival.


Impairment
Transmit circuitry operating at maximum power couples broad-spectrum electromagnetic noise directly into co-located receive chains. When a cellular module or IoT transceiver radiates at full output, typically +23 dBm for LTE Class 3 or +26 dBm for LTE Class 2, the high-power amplifier emits thermal noise, phase noise, and broadband spurious energy that extends far beyond the nominal transmit channel. In multi-band and concurrent-radio hardware, this broad spectrum spills into adjacent or harmonic receive frequencies.
High transmit power levels drive close-in low-noise amplifiers into non-linear compression, reducing receiver gain and corrupting packet detection thresholds. Noise floor elevation destroys link margin.
Transmitter Noise Floor Elevation Mechanisms
High-power output stages emit broadband thermal noise that spans adjacent frequency allocations. A power amplifier operating near continuous saturation exhibits an elevated noise floor across a band exceeding 100 MHz. When duplexer isolation proves insufficient to attenuate this thermal spillover, transmit noise reaches the receiver front-end without spatial attenuation.
Ground planes require continuous shielding. In narrow duplex-gap allocations such as LTE Band 13 (777 to 787 MHz transmit, 746 to 756 MHz receive) or Band 12 (699 to 716 MHz transmit, 729 to 746 MHz receive), the duplex gap spans only 10 to 20 MHz. At these offset frequencies, power amplifier noise spillover sits only 30 dB to 40 dB below peak carrier power, overwhelming weak inbound signals at the low-noise amplifier input.
A LTE Class 3 transmitter radiating 23 dBm in Band 13 degrades co-located GPS L1 receiver sensitivity by 18 dB when ground plane isolation drops below 15 dB.
Active desensitization scales directly with transmit power and coupling path efficiency. Board spin cycles add cost. In compact multi-radio designs, electromagnetic coupling occurs through four main physical mechanisms:
- Power amplifier noise floor expansion occurs when high-power output stages emit broadband thermal noise across adjacent receive frequencies, bypassing internal module filters and entering co-located receiver front-ends.
- Digital clock harmonic coupling transfers high-frequency energy from MIPI display interfaces and PCIe data lanes straight into sub-GHz receive channels, elevating receiver noise floors during active burst writes.
- Duplexer cross-talk bypasses printed circuit board spatial separation through shared ground vias and unbalanced return paths, leaking transmit carrier power into the receive low-noise amplifier.
- Switching regulator ripple modulates power amplifier supply rails, creating sidebands that overlap lower duplexer receive bands and corrupt signal-to-noise ratios during peak packet transmission.
Digital Bus Clock Intermodulation
Traces carrying high-speed serial data act as unintended radiating antennas across dense circuit layouts. Fast switching edges on MIPI, USB 3.2, and SPI buses generate harmonics that fall directly into cellular and sub-GHz receive bands. When high-power RF transmit bursts energize nearby ground planes, non-linear junctions in semiconductor ESD protection diodes blend RF carrier energy with digital clock harmonics.
This intermodulation creates spur frequencies inside active receive channels, causing sudden sensitivity drops during high data throughput bursts. Ignoring these board-level coupling paths during layout forces design teams into expensive enclosure redesigns late in certification.
Unshielded PCB traces act as parasitic antenna elements that re-radiate ground currents into receiver antennas. When multi-layer boards lack continuous stitched ground planes around high-speed lines, electromagnetic fields spread through dielectric substrates. The resulting desensitization prevents the receiver from capturing low-power signals at cell edges, causing persistent packet loss under heavy transmit activity.

Notch
RF front-end architectures rely on duplexers, surface acoustic wave filters, and physical isolation to prevent transmit energy from flooding the receiver. In multi-band radio systems, achieving effective stopband rejection requires tuning filter notches to match specific band allocations. Selectivity limits real-world range.
When operating across sub-GHz frequencies, the physical dimensions of acoustic wave resonators constrain achievable attenuation slopes. Duplexer isolation governs receiver desense. Inadequate notch depth along the transmit-to-receive leakage path allows high-power carrier signals to desensitize the receiver front-end, lowering total isotropic sensitivity across all spatial angles.

Surface Acoustic Wave Filtering Limits
Substrate materials in thin-film resonators impose physical limits on attenuation steepness. Surface acoustic wave (SAW) and bulk acoustic wave (BAW) duplexers provide sharp stopband rejection, yet physical temperature coefficients induce frequency drift under high transmit power loads. As power amplifier thermal dissipation raises duplexer internal temperatures, filter passbands shift by up to 0.05 MHz per degree Celsius.
Unshielded inductors radiate magnetic fields. This thermal drift reduces notch attenuation at the receive channel center frequency, allowing transmit noise to enter the low-noise amplifier.
| Frequency Band | Transmit Range (MHz) | Receive Range (MHz) | Duplex Gap (MHz) | Typical Isolation (dB) | Active Desense (dB) |
|---|---|---|---|---|---|
| LTE Band 12 | 699 to 716 | 729 to 746 | 13 | 42 | 2.8 |
| LTE Band 13 | 777 to 787 | 746 to 756 | 11 | 45 | 2.1 |
| LTE Band 20 | 832 to 862 | 791 to 821 | 11 | 41 | 3.4 |
| LTE Band 28 | 703 to 748 | 758 to 803 | 10 | 38 | 4.2 |
| 5G NR n78 | 3300 to 3800 | 3300 to 3800 | TDD | 55 | 0.6 |
Ground Plane Return Path Separation
Unbroken copper layers under the radio frequency front-end prevent harmonic currents from entering sensitive receiver low-noise amplifiers. High-frequency return currents follow paths of minimum inductance directly beneath signal traces. When ground planes carry cuts, slots, or dense via arrays, return currents divert around discontinuities, creating loop antennas that radiate RF energy into adjacent receiver circuits.
Providing uninterrupted ground return paths beneath duplexers and power amplifiers maintains design filter notch depth across all operating temperature ranges.
Multi-layer board layouts demand dedicated shielding fences between transmit matching networks and receive input lines. Without solid metal shielding cans grounded through closely spaced vias, radiated energy bypasses duplexer notch filters entirely through air-coupling paths inside the device enclosure. Sourcing teams encounter module supplier excuses attributing active desensitization failures to external board layout deficiencies, claiming integrated front-end filters operate within specification only when mounted on unpopulated reference evaluation boards.

Threshold
Carrier certification specifications published by PTCRB and CTIA establish binding radiated performance limits across every operational frequency band. Mobile network operators require total isotropic sensitivity verification to guarantee device connection stability at cell boundaries. Carrier labs enforce zero tolerance.
Specifications define baseline sensitivity thresholds alongside maximum allowable desense limits when transmitters run at full output power. Sensitivity drops under concurrent transmit. Devices failing these radiated sensitivity limits face rejection, delaying network onboarding and commercial distribution.

Carrier Requirements and Desense Allocations
Network operators publish technical standards specifying the maximum allowable sensitivity reduction under simultaneous transmit conditions. North American tier-one carriers allow between 0.5 dB and 3.0 dB of active desensitization depending on band pairing, guard bands, and duplex spacing. In narrow sub-GHz bands, exceeding allowable desense limits results in immediate test failure during certification audits.
Device vendors manage desense budgets down to fractions of a decibel to preserve link performance in weak signal coverage areas.
CTIA OTA Test Plan Section 5.3 mandates that any desense exceeding 3 dB under simultaneous transmitter operation invalidates the device certification file for North American tier-one carriers.
Compliance auditing relies on structured evaluation metrics applied consistently across test laboratories:
- Band allocation mapping requires cross-referencing intended carrier deployment geography with specific duplexer gap constraints before finalizing radio module selection.
- Desense budget allocation sets hard limits on allowable receiver sensitivity degradation under concurrent maximum transmit power, ensuring field performance matches conductive link estimates.
- Anechoic chamber baseline validation verifies background RF noise floors before mounting device prototypes onto non-reflective test fixtures for over-the-air measurement sweeps.
- Conductive versus radiated audit separates internal board noise from antenna-coupled transmit feedthrough by comparing direct coax link tests against fully assembled chamber sweeps.
Conducted versus Radiated Verification Rules
Testing through direct coaxial cables isolates board-level noise coupling from antenna-driven spatial feedback. Conducted sensitivity measurements reveal internal board noise, power amplifier noise spillover, and digital clock interference within the module shield. Radiated measurements capture antenna pattern distortion, dielectric loading by enclosures, and near-field spatial feedback from radiating elements into internal board structures.
A radio design exhibiting zero conducted desense can fail radiated tests when the main antenna couples transmit power directly into nearby circuit traces.
| Operating Band | Carrier Limit (dBm) | Max Conducted Desense (dB) | Max Radiated Desense (dB) | Target TIS Limit (dBm) |
|---|---|---|---|---|
| LTE Band 2 (1900 MHz) | -104.0 | 1.0 | 1.5 | -102.5 |
| LTE Band 4 (1700/2100 MHz) | -103.5 | 1.0 | 1.5 | -102.0 |
| LTE Band 12 (700 MHz) | -101.0 | 2.0 | 3.0 | -98.0 |
| LTE Band 13 (700 MHz) | -101.5 | 1.5 | 2.5 | -99.0 |
| 5G NR n77 (3700 MHz) | -93.0 | 0.8 | 1.2 | -91.8 |
Master supply agreements incorporate carrier test specifications by reference, stipulating that delivered module lots satisfy CTIA OTA test plan requirements under full carrier transmit power. Failure to meet mandated radiated limits obligates module vendors to redesign front-end filtering at their own expense.

Grid
Radiated sensitivity testing requires three-dimensional spherical measurements performed inside anechoic chambers equipped with multi-axis positioning systems. Over-the-air evaluations sample effective receiver performance across 4pi steradians to compute total isotropic sensitivity. Receiver noise figure sets the floor.
Spatial measurements integrate local sensitivity readings over the full sphere, capturing antenna gain variations, blind spots, and localized desensitization caused by internal noise sources. Antenna pattern tilt distorts spatial integration.
Three Dimensional Spherical Integration Methods
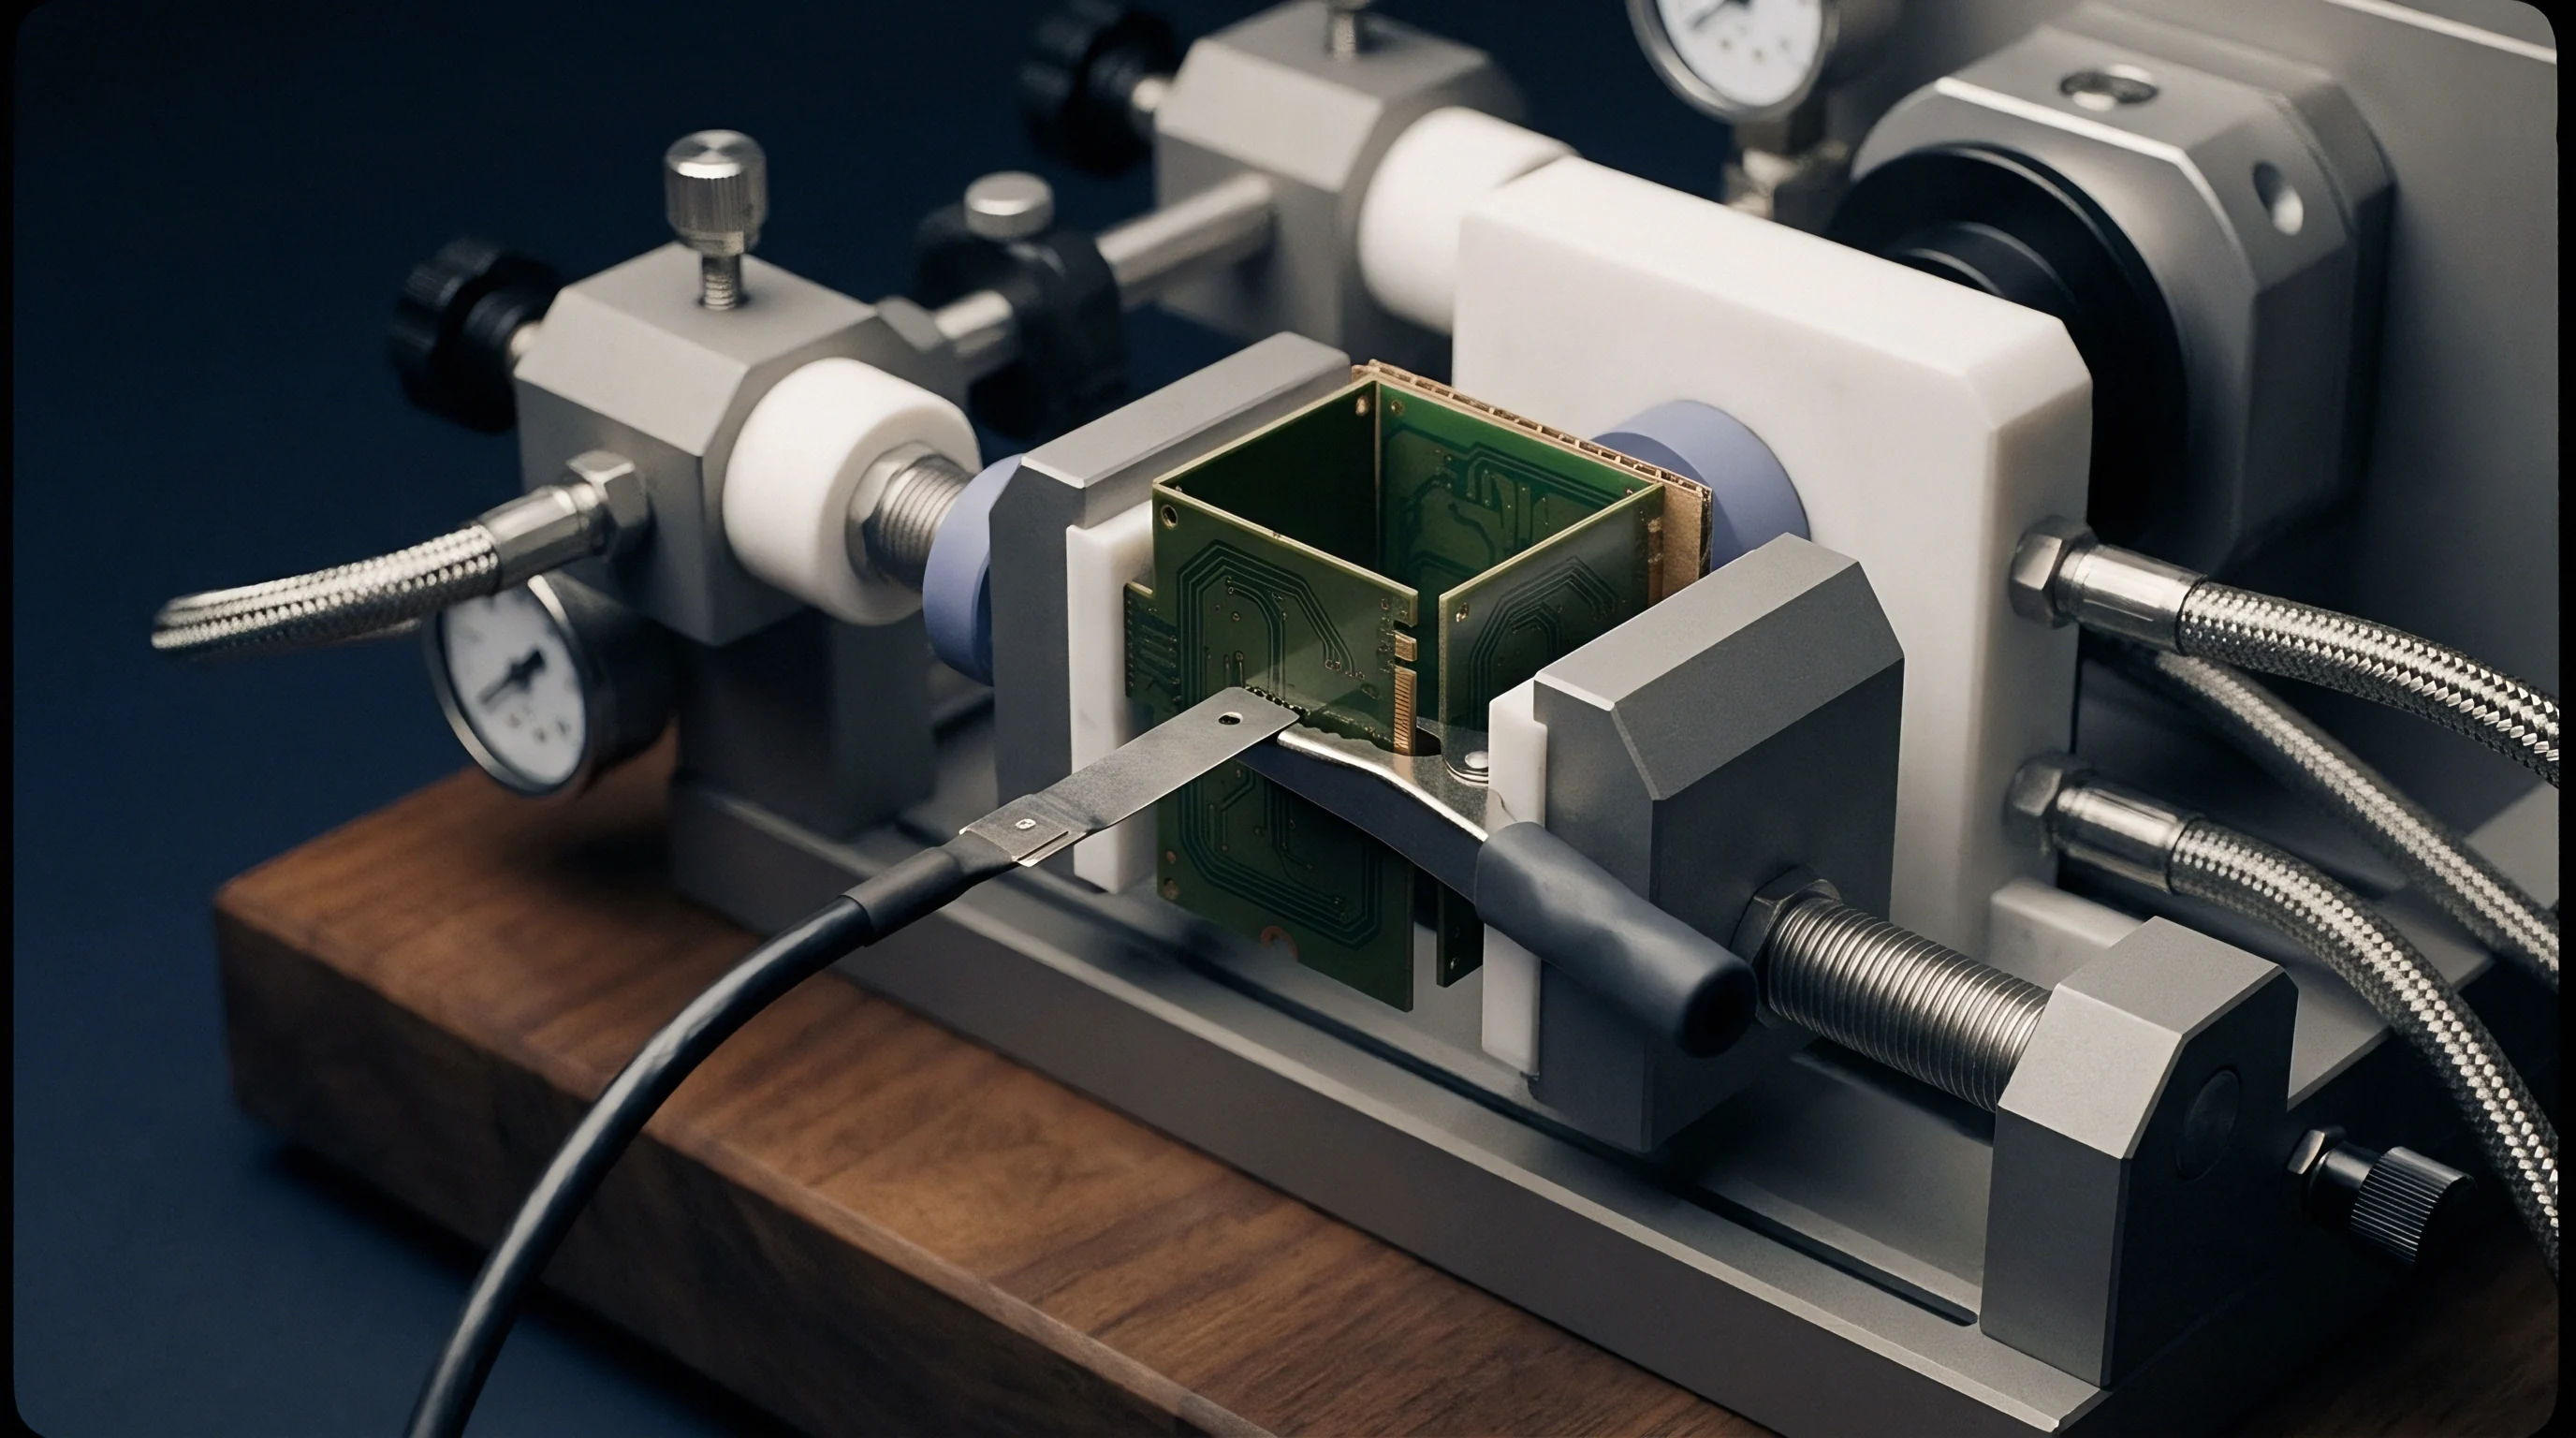
Over-the-air test software collects radiated frame error measurements at defined angular coordinates across the full sphere. Testing follows predefined angular step sizes, typically 15 degrees in both theta and phi axes, producing 266 discrete measurement points. At each coordinate, test equipment sweeps downlink power levels to locate the exact receiver power corresponding to a targeted throughput or frame error rate, typically a 1 percent frame error rate for LTE or a 0.1 percent bit error rate for sub-GHz legacy links.
Spatial sensitivity integration computes the total isotropic performance through a weighted spherical integral:
TIS = 4 PI / Integral_0_to_2PI Integral_0_to_PI
Where S(theta, phi) represents the measured radiated sensitivity at each spatial coordinate. Point sensitivity variations across the sphere reflect both antenna pattern directivity and localized electromagnetic interference radiating from board structures into specific spatial angles.
Spatial averaging across spherical sampling points hides localized antenna nulls unless test software cross-checks individual theta and phi cuts against raw bit error rate logs.
Accelerated Spatial Sampling Approximations
Fast testing algorithms estimate isotropic performance by sampling orthogonal cuts rather than measuring every discrete angle. Full 3D spherical measurements require up to four hours per channel, making comprehensive multi-band evaluation prohibitively slow during high-volume production testing. Rapid testing methods sample principal plane cuts, such as the XY, XZ, and YZ planes, or employ RSSI-assisted sensitivity estimation to project full spherical performance in minutes.
Fast RSSI algorithms sweep downlink power at each angle to record received signal indicators, applying full frame-error-rate searches only at selected reference coordinates to scale the relative spatial surface.
- Mount the fully enclosed device under test onto the dielectric mast inside the calibrated anechoic chamber.
- Establish a stable call box link on the target channel with the transmitter configured to maximum output power.
- Rotate the positioning system through fifteen-degree increments in both theta and phi axes across the full sphere.
- Record the effective radiated power and calculate receiver frame error rate at each spatial coordinate.
- Integrate the spatial sensitivity measurements using the spherical weighting formula to generate the final isotropic value.
Approximation methods reduce test time but introduce uncertainty when non-isotropic internal noise sources create localized desensitization nulls. Whether reduced sampling grids reliably capture narrow active desense lobes without missing severe spatial degradation remains a subject of ongoing dispute among test equipment manufacturers and carrier certification engineers.
Attenuator
Embedded firmware algorithms actively manage power amplifier output when thermal or SAR constraints force dynamic power back-off. Duty cycling reduces thermal load. Regulatory limits governing Specific Absorption Rate (SAR) and maximum permissible exposure mandate power reduction when devices operate near the human body.
Thermal throttling reduces link range. When firmware lowers transmit power to satisfy thermal or safety ceilings, active desensitization drops, artificially improving measured sensitivity during active back-off states. Verification requires testing under unattenuated maximum carrier power conditions.

Firmware Power Back off Control
Thermal protection routines reduce transmitter gain when internal temperature sensors detect unsafe operating conditions. During continuous multi-band transmission, power amplifier dissipation elevates PCB enclosure temperatures rapidly. Dynamic power back-off algorithms drop transmit power by 2 dB to 6 dB to prevent thermal shutdown.
This power reduction lowers broadband transmit noise spillover into the receive path, disguising active desense issues during thermal stabilization cycles.
Firmware power back-off implemented to pass thermal regulatory limits frequently drops uplink throughput in weak cell-edge coverage zones.
Documentation submitted for carrier qualification must prove that transmitter control mechanisms remain transparent during over-the-air testing:
- Power back-off trigger matrices define the exact temperature, channel, and carrier aggregation states that invoke transmitter throttling during continuous high-throughput bursts.
- Thermal hysteresis limits prevent rapid power cycling that disrupts carrier tracking loops during continuous transmit bursts under full thermal load.
- Conducted power compliance logs demonstrate that attenuated states maintain modulation accuracy and spectral mask boundaries across all operating voltage levels.
Engineers evaluating radio module options apply a simple test protocol: verify active desensitization limits only when power amplifiers radiate at absolute maximum rated power, ignoring compliance passes achieved through hidden firmware transmit attenuation.

Acceptance
Final approval files submitted to carrier labs demand complete spherical test logs and signed calibration certificates. Call drop rates spike at cell edges. Network operators review radiated sensitivity data across all supported channel combinations before issuing commercial network access approval.
Prototype re-spins delay market launch. Ensuring first-pass certification compliance requires rigorous verification of hardware samples across production component tolerance extremes.
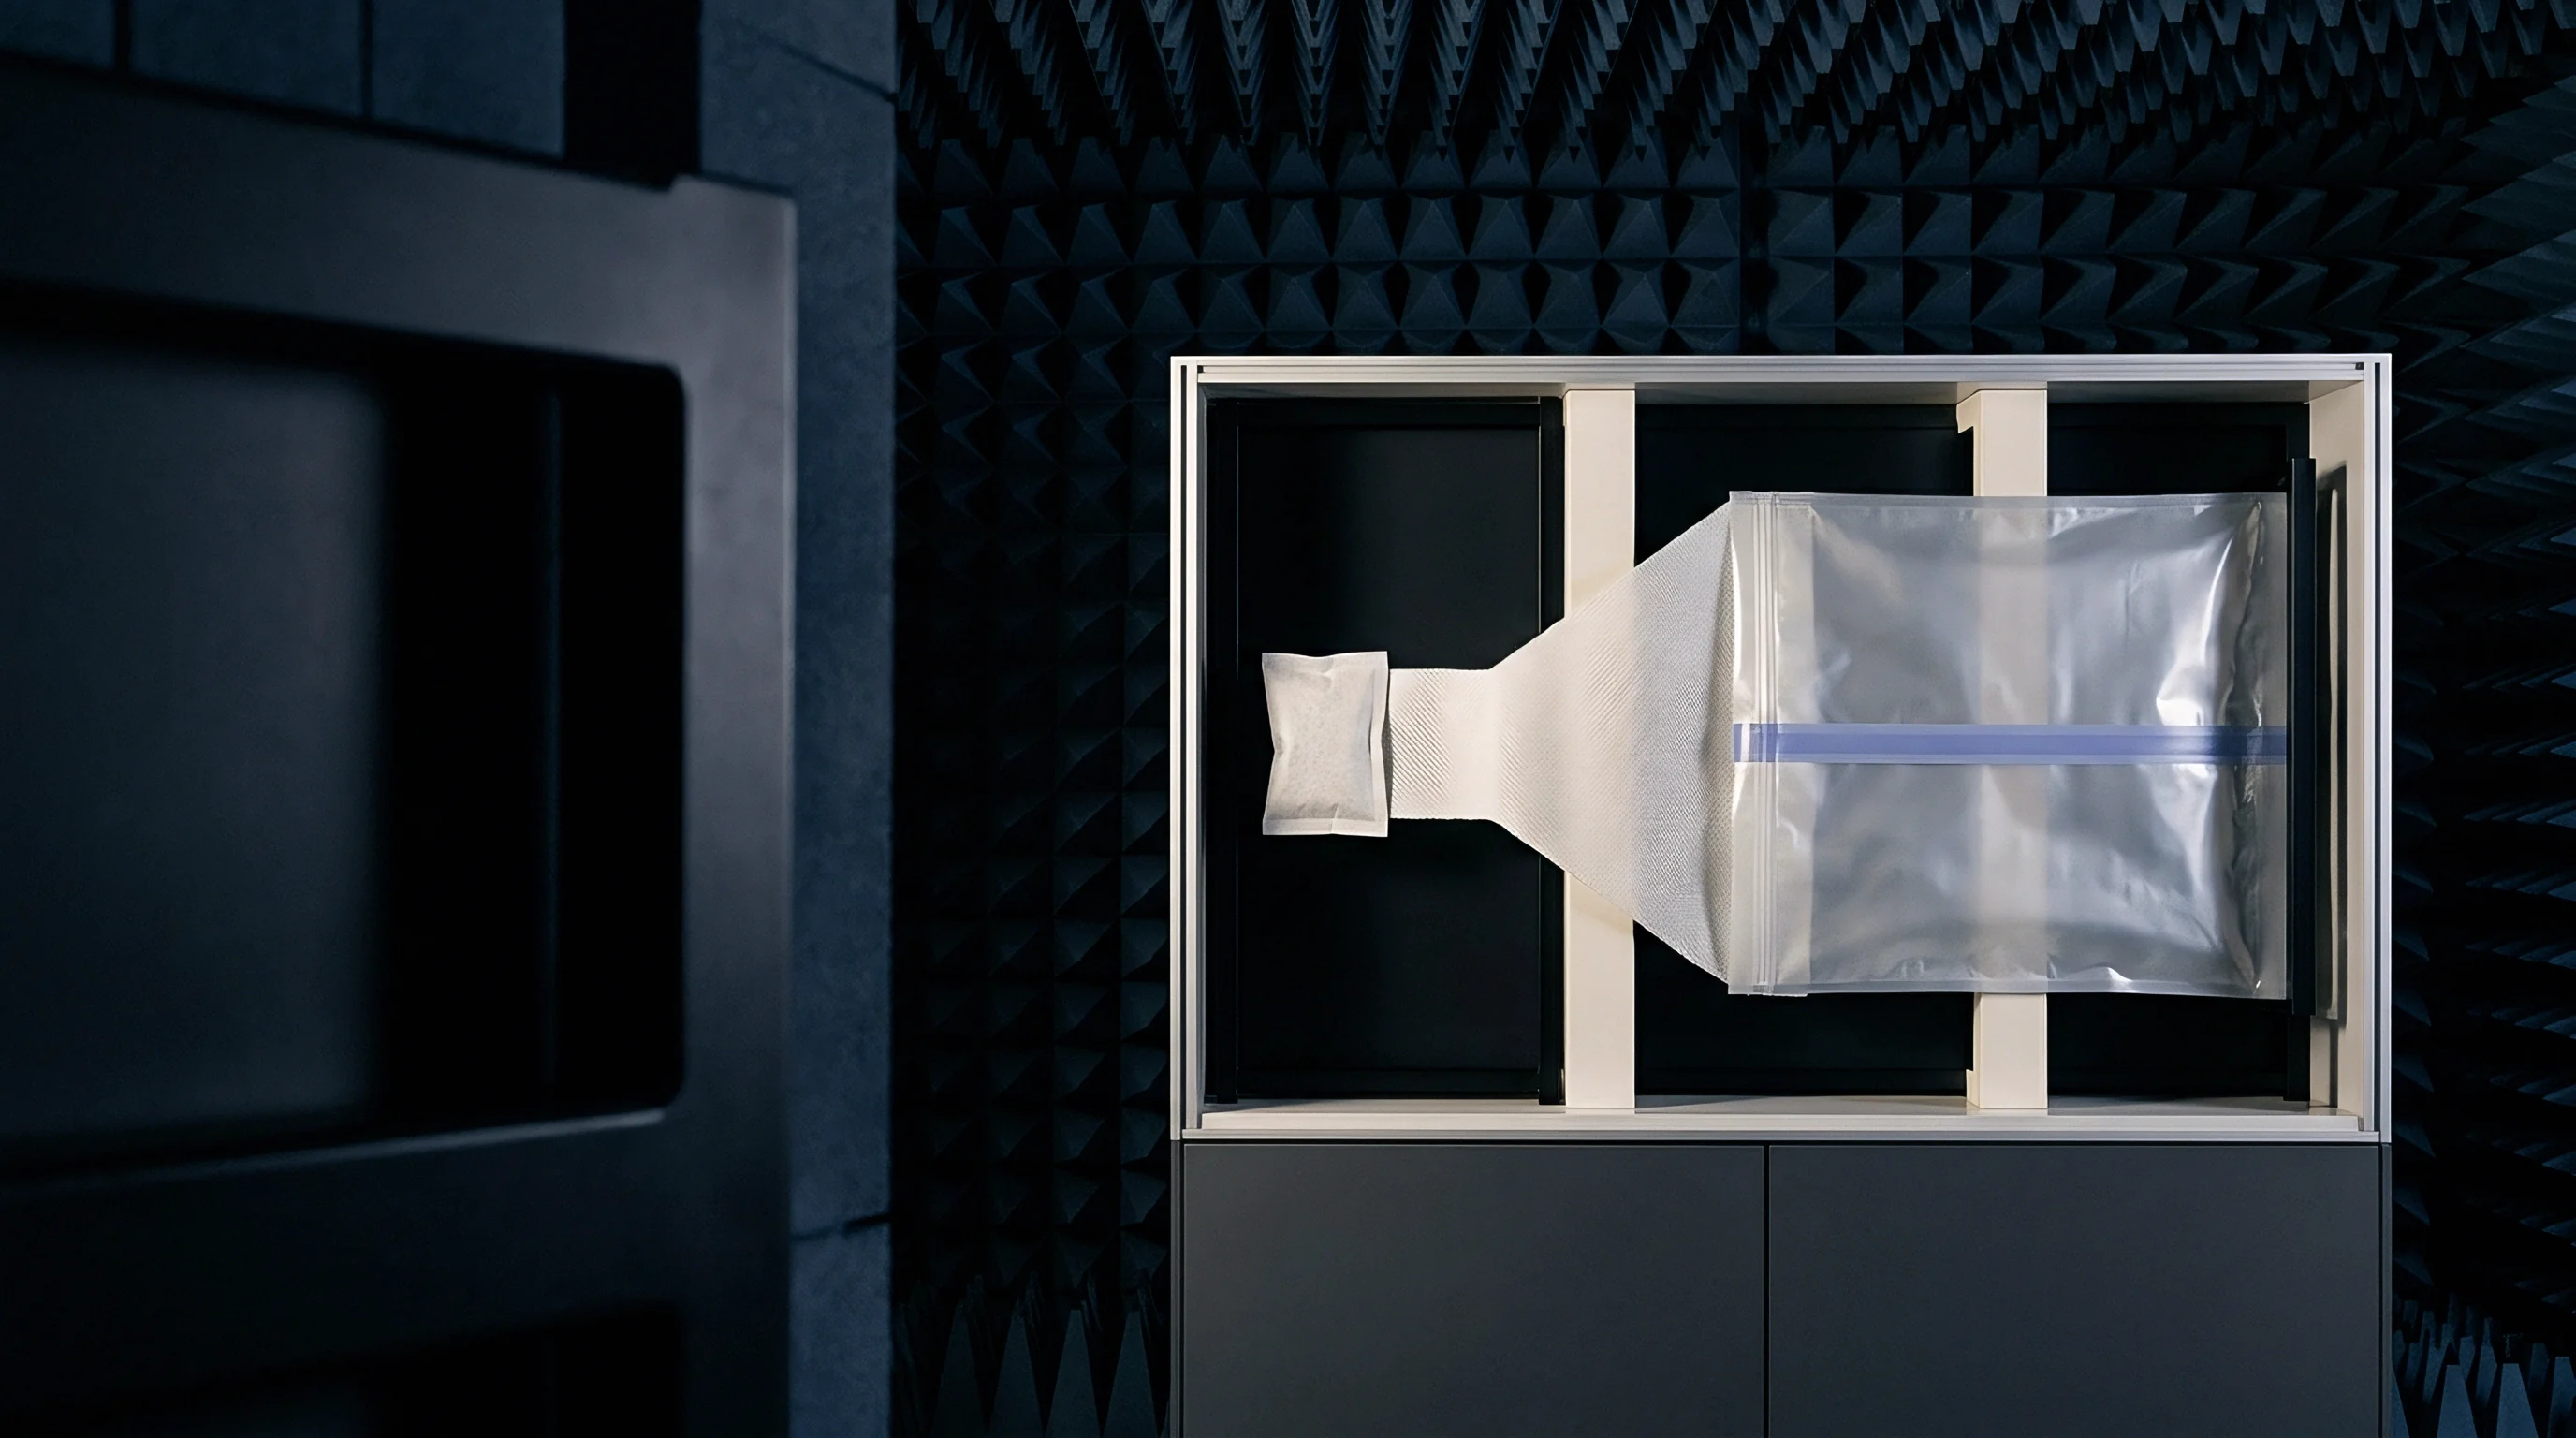
Production Qualification and Dossier Assembly
Tier-one operators inspect manufacturing yield data alongside chamber measurement files before authorizing network connection. Certification dossiers combine conductive noise floor sweeps, 3D spherical test logs, antenna efficiency plots, and operational desense analysis across all active channel combinations. Variance across silicon batches, ceramic substrate tolerances, and automated assembly placement can degrade active sensitivity by 1.5 dB to 3.0 dB in volume manufacturing.
Procurement teams specify guard bands inside supply contracts to ensure production units pass operator audits.
| Verification Parameter | Test Condition | Acceptance Threshold | Audit Variance Allowance |
|---|---|---|---|
| Free-Space TIS | Transmitter Off, Baseline | Standard Operator Limit | +/- 0.5 dB |
| Active Carrier TIS | Transmitter Max Power (+23 dBm) | Limit + Max Desense Allowance | +/- 0.7 dB |
| Harmonic Desense | TX High Band, RX Low Band | Maximum 1.5 dB Sensitivity Loss | +/- 0.5 dB |
| Thermal Stability TIS | 60 min Continuous TX Burst | Within 1.0 dB of Cold Baseline | +/- 0.8 dB |
| Spatial Pattern Ripple | 3D Spherical Peak-to-Null | Less than 18 dB Spherical Delta | +/- 1.0 dB |
Completing carrier qualification establishes that multi-band hardware maintains required receive sensitivity under full transmit load. Commercial supply agreements link volume order release schedules directly to carrier approval milestone sign-offs, protecting buyers from holding inventory that fails over-the-air compliance checks.