Sub-Terahertz Connector Surface Roughness and Skin Depth Effects
Sub-THz connector losses depend on conductor surface roughness exceeding the nanometer-scale skin depth, requiring sputtered smooth thin-film metallization.


Layer
At ultra-high frequencies, electrical current concentrates within an extremely narrow region near the outer boundary of a metallic conductor. As operating frequencies enter the sub-terahertz spectrum, spanning 100 GHz to 300 GHz, this penetration depth contracts to sub-micron dimensions. The skin depth calculation governs how tightly the electromagnetic field compresses into the surface skin of a coaxial connector center pin or waveguide launcher wall.
At 140 GHz, in the D-band allocation, the theoretical skin depth of pure copper shrinks to approximately 175 nanometers. Gold plating exhibits a skin depth of roughly 200 nanometers at the same frequency, while aluminum contracts to 220 nanometers. By the time signal transmission reaches 300 GHz, the skin depth of copper drops to 120 nanometers.
Standard radio frequency interconnect design historically treated metal surfaces as ideal smooth boundaries because surface roughness metrics sat well below operational skin depth at lower microwave frequencies.

Mechanics of Sub-Micron Current Redistribution
RF energy propagates through micro-coaxial interfaces primarily along the outer shell of the metallic plating. When physical dimensions of surface imperfections approach or exceed the electromagnetic skin depth, classical conduction assumptions collapse. Localized current distribution follows the exact contour of the surface profile rather than a straight path parallel to the propagation axis, extending the conduction path and increasing resistance per unit length.
Plating materials alter this current concentration through variations in electrical conductivity and magnetic permeability. Multi-layer plating stacks, such as electroless nickel immersion gold, introduce severe loss mechanisms: intermediate nickel barrier layers exhibit high magnetic permeability, which compresses skin depth within the nickel down to tens of nanometers while introducing significant magnetic dissipation. Signal energy penetrating through thin outer gold layers encounters this high-loss nickel zone, causing sharp increases in attenuation.

Frequency Thresholds across Metallic Conductors
Conductor attenuation scales with the square root of frequency under smooth surface conditions. Sub-terahertz operation accelerates loss rates as skin depth falls below the RMS roughness thresholds achievable through standard CNC turning. Precision micro-coaxial connectors operating at 110 GHz experience measurable loss amplification when surface finishes exceed 50 nanometers RMS.
| Frequency (GHz) | Copper Skin Depth (nm) | Gold Skin Depth (nm) | Theoretical Copper Attenuation (dB/mm) | Theoretical Gold Attenuation (dB/mm) |
|---|---|---|---|---|
| 100 | 207 | 236 | 0.082 | 0.094 |
| 140 | 175 | 200 | 0.097 | 0.111 |
| 220 | 139 | 159 | 0.122 | 0.139 |
| 300 | 120 | 136 | 0.142 | 0.162 |
Engineers continue to evaluate whether atomic layer deposition can yield uniform sub-hundred-nanometer metallic boundaries on micro-coaxial pin geometries without altering mechanical yield tolerances.


Ridge
Surface topography features created during lathe turning or CNC micro-machining introduce micro-peaks and valleys that disrupt smooth current propagation. At sub-millimeter wavelengths, these geometric irregularities act as physical obstacles to the tightly bound skin-depth currents traversing the connector boundary.
Standard surface texture characterization relies on average roughness metrics, primarily Ra and Rq, but high-frequency electromagnetic performance correlates poorly with single-parameter average roughness values. Two metallic interfaces displaying identical Ra figures can exhibit dramatically different attenuation profiles if their peak-to-valley spacing and spatial correlation lengths differ. Spatial correlation length determines the distance between adjacent peaks along the contact face.
Surface Roughness Metrics Relative to Penetration Scale
When peak spacing matches the order of magnitude of the skin depth, electromagnetic fields scatter across surface profiles. Micro-machined grooves parallel to current flow introduce minimal path lengthening, whereas transverse machining marks force current to travel up and down each profile wall. Transverse surface profiles on micro-coaxial inner conductors yield maximum attenuation increases.
At 140 GHz, an RMS surface roughness of 250 nanometers increases conductor attenuation by 42 percent compared to an ideal smooth surface across a 0.8 mm coaxial interface.
Quantifying surface profile effects demands full three-dimensional topographic extraction. Non-contact optical profilometry and atomic force microscopy measure localized slope distribution and spatial autocorrelation functions to feed electrodynamic loss models that predict real-world S-parameter degradation in D-band and H-band interconnects.
Breakdown Limits of Classical Loss Models
Early conductor loss calculations relied on the Hammerstad-Bebbington model, which applies a correction factor based on the ratio of RMS roughness to skin depth. The Hammerstad formulation assumes low-amplitude, periodic surface variations. At sub-terahertz frequencies, where roughness height routinely exceeds skin depth, the Hammerstad correction factor saturates prematurely, underestimating actual attenuation by up to 50 percent.
- Rayleigh factor overestimation assumes surface profiles are purely periodic sinusoids, causing significant divergence from physical measurements above 100 GHz.
- Hemispherical projection breakdown occurs when peak-to-valley heights exceed twice the skin depth, undercounting localized current concentration at sharp peak edges.
- Correlation length miscalculation ignores spatial frequency distribution, mistaking low-frequency surface waviness for skin-depth-scale profile features.
Micro-coaxial pin surfaces with peak-to-valley profile heights smaller than the conductor skin depth eliminate current path lengthening.
Scattering
Electromagnetic wave interactions with rough metallic boundaries produce localized field distortions and phase delays at sub-millimeter wavelengths. Numerical modeling of rough surfaces at sub-terahertz frequencies requires moving beyond simple path-lengthening approximations to account for local field scattering and inductive storage within surface cavities.
Advanced electrodynamic analysis uses modified Groisse, Huray snowball, and Gradient Index models to represent real surface profiles. The Huray model treats surface topography as an accumulation of spherical nodules deposited on a smooth plane, mapping accurately onto electro-deposited copper foils and plated connector surfaces to calculate loss based on nodule radius and distribution density rather than flat RMS statistics.
Mathematical Formulation of Electromagnetic Dissipation
The Gradient Index model approaches rough boundaries by treating the surface region as a transition layer with continuous effective conductivity and permeability gradients. Instead of assuming a sharp boundary between air and metal, the model divides the profile zone into thin parallel slices, calculating electrical properties for each slice from the ratio of metal to air within that specific height cross-section.
IEEE 287 clause 6.4 mandates that D-band precision coaxial connectors maintain a surface finish grade below 50 nanometers Ra to prevent phase distortion exceeding two degrees per millimeter.
Field calculations using the Gradient Index approach show that rough interfaces increase localized inductance alongside resistance. Phase velocity drops slightly as signal frequency rises, creating subtle chromatic dispersion along the connector interface that distorts complex modulation schemes such as 16-QAM and 64-QAM in wideband sub-terahertz communication channels.
Phase Distortion and Dispersion in Waveguide Interface Arrays
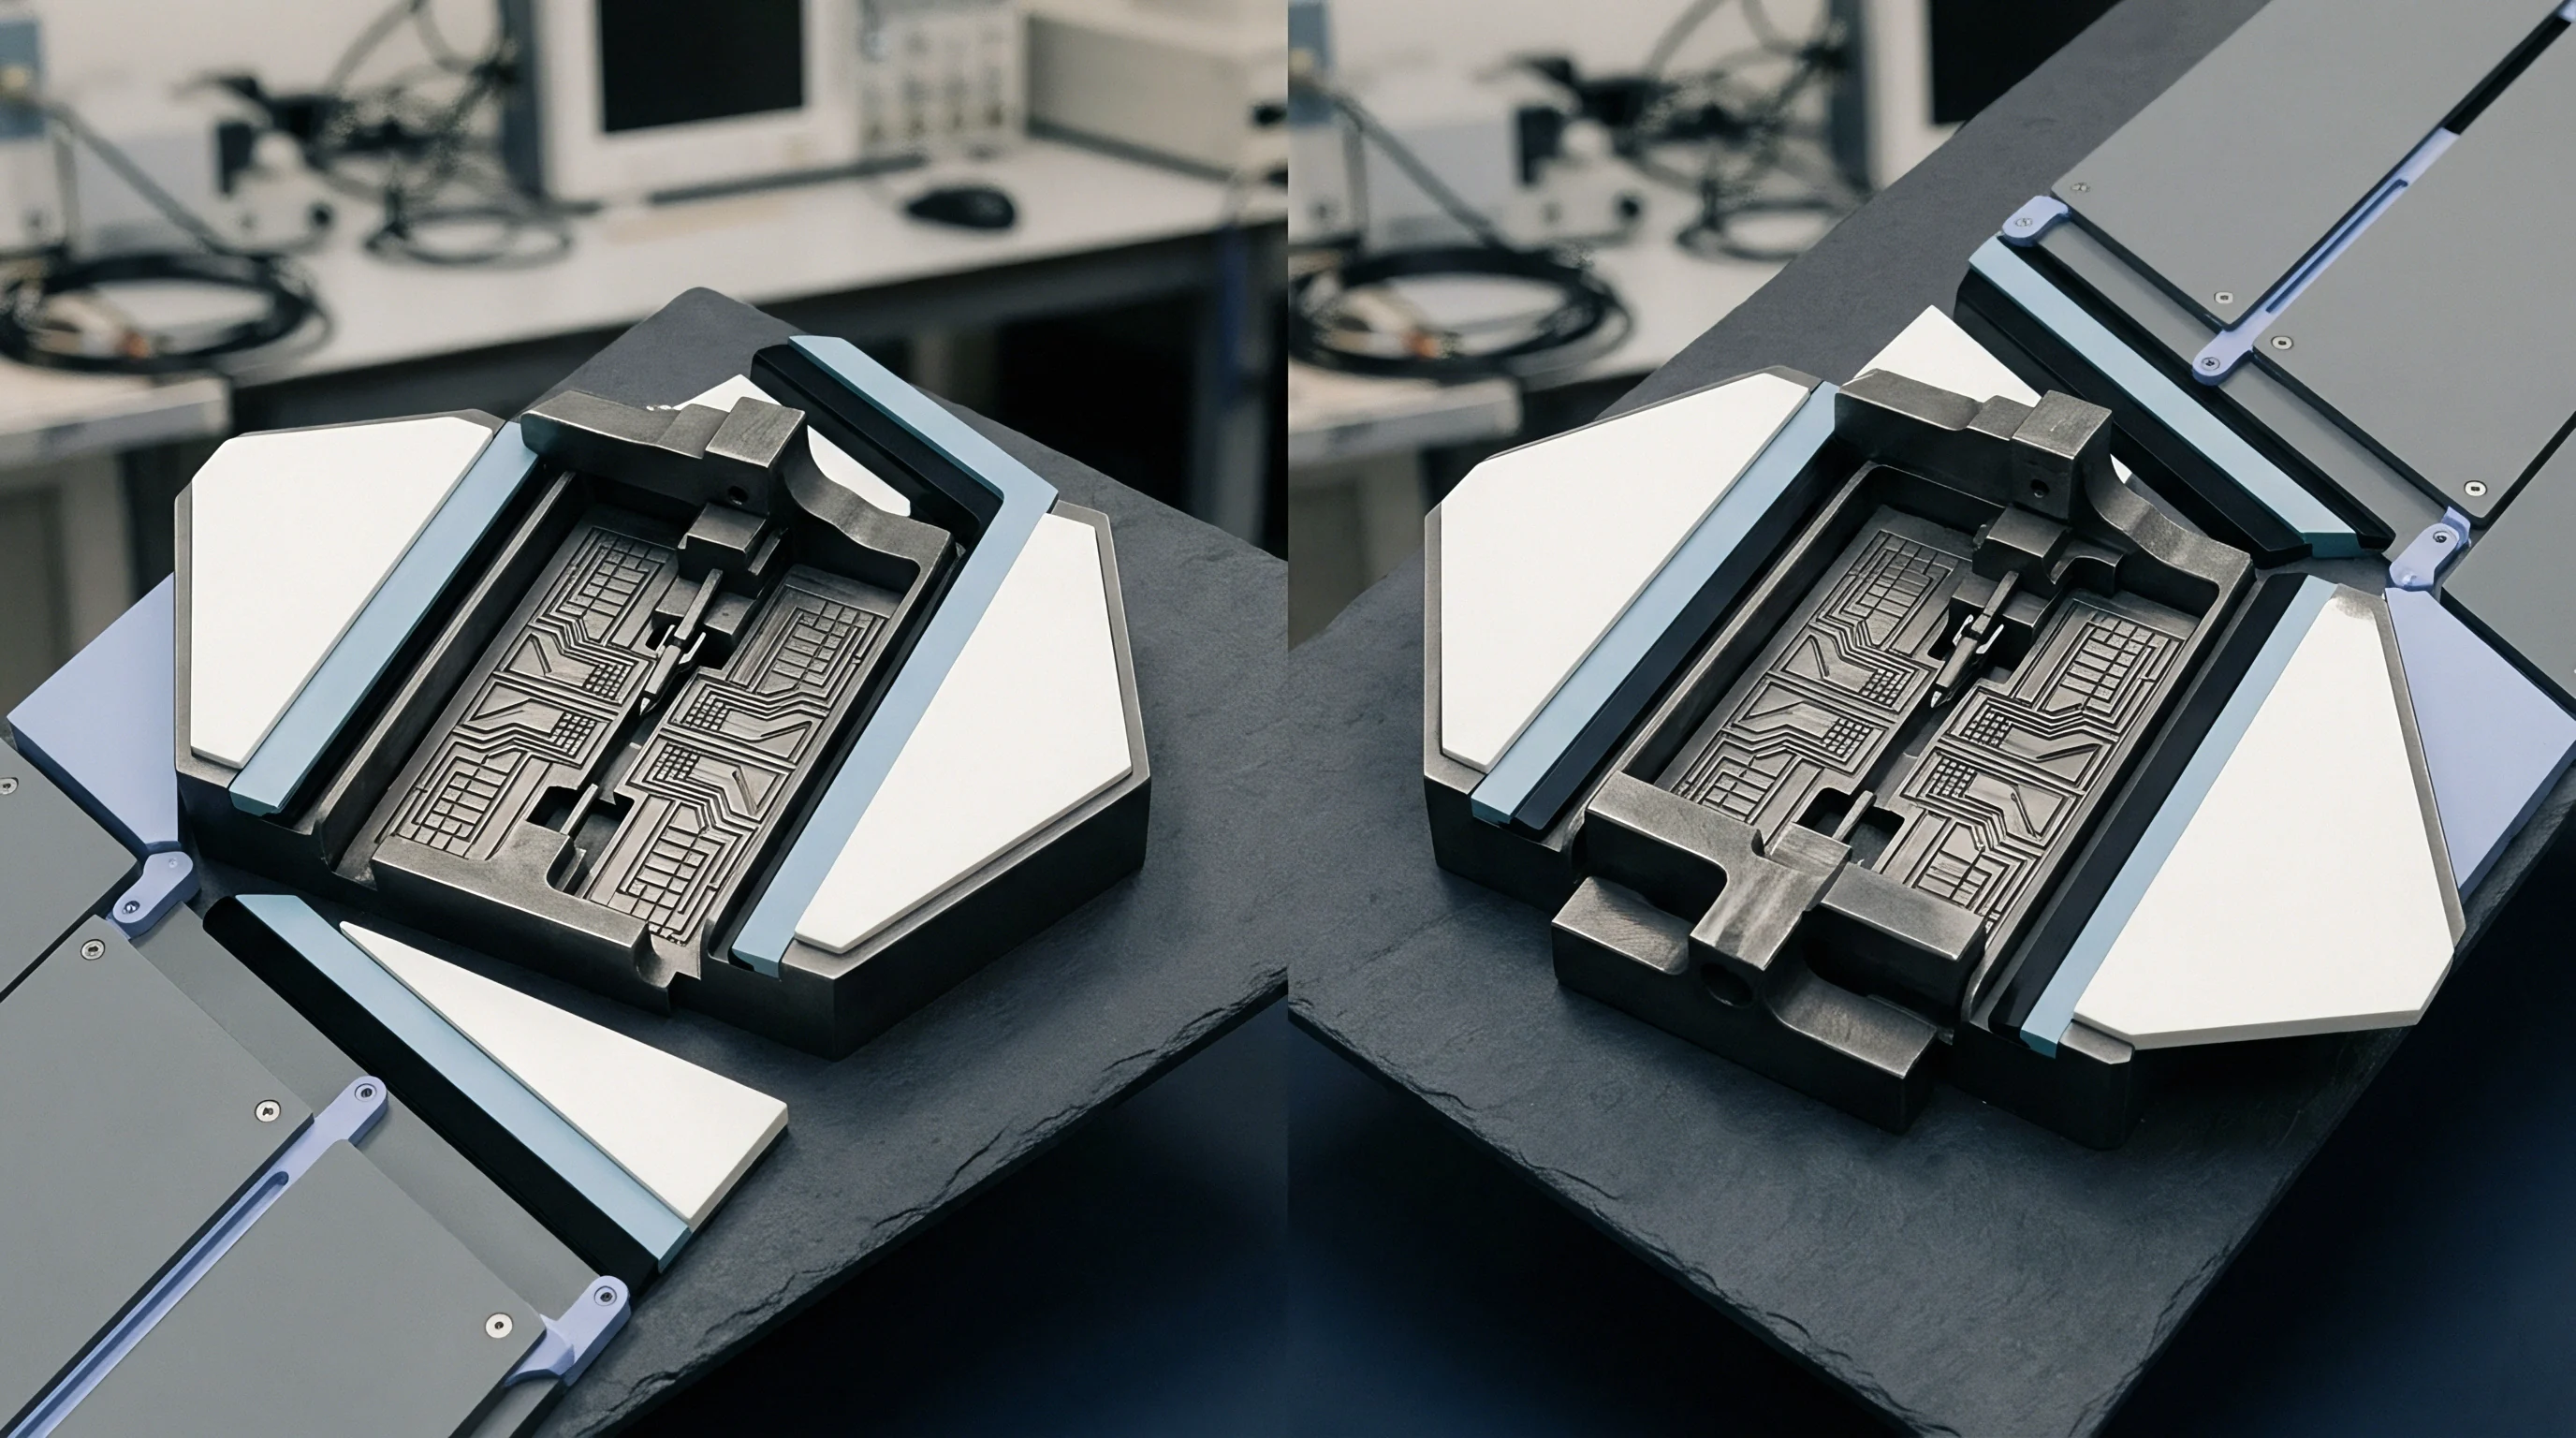
Waveguide interfaces operating in the G-band (140 to 220 GHz) and H-band (220 to 330 GHz) rely on physical flange contact to maintain continuous ground currents. Surface roughness at flange mating faces introduces micro-gaps that leak signal energy and generate phase shifts. Precision split-block waveguide launchers manufactured via micro-milling suffer performance degradation if cutter stepover marks create periodic grating patterns across internal channel walls.
| Frequency (GHz) | Measured Loss (dB) | Hammerstad Prediction (dB) | Huray Prediction (dB) | Gradient Index Prediction (dB) |
|---|---|---|---|---|
| 110 | 0.95 | 0.72 | 0.91 | 0.94 |
| 140 | 1.35 | 0.91 | 1.28 | 1.33 |
| 170 | 1.82 | 1.12 | 1.71 | 1.79 |
| 220 | 2.55 | 1.45 | 2.38 | 2.51 |
Specifying standard lathe finishes on sub-terahertz launcher interfaces introduces unmodeled attenuation that degrades system receiver sensitivity below operational link thresholds.
Tolerance
Fabrication of sub-millimeter interconnects demands precision machining alongside carefully controlled plating stackups. Standard turned components off high-speed screw machines routinely exhibit surface roughness Ra values between 200 and 400 nanometers. Matching skin-depth requirements at 220 GHz mandates surface finishes under 30 nanometers Ra, forcing manufacturers to adopt specialized finishing processes.
Electropolishing and chemical-mechanical planarization smooth out micro-asperities post-machining. Electropolishing preferentially dissolves sharp peaks on metal surfaces, rounding off profile ridges and expanding correlation lengths. Plating processes applied over these polished substrate metals must maintain absolute thickness uniformity to prevent re-introducing surface roughness.
Metallurgical Deposition Methods and Interdiffusion Limits
Electroless nickel immersion gold (ENIG) plating processes present severe RF loss risks above 100 GHz. The nickel layer acts as a diffusion barrier between copper substrate and outer gold plating, but its poor conductivity and ferromagnetic properties absorb RF energy whenever outer gold plating thickness falls below four skin depths.
Vacuum sputtering of gold directly onto clean copper substrates ~ often over a sputtered titanium layer to improve adhesion ~ eliminates intermediate magnetic barriers entirely. Sputtered thin-film gold layers exhibit tight thickness control, dense grain structure, and surface roughness profiles that duplicate the underlying polished substrate with nanometer fidelity.
Do Precision Machining Limits Constrain Connector Yields?
Manufacturing 0.8 mm and 0.5 mm coaxial connector assemblies pushes mechanical machining limits. Center conductor pin diameters measure less than 350 microns, rendering them highly susceptible to mechanical bending during polishing. Tightening manufacturing tolerances to meet sub-terahertz skin depth criteria directly impacts fabrication yields and unit pricing.
Direct thin-film sputtering of gold over a non-magnetic titanium seed layer prevents current penetration into high-loss ferromagnetic barriers.
- Clean the micro-coaxial contact pins in an ultrasonic solvent bath for five minutes.
- Scan the contact surface profile using a non-contact optical profilometer over a 100-micron by 100-micron area.
- Calculate the root-mean-square roughness and spatial correlation length from the digitized surface matrix.
- Measure insertion loss across the 110 GHz to 170 GHz band using a vector network analyzer equipped with frequency extenders.
- Verify that measured conductor attenuation falls within 0.3 dB of predicted gradient-index loss values.
Excess insertion loss at 140 GHz stems from test cable bending rather than nickel barrier diffusion through thin outer gold plating.
Qualification
Verification of sub-terahertz connector loss parameters demands vector network analyzers equipped with mm-wave frequency extension modules and precise calibration artifacts. Calibration methods such as Thru-Reflect-Line (TRL) move the measurement reference plane directly to the connector interface, stripping out test fixture loss and phase offset. Standard Short-Open-Load-Thru (SOLT) routines fail at D-band and H-band frequencies due to phase uncertainties in physical open and short standards.
High-precision mechanical alignment fixtures maintain axial center-pin concentricity during measurement sweeps to isolate surface finish losses from mechanical misalignments.
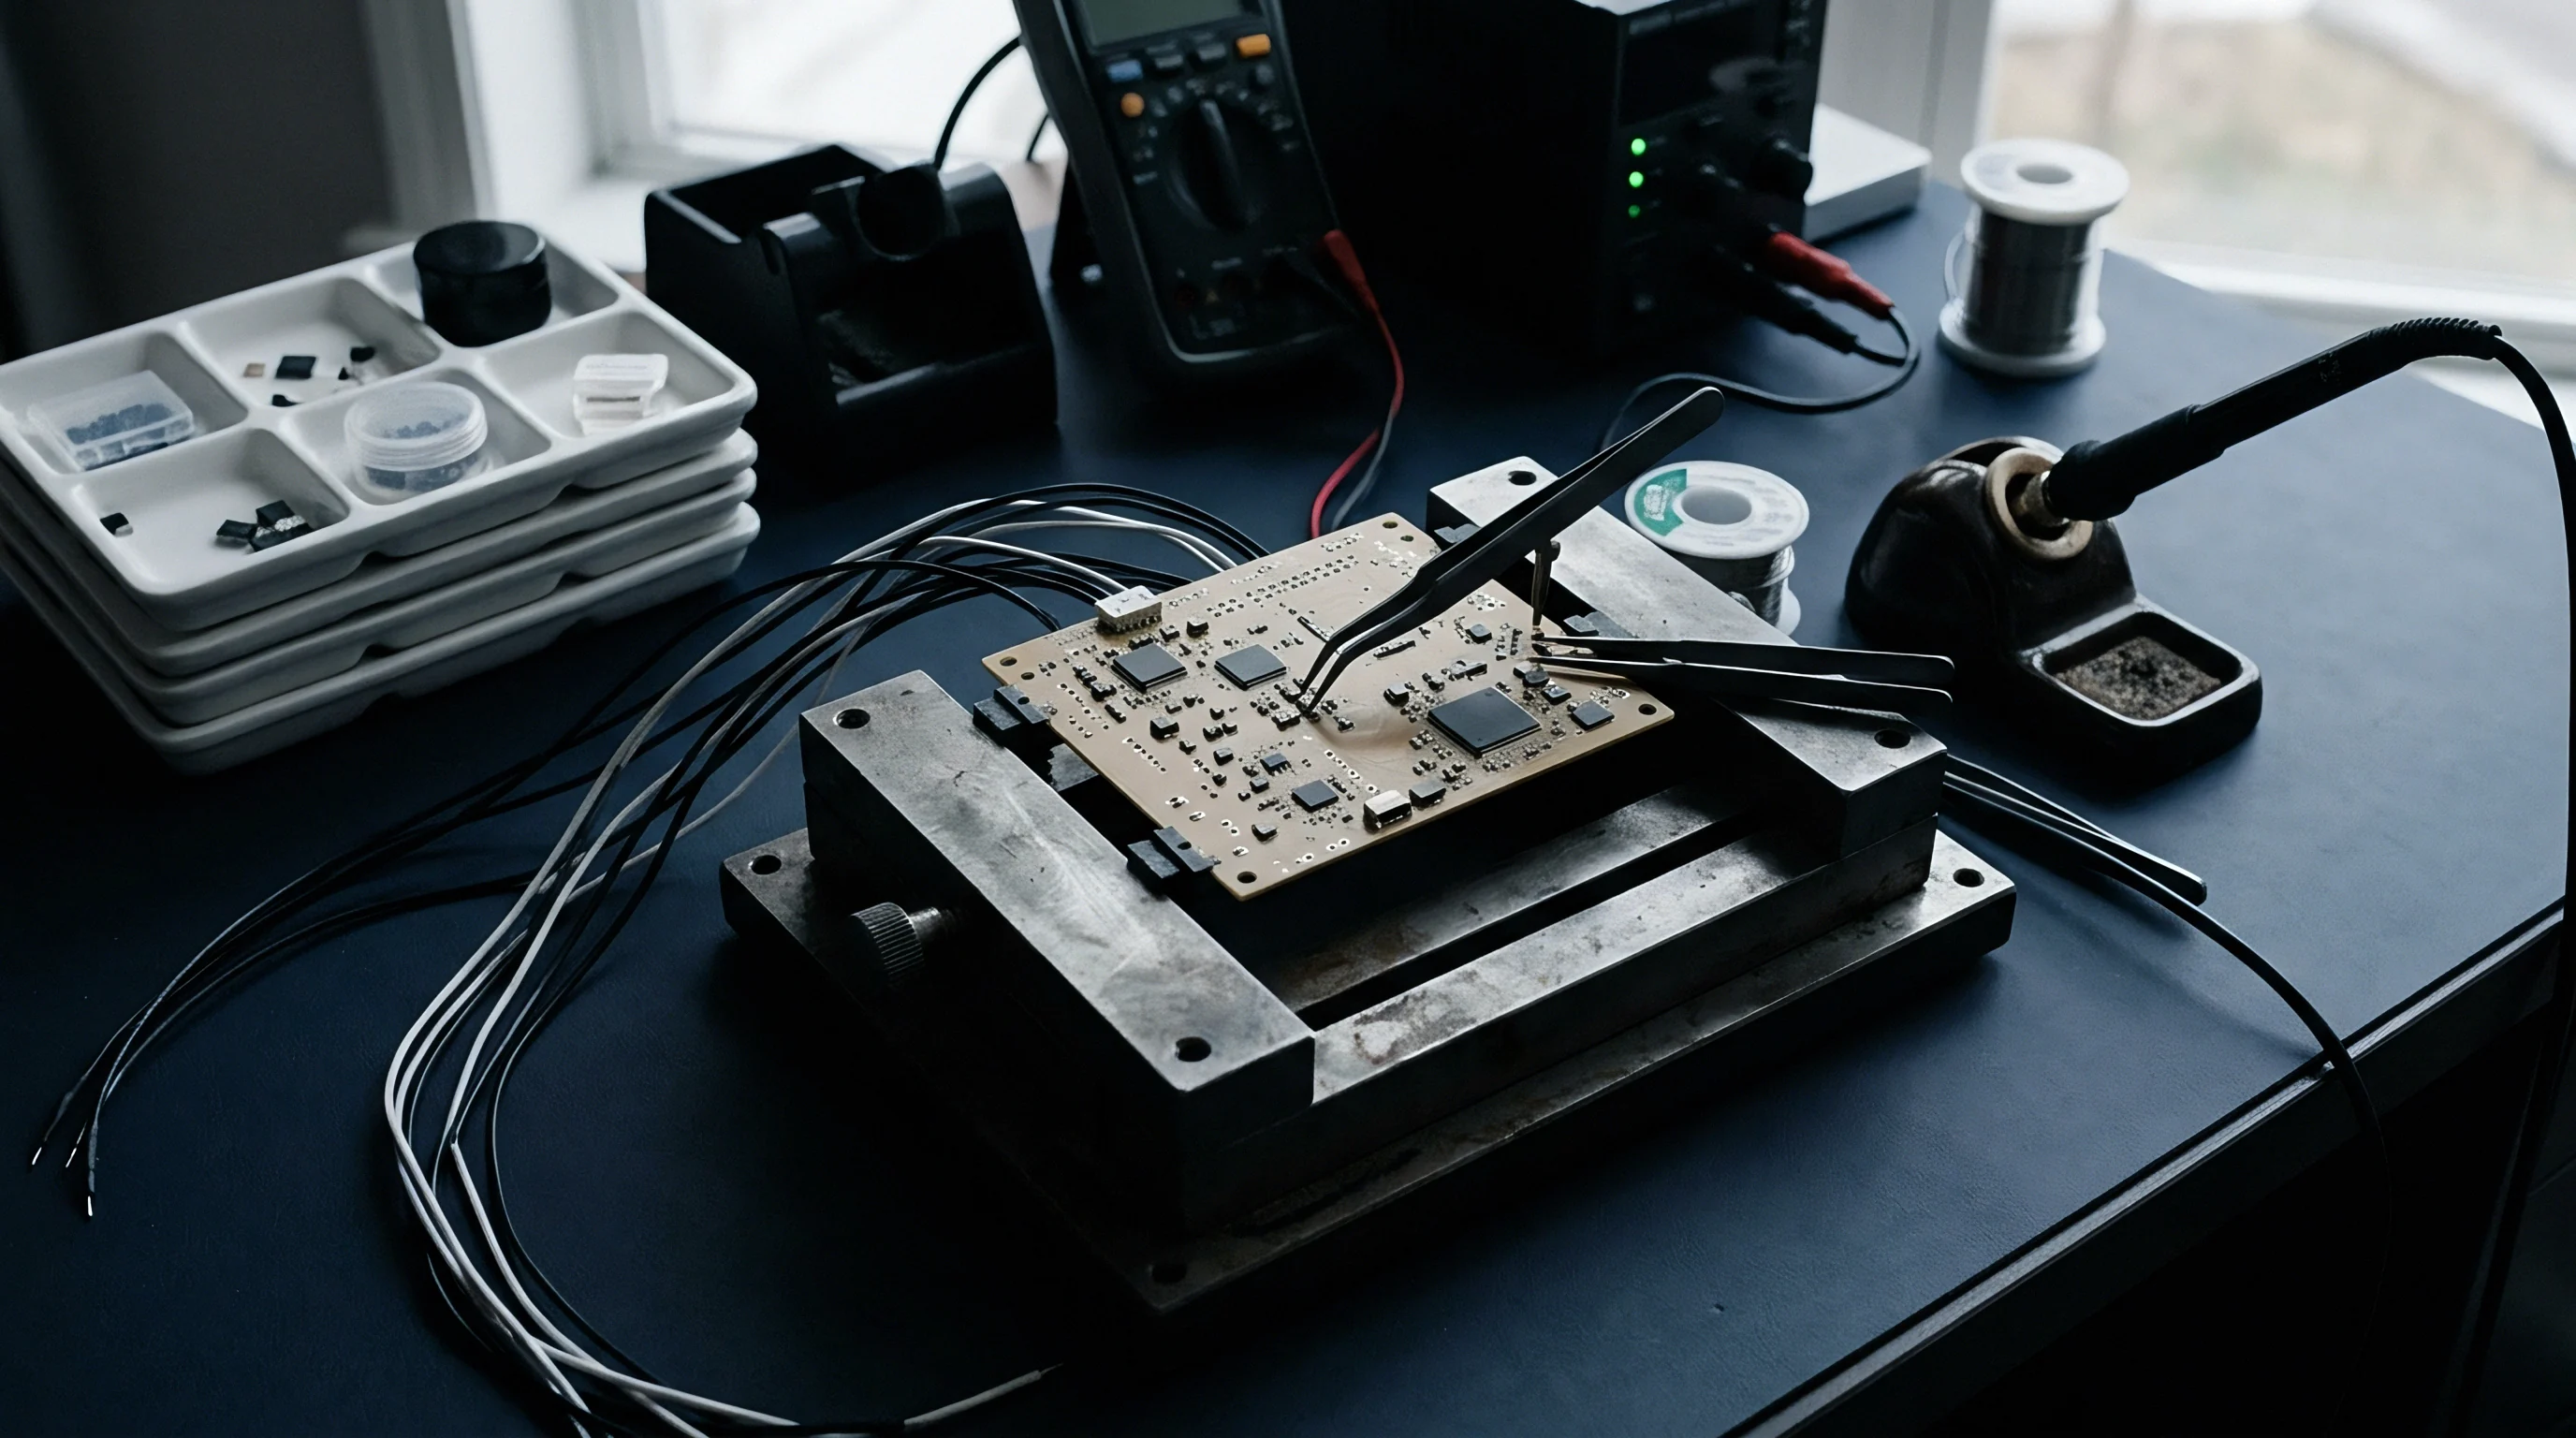
Vector Network Analyzer Calibration for Sub-Millimeter Assemblies
TRL calibration standards manufactured on quartz or alumina substrates supply precise impedance references up to 300 GHz. Calibrating mm-wave extenders requires monitoring raw uncorrected directivity and port match metrics. Thermal drift in extender heads introduces phase errors within minutes, necessitating frequent re-calibration during surface quality verification runs.
Five hundred mating cycles on a 0.8 mm micro-coaxial connector increase surface RMS roughness from 35 nanometers to 180 nanometers, causing a 1.8 dB attenuation rise at 220 GHz.
Mechanical wear during repeated mating cycles damages smooth plated surfaces: inner conductor sockets generate friction against pin surfaces, gouging micro-tracks into soft gold plating. These mechanical abrasion lines increase surface RMS roughness, causing insertion loss to degrade systematically over operational lifetimes.

Thermal Cycling Effects on Plated Contact Interfaces
Temperature fluctuations accelerate intermetallic diffusion between plating layers. Gold and copper atoms interdiffuse at elevated temperatures, forming brittle copper-gold intermetallic compounds at the boundary layer. These compounds possess lower electrical conductivity than pure gold or copper, creating an embedded high-resistance sub-surface zone right where skin-depth currents flow.
- Profilometer spatial sampling resolution maintains sub-20-nanometer steps to capture micro-peak density accurately across the contact surface.
- Plating stackup documentation specifies pure gold sputtered directly onto copper or brass, excluding magnetic nickel intermediate layers.
- Mating torque specifications enforce calibrated torque wrenches to prevent surface galling and micro-fracturing during engagement.
- Vector analyzer calibration dossier records TRL standard measurements immediately prior to testing connector insertion loss.
| Interface Type | Initial RMS Roughness (nm) | RMS Roughness at 500 Cycles (nm) | Initial Loss at 220 GHz (dB) | Loss at 500 Cycles at 220 GHz (dB) |
|---|---|---|---|---|
| 0.8 mm Coaxial (Sputtered Au) | 35 | 180 | 0.45 | 2.25 |
| 0.8 mm Coaxial (ENIG Plated) | 65 | 310 | 1.15 | 3.80 |
| WR-05 Flange (Direct Polish) | 20 | 45 | 0.12 | 0.28 |
| WR-05 Flange (Standard Mill) | 120 | 240 | 0.68 | 1.35 |
MIL-PRF-39012 addendum sub-THz supplement line item 4.2 alters acceptance criteria by mandating optical profilometry lot audits whenever batch insertion loss drifts by more than 0.5 dB at 170 GHz.