Managing Multi-Market Radio Frequency Exposure Filings for Handheld Transceivers
Handheld exposure filings demand unified 1g and 10g spatial SAR test plans, tight proximity sensor power backoff logic, and deterministic firmware controls.

Dosimetry
Holding a transmitter two centimeters from an engineer’s cheek creates a near-field interaction that breaks standard far-field planar wave assumptions. Energy in the reactive near-field region does not propagate as a clean transverse electromagnetic wave. Instead, inductive and capacitive reactive coupling dominate the interaction between the antenna and nearby biological tissue.
Physical antenna dimensions, internal ground plane geometries, and battery chassis placement dictate the shape and intensity of these localized fields. Electric field strength drops off quickly with distance, but close proximity to human tissue places a heavy reactive load on the radiator, shifting the antenna’s resonant frequency and altering the input impedance matched at the power amplifier stage.
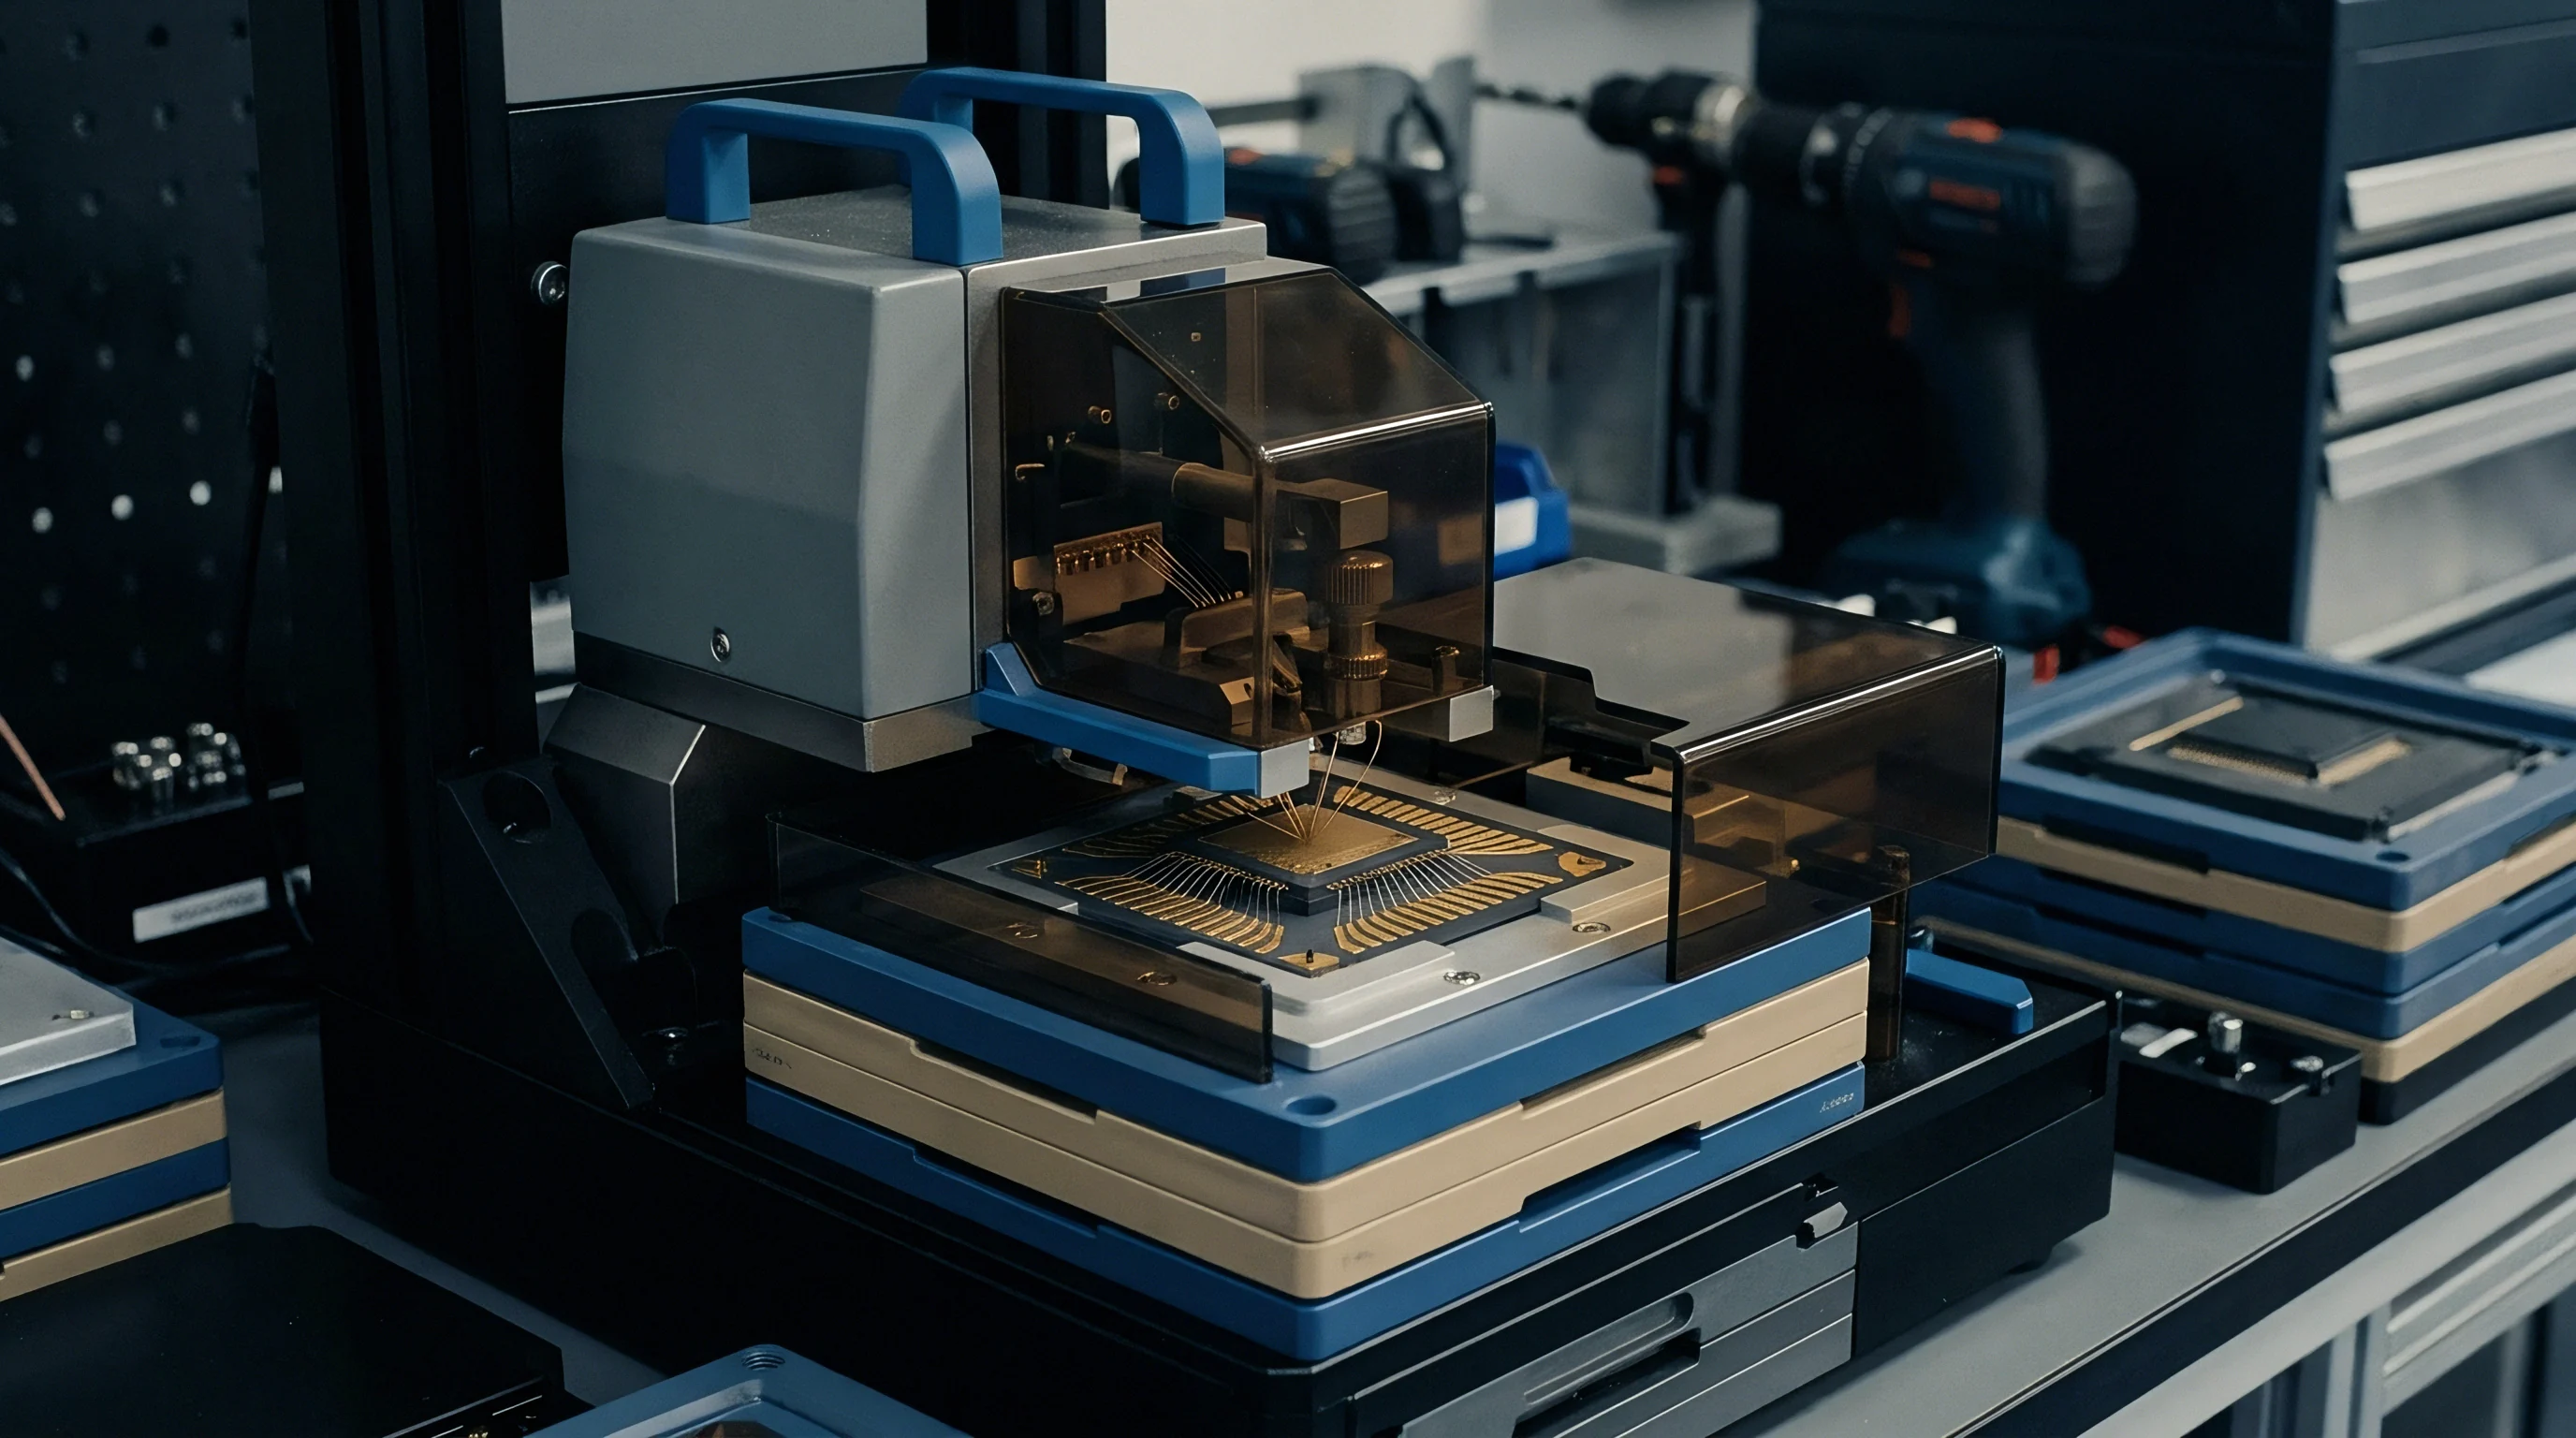
Measuring energy absorption inside tissue requires mapping deposition patterns with high spatial precision. Specific Absorption Rate quantifies the mass-normalized rate of energy absorbed by body tissue exposed to a radio frequency field, expressed in watts per kilogram. Evaluating handheld transceivers operating between 30 MHz and 6 GHz relies on measuring internal electric field vectors inside liquid phantoms, using miniature isotropic probes mounted to robotic arms.
The probe moves along an automated grid to localize spatial peak SAR values within specified tissue masses ~ typically standardized to 1-gram or 10-gram cubic volumes depending on the jurisdiction. Cross-lab calibration checks show a 1.4 dB variance when probe scan offsets are misaligned by less than one millimeter from the internal phantom surface.

Near Field Electromagnetic Coupling Mechanisms
Reactive near-field conditions create localized field gradients where electric and magnetic energy densities peak independently. When a transceiver operates against the ear or body, tissue acts as a lossy dielectric material that absorbs energy while detuning the antenna structure. This detuning forces the transmitter’s final stage off its optimum load line, altering conducted power output and harmonic generation.
Antenna geometries tuned for free-space efficiency often create localized absorption peaks near sharp chassis edges, ground cutouts on the printed circuit board, and flexible flat cables routed around the battery enclosure.
Current distribution along the chassis creates secondary radiation centers distinct from the primary antenna element. Low-frequency devices in the VHF and UHF bands use the metallic body of the radio as a substantial part of the radiating structure, spreading energy deposition over broader physical areas than high-frequency microwave transceivers do. At higher frequencies, such as the 2.4 GHz and 5 GHz bands, energy absorption concentrates into localized superficial tissue volumes directly adjacent to miniature surface-mount patch or inverted-F antenna elements.
Field gradients inside liquid tissue phantoms steepen rapidly when antenna elements sit within ten millimeters of the synthetic shell.

Tissue Medium Dielectric Parameters across Frequencies
Liquid tissue-equivalent mixtures simulate the electrical characteristics of head and body tissue across target operational bands. These dielectric properties dictate how radio frequency energy propagates, refracts, and dissipates inside the phantom container. Relative permittivity and electrical conductivity are the primary parameters defining synthetic tissue formulations: relative permittivity governs wave phase velocity and wavelength within the liquid, while electrical conductivity dictates attenuation rates and volumetric thermal dissipation.
International measurement standards require liquid parameters to remain within tight tolerances, typically within plus or minus five percent of target values. Lower-frequency formulations rely heavily on water, salt, and cellulose, while UHF and microwave targets use diethylene glycol butyl ether or non-ionic surfactant bases. Because the physical properties of these liquids shift with temperature and age, laboratories must record precise measurements prior to formal SAR evaluation sweeps.
| Frequency (MHz) | Head Permittivity | Head Conductivity (S/m) | Body Permittivity | Body Conductivity (S/m) | Target Mass (g) |
|---|---|---|---|---|---|
| 150 | 52.3 | 0.76 | 61.9 | 0.80 | 10 |
| 450 | 43.5 | 0.87 | 56.7 | 0.94 | 10 |
| 835 | 41.5 | 0.90 | 55.2 | 0.97 | 1 |
| 1900 | 40.0 | 1.40 | 53.3 | 1.52 | 1 |
| 2450 | 39.2 | 1.80 | 52.7 | 1.95 | 1 |
| 5800 | 35.3 | 5.27 | 48.2 | 6.00 | 1 |
| Data parameters synthesized from IEC/IEEE 62209-1528 baseline targets. Standard laboratory test temperature set to 22.0 degrees Celsius. | |||||

Absorbing Power Density Transitions beyond Six Gigahertz
Expanding operations above 6 GHz changes how electromagnetic energy interacts with tissue. Penetration depth drops off rapidly due to high water absorption coefficients in the upper dermis. Instead of volumetric absorption throughout deeper anatomical structures, energy deposition shifts to superficial surface heating in the outer epidermal layer.
As a result, measuring localized Specific Absorption Rate becomes impractical ~ severe field attenuation occurs over sub-millimeter spatial increments inside liquid phantoms.
Above 6 GHz, regulatory frameworks replace Specific Absorption Rate with Absorbed Power Density and Incident Power Density metrics. Absorbed Power Density calculates energy entering a defined surface area, expressed in watts per square meter. Testing moves away from volumetric liquid probe scans toward planar Poynting vector reconstruction and free-space E- and H-field vector scanning using optical millimeter-wave sensors.
Evaluating spatial peak power density requires averaging across designated areas, typically 1 square centimeter or 4 square centimeters depending on regional filing requirements.
Small handheld transceivers with Wi-Fi 6E, Wi-Fi 7, or millimeter-wave 5G radios must satisfy dual exposure regimes when operating across band boundaries. Devices radiating simultaneously below and above 6 GHz require unified exposure evaluation schemes. Test reports must present normalized summation ratios combining peak 1-gram SAR with peak absorbed power density values.
Failing to account for the spatial superposition of near-field energy spikes across different radiator elements leads directly to non-compliant filings and regulatory rejections.
- Phantom Liquid Evaporation alters ionic concentration, driving electrical conductivity outside the allowable five-percent tolerance window during extended full-power multi-band scans.
- Robot Arm Mechanical Backlash introduces positioning errors during boundary-layer probe sweeps, distorting spatial extrapolation curves near the internal phantom surface.
- Probe Dipole Sensor Anisotropy causes angular response variations when scanning non-polarized localized field vectors generated by complex internal antenna arrays.
- Ground Plane RF Coupling through external audio cables or battery charging harnesses skews localized current distribution, producing artificial hot spots away from the primary radiator.
Applying inaccurate spatial peak SAR extrapolation models to steep near-field gradients causes lab reports to underestimate peak energy deposition. If an uncalibrated boundary correction factor fails to resolve rapid field decays, the calculated 1-gram mass peak underreports true absorption. Audit re-testing of non-compliant devices inside accredited surveillance chambers can trigger immediate sales suspensions, product recalls, and administrative penalties.
Tissue
Physically simulating human anatomy requires rigid, non-reflective liquid containers paired with stabilized chemical solutions. Liquid phantoms must mimic the dielectric properties of head, torso, and limb tissue while allowing uninhibited movement of robotic measurement probes. Phantom shell materials require structural uniformity, as wall thickness variations exceed allowable margins whenever manufacturing tolerances introduce dielectric discontinuities or localized mechanical deflections under fluid weight.
Shell thickness sets the distance separating the transceiver housing from the internal liquid medium. Standardized anthropomorphic mannequins mandate a uniform shell thickness of two millimeters, accurate to within plus or minus 0.2 millimeters across designated measurement zones. If shell thickness drops below regulatory limits, internal electric field measurements read artificially high.
Conversely, overly thick phantom walls attenuate near-field reactive coupling, masking localized peak absorption and yielding falsely optimistic test results that fail market compliance audits.

Liquid Formulation Stability and Temperature Coefficients
The chemical composition of synthetic tissue liquid changes over time through evaporation and environmental absorption. Water-soluble sugar-salt formulations degrade quickly, shifting dielectric conductivity during standard multi-channel measurement sequences. Modern test facilities use broad-band tissue-equivalent liquids containing non-ionic surfactants, polyoxyethylene compounds, and anti-microbial agents.
These formulations stabilize permittivity and conductivity across wide frequency spans, avoiding fluid drains and refills when switching between cellular and Wi-Fi evaluations.
Temperature fluctuations shift dielectric parameters inside synthetic liquids. Conductivity increases linearly with temperature, rising by up to two percent per degree Celsius. Standardized test procedures dictate strict climate control inside the chamber facility, requiring fluid temperature to remain within a two-degree Celsius window throughout validation sweeps and formal exposure testing.
Thermal gradients inside the phantom container induce localized convection currents, distorting field distribution patterns during long spatial scans.
Compliance declarations based on fluid parameter measurements taken outside the eighteen to twenty-two degree Celsius window trigger immediate audit rejections under EN 62209-1528 clause 6.1.2.
Mechanical Shell Tolerances in Specific Anthropomorphic Mannequins
Standardized anthropomorphic mannequin designs model the human head using adult male anatomical databases. Mannequin geometries feature reference points defining the ear canal, cheek reference plane, and tilt angles for handheld telephone transceivers. Phantom shells are molded from low-loss, low-permittivity materials like fiberglass-reinforced plastic or rigid vinyl ester resins.
Relative permittivity must remain below 5.0, with a loss tangent under 0.05, preventing energy storage or field distortion within the shell itself.
Flat phantoms simulate torso and extremity exposure for trunk-mounted or handheld transceivers. These containers feature large planar bottom surfaces where handheld units, holsters, and belt clips sit during testing. Mechanical deflection of the bottom surface under heavy fluid weight alters the critical two-millimeter gap between the radio housing and internal liquid.
Test fixtures incorporate structural support ribs along outer non-scanning zones to keep active scanning grids flat.
- Verify Broad-Band Chemical Composition to ensure target permittivity remains stable across broad frequency sweeps without needing fluid exchanges.
- Audit Phantom Shell Deflection under full liquid loading using precision laser displacement sensors across active measurement grids.
- Calibrate Dipole Reference Sources at standard laboratory ambient temperatures using power meters traceable to national metrology institutes.
- Validate Fluid Temperature Profiles using immersed probe sensors before initiating formal exposure measurement sequences.
Probe Calibration Boundary Factors and Sensor Offsets
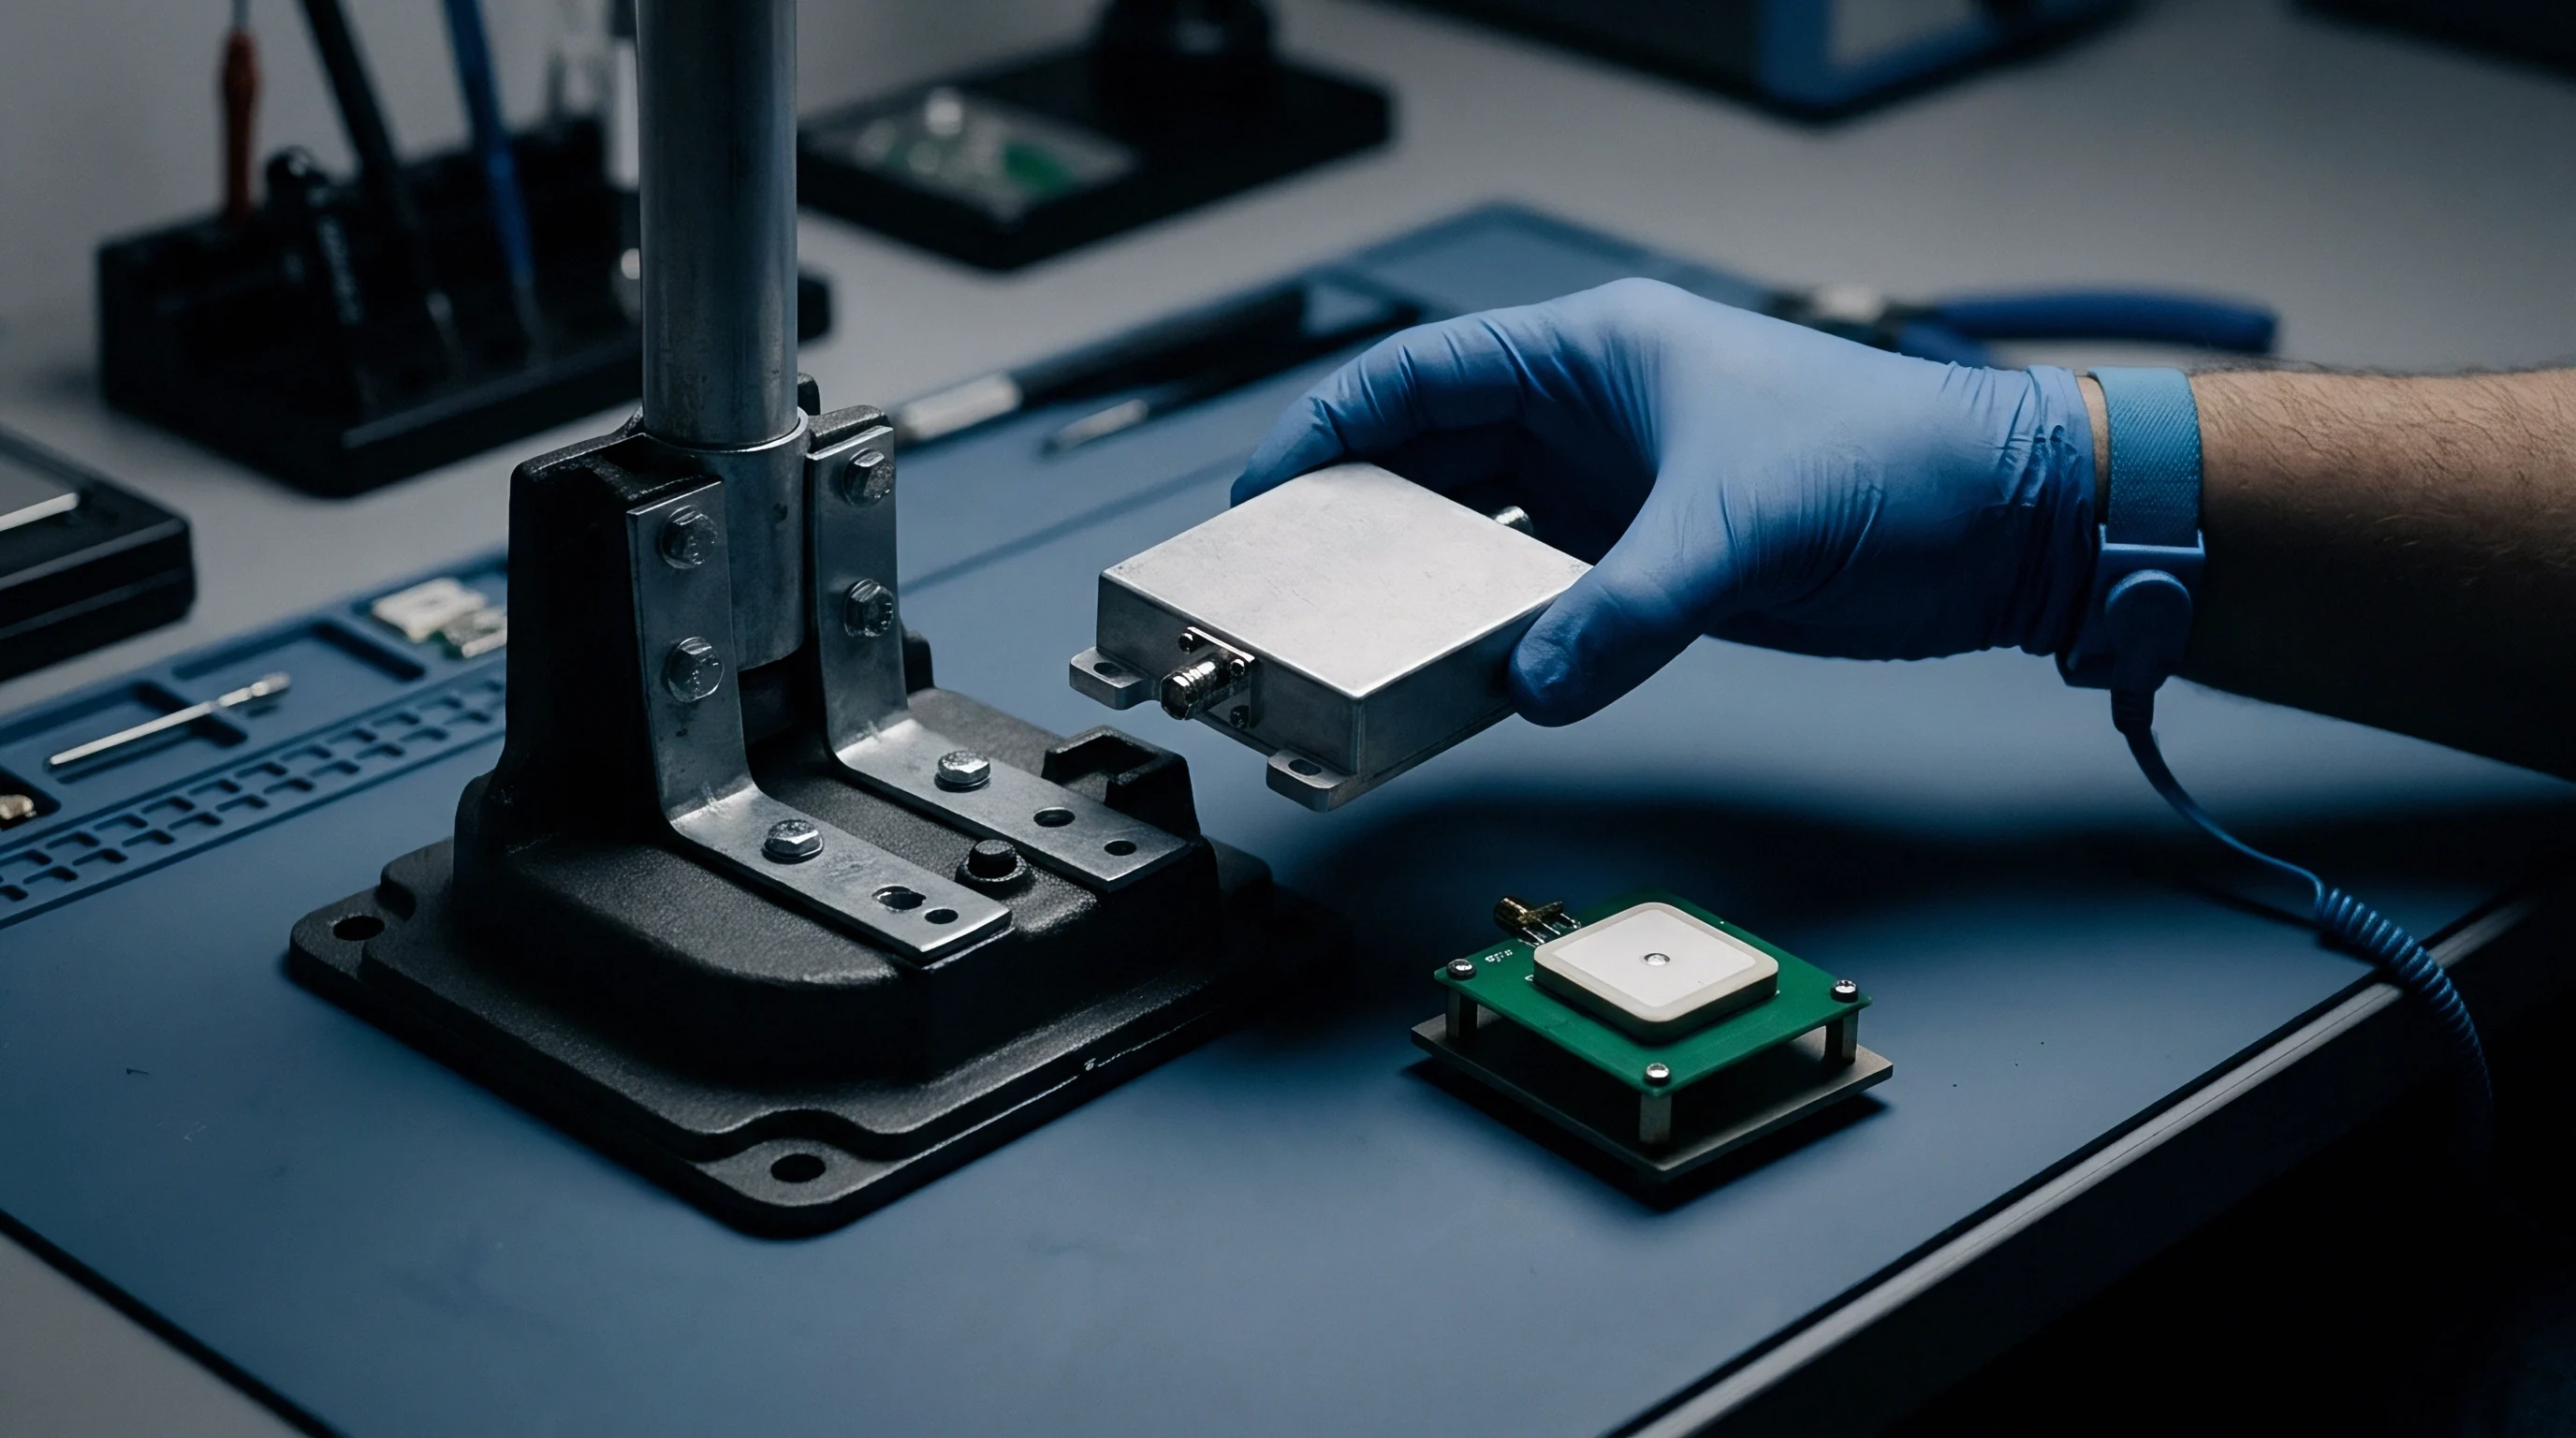
Isotropic electric field probes use miniature orthogonal dipole sensors mounted on low-loss substrates inside protective glass or plastic tubes. Physical probe dimensions limit how close sensor elements can get to the inner surface of the phantom container, with sensor centers typically sitting 1.0 to 2.5 millimeters behind the physical tip. Spatial field values directly at the phantom-liquid interface must be calculated by applying extrapolation algorithms to data points measured at increasing distances from the wall.
Boundary effects distort electric field distributions around probe tips when sensors operate within one probe diameter of the rigid shell. Correction routines adjust measured field data using empirical calibration factors established during precision waveguide procedures. Skipping or miscalculating boundary effect corrections leads to significant errors in localized energy absorption.
Modern fast-SAR scanning systems rely on optical distance sensors and high-resolution spatial sampling to reconstruct steep boundary-layer field decays accurately.
Ambient temperature variation during a three-day scan sequence remains negligible when kept within the baseline calibration allowance of the dipole validation matrix.


Thresholds
Regulatory jurisdictions enforce different maximum exposure limits for handheld transceivers. While basic physical interaction principles are the same globally, regional certification bodies mandate different spatial mass integration rules, exposure limits, and operational duty factor exemptions. Navigating global product launches requires a compliance matrix that accounts for these technical variations across target export markets.
A single radio design intended for worldwide distribution must satisfy the most restrictive parameter limits across all target destinations simultaneously.
Uncertainty around regulatory thresholds often stems from differences in how exposure is defined. United States Federal Communications Commission rules mandate a localized peak SAR limit of 1.6 W/kg integrated over a 1-gram tissue cube for general population head and torso exposure. European Union regulations under the Radio Equipment Directive set a limit of 2.0 W/kg averaged over a 10-gram tissue cube.
Canada, Japan, China, and Brazil maintain distinct structural nuances within their certification frameworks, requiring precise alignment before entering local commercial channels.
Head and Body Exposure Limits across Markets
United States exposure evaluation procedures set strict localized SAR caps for portable transceivers operating within 20 centimeters of the user. Federal Communications Commission KDB publication 447498 mandates specific 1-gram mass averaging protocols. Portable handheld devices must meet the 1.6 W/kg threshold for unrestricted consumer use.
Occupational exposure rules allow higher thresholds up to 8.0 W/kg over 1 gram, provided users receive safety training, operate devices as part of employment duties, and maintain direct visual awareness of transmission states.
European standards under Harmonized Standard EN 50566 apply 10-gram spatial averaging metrics for handheld and body-worn transceivers. The 10-gram averaging volume smooths out localized energy spikes, making compliance easier to achieve for small internal patch antennas than under 1-gram standards. However, European Union filings require rigorous assessment of extremity exposure alongside head and trunk positions.
Canadian ISED RSS-102 Issue 6 aligns localized limits with US 1-gram thresholds while introducing unique power density transition limits and strict fast-SAR validation criteria.
| Jurisdiction | Regulatory Standard | Head / Torso SAR Limit | Extremity SAR Limit | Averaging Mass | Upper Boundary |
|---|---|---|---|---|---|
| United States | FCC Part 2.1093 / KDB 447498 | 1.6 W/kg | 4.0 W/kg | 1g Head/Body, 10g Extremity | 6 GHz (MPE above) |
| European Union | EN 50566 / EN 62209-1528 | 2.0 W/kg | 4.0 W/kg | 10g Head/Body, 10g Extremity | 6 GHz (APD above) |
| Canada | ISED RSS-102 Issue 6 | 1.6 W/kg | 4.0 W/kg | 1g Head/Body, 10g Extremity | 6 GHz (APD above) |
| China | GB 21288-2022 | 2.0 W/kg | 4.0 W/kg | 10g Head/Body, 10g Extremity | 6 GHz (MPE above) |
| Japan | MIC Ordinance Art. 14-2 | 2.0 W/kg | 4.0 W/kg | 10g Head/Body, 10g Extremity | 6 GHz (APD above) |
| Brazil | ANATEL Act 16307 | 2.0 W/kg | 4.0 W/kg | 10g Head/Body, 10g Extremity | 6 GHz (APD above) |
Extremity Exposure Exemptions and Position Factors
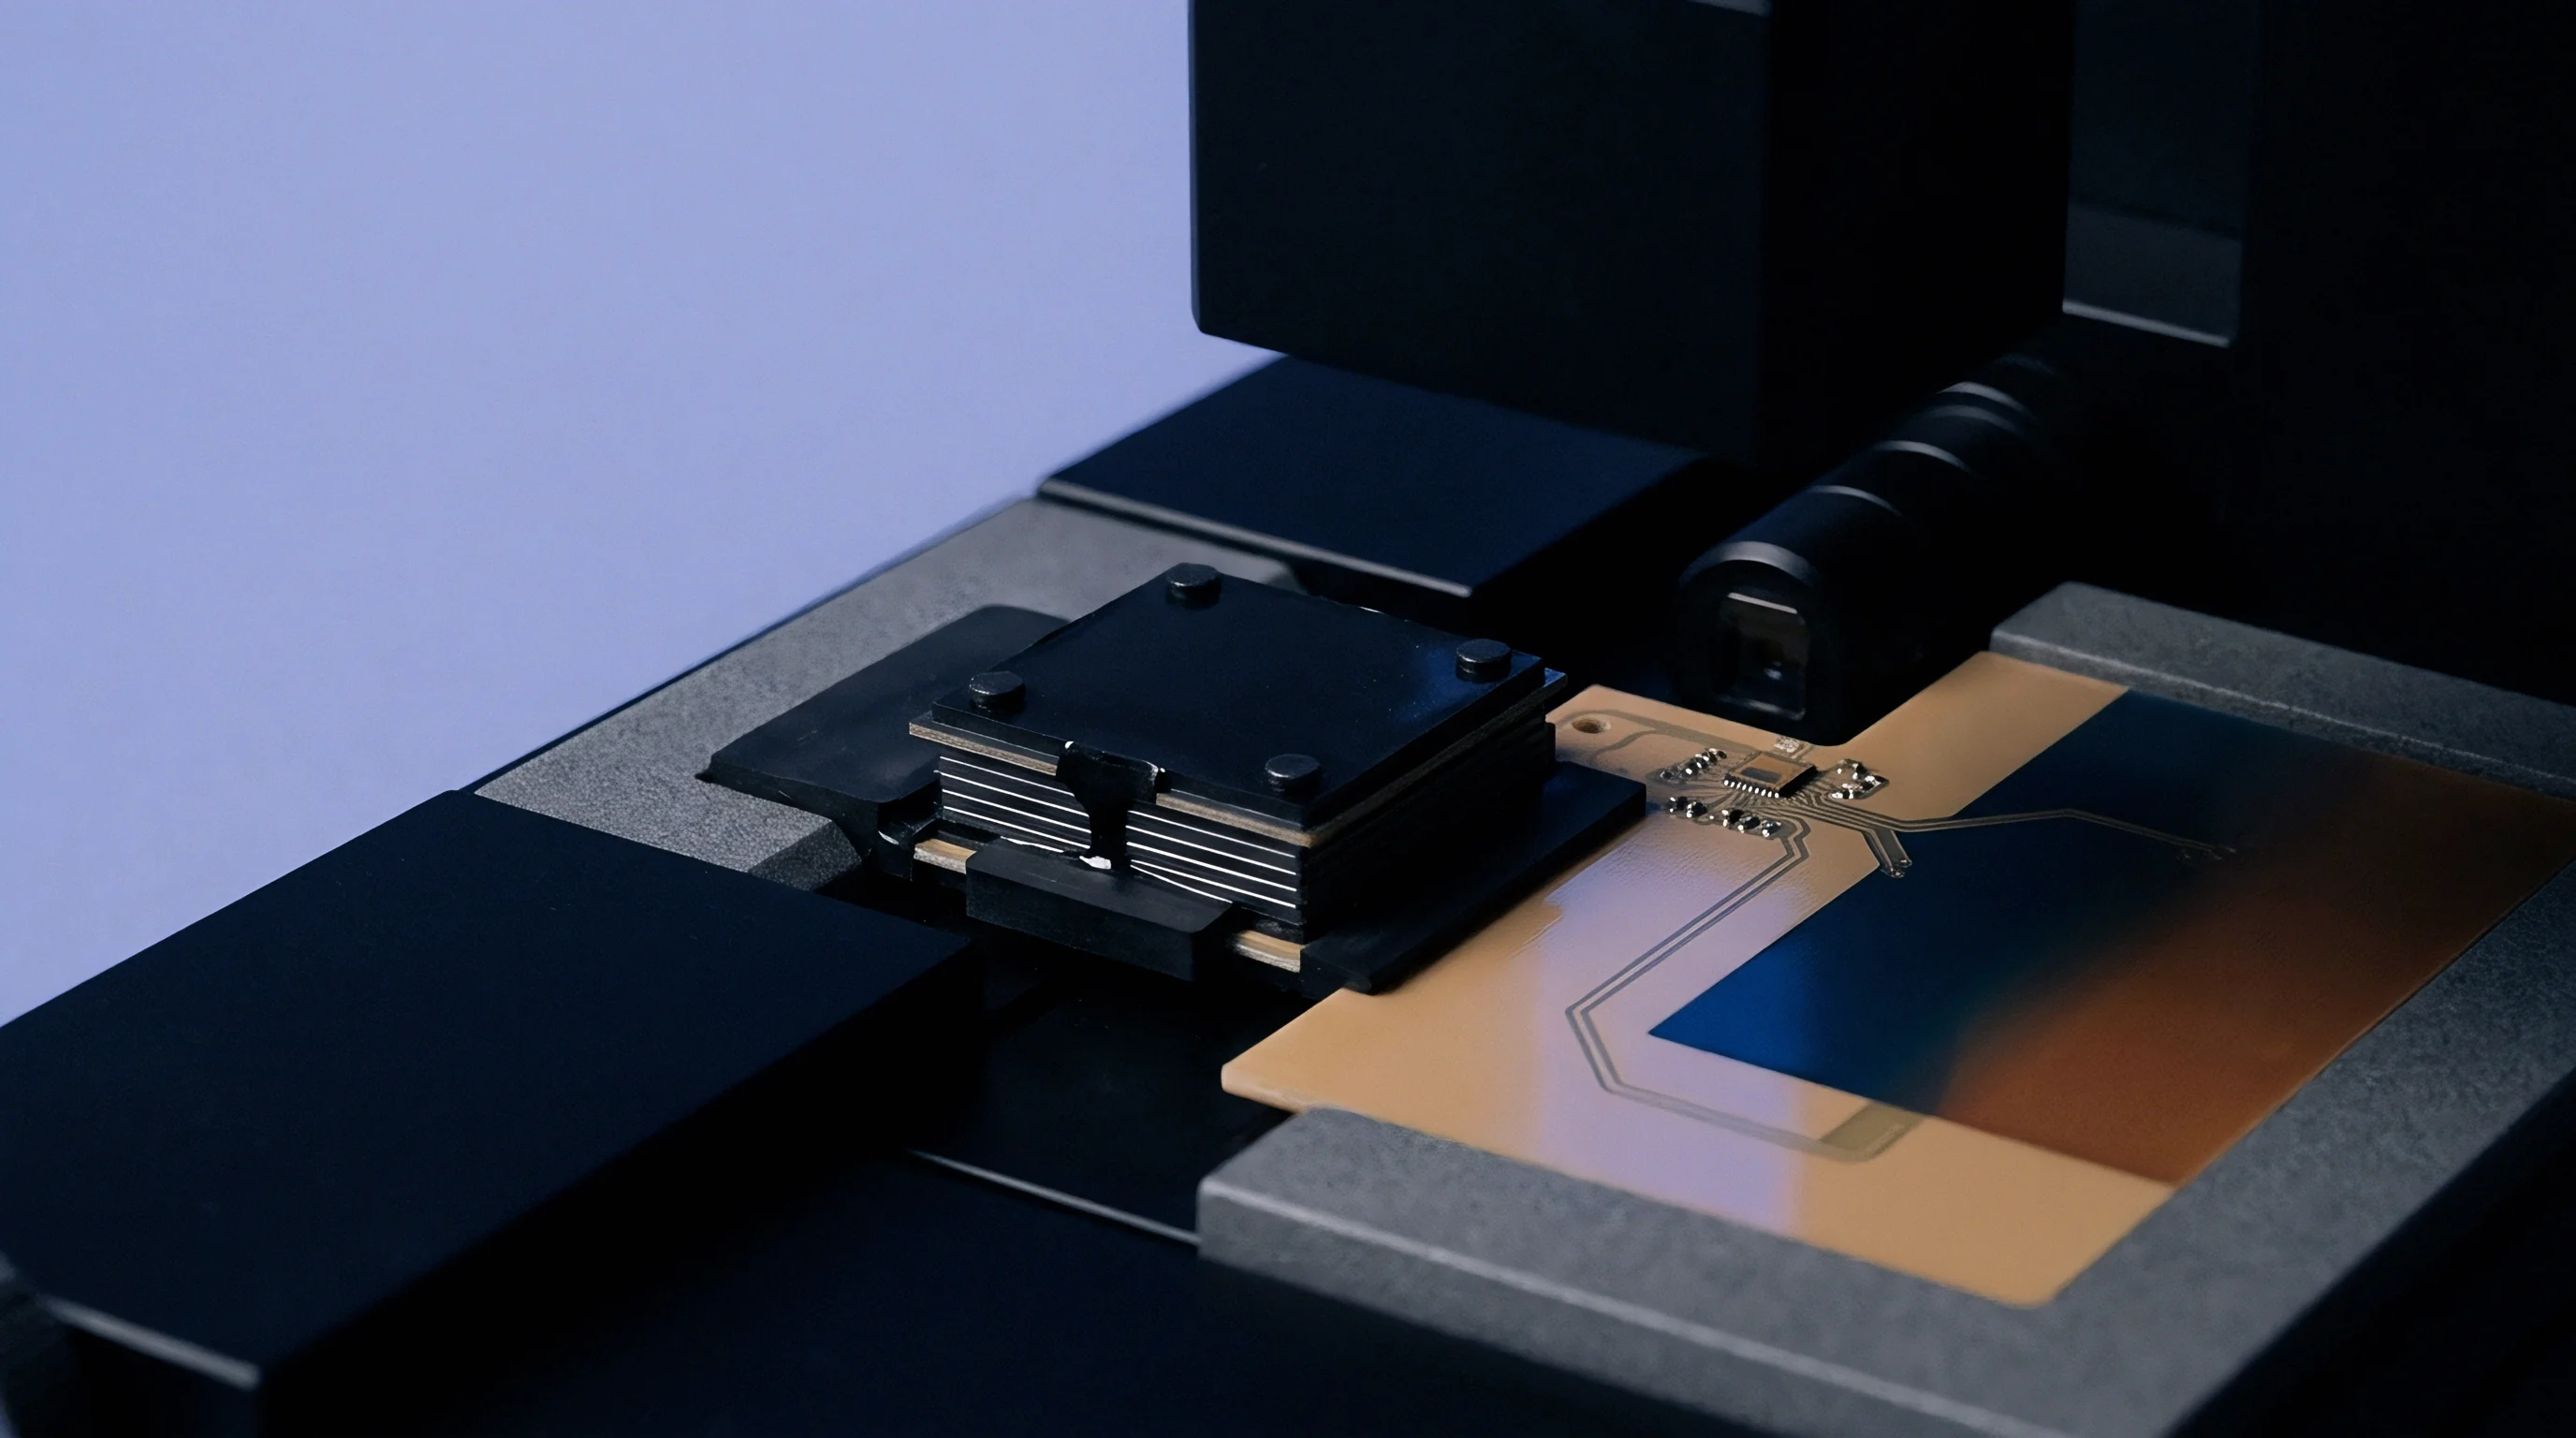
Transceivers held exclusively by hands, wrists, or feet qualify for extremity exposure thresholds. Extremity SAR limits sit higher than head and torso limits, set at 4.0 W/kg averaged over a 10-gram tissue volume across FCC, CE, and ISED frameworks. This higher limit accounts for reduced thermal sensitivity and increased vascular heat dissipation in human limbs.
Claiming extremity limits requires physical proof that the device form factor prevents direct operation against the head or torso during standard use.
Push-to-talk land mobile radios present unique compliance challenges regarding position factors and source-based time-averaging. Regulatory authorities allow a nominal 50 percent operational duty cycle deduction for dedicated push-to-talk units, assuming the user transmits half the time and receives half the time during normal field operations. Devices featuring continuous digital data transmissions, Wi-Fi tethering, or integrated cellular backhaul cannot claim this discount; they require full-power continuous transmission SAR evaluation across all active wireless interfaces.
A 450 MHz land mobile handheld transmitting at four watts nominal output exceeds the 10-gram extremity limit of 4.0 W/kg when held closer than twelve millimeters from the phantom boundary without duty factor compensation.

Can Fast Scans Replace Full Absorption Rate Scans?
Automated fast-SAR screening systems use array-based vector probe technology or reconstructed planar sensor arrays to measure spatial field distribution in fractions of a minute, compared to the twenty to forty minutes per channel scan required by traditional single-probe robotic systems. While fast-SAR tools speed up engineering design iterations and pre-scan evaluations, regulatory acceptance for final certification filings remains constrained by strict validation criteria established by regional telecommunication authorities.
United States and Canadian regulators permit fast-SAR array systems for formal compliance filings under defined conditions. The fast-scan measurement platform must hold valid IEC/IEEE 62209-1528 equipment qualification certificates. When fast-SAR screening indicates spatial peak absorption values exceeding specified threshold ceilings (typically 1.2 W/kg for 1-gram limits), the test plan must escalate to full three-dimensional single-probe robotic validation sweeps on critical channels.
Fast-scan array systems save up to sixty percent of total chamber time during preliminary multi-band antenna placement trials.
- Calculate Maximum Conducted Output Power including upper manufacturing tuning tolerance limits across all supported frequency bands.
- Determine Minimum Physical Separation based on device housing design, holsters, and expected human body touchpoints.
- Compute Standalone SAR Exclusion Thresholds using regional frequency-dependent formulas to identify channels exempt from formal laboratory testing.
- Execute Baseline SAR Area Scans across remaining non-exempt channels using calibrated liquid tissue phantoms and automated probe positioners.
- Perform High Resolution Zoom Scans centered over localized spatial peak absorption coordinates to calculate precise 1-gram and 10-gram mass-averaged values.
- Document Simultaneous Transmission Combinations to evaluate spatial superposition ratios across co-located cellular, Wi-Fi, and short-range transceivers.
Section 8.2.4 of RSS-102 Issue 6 mandates that host devices integrating pre-certified modules with user-configurable power tables provide hard-coded firmware enforcement preventing manual override of maximum conservative duty factors.

Algorithms
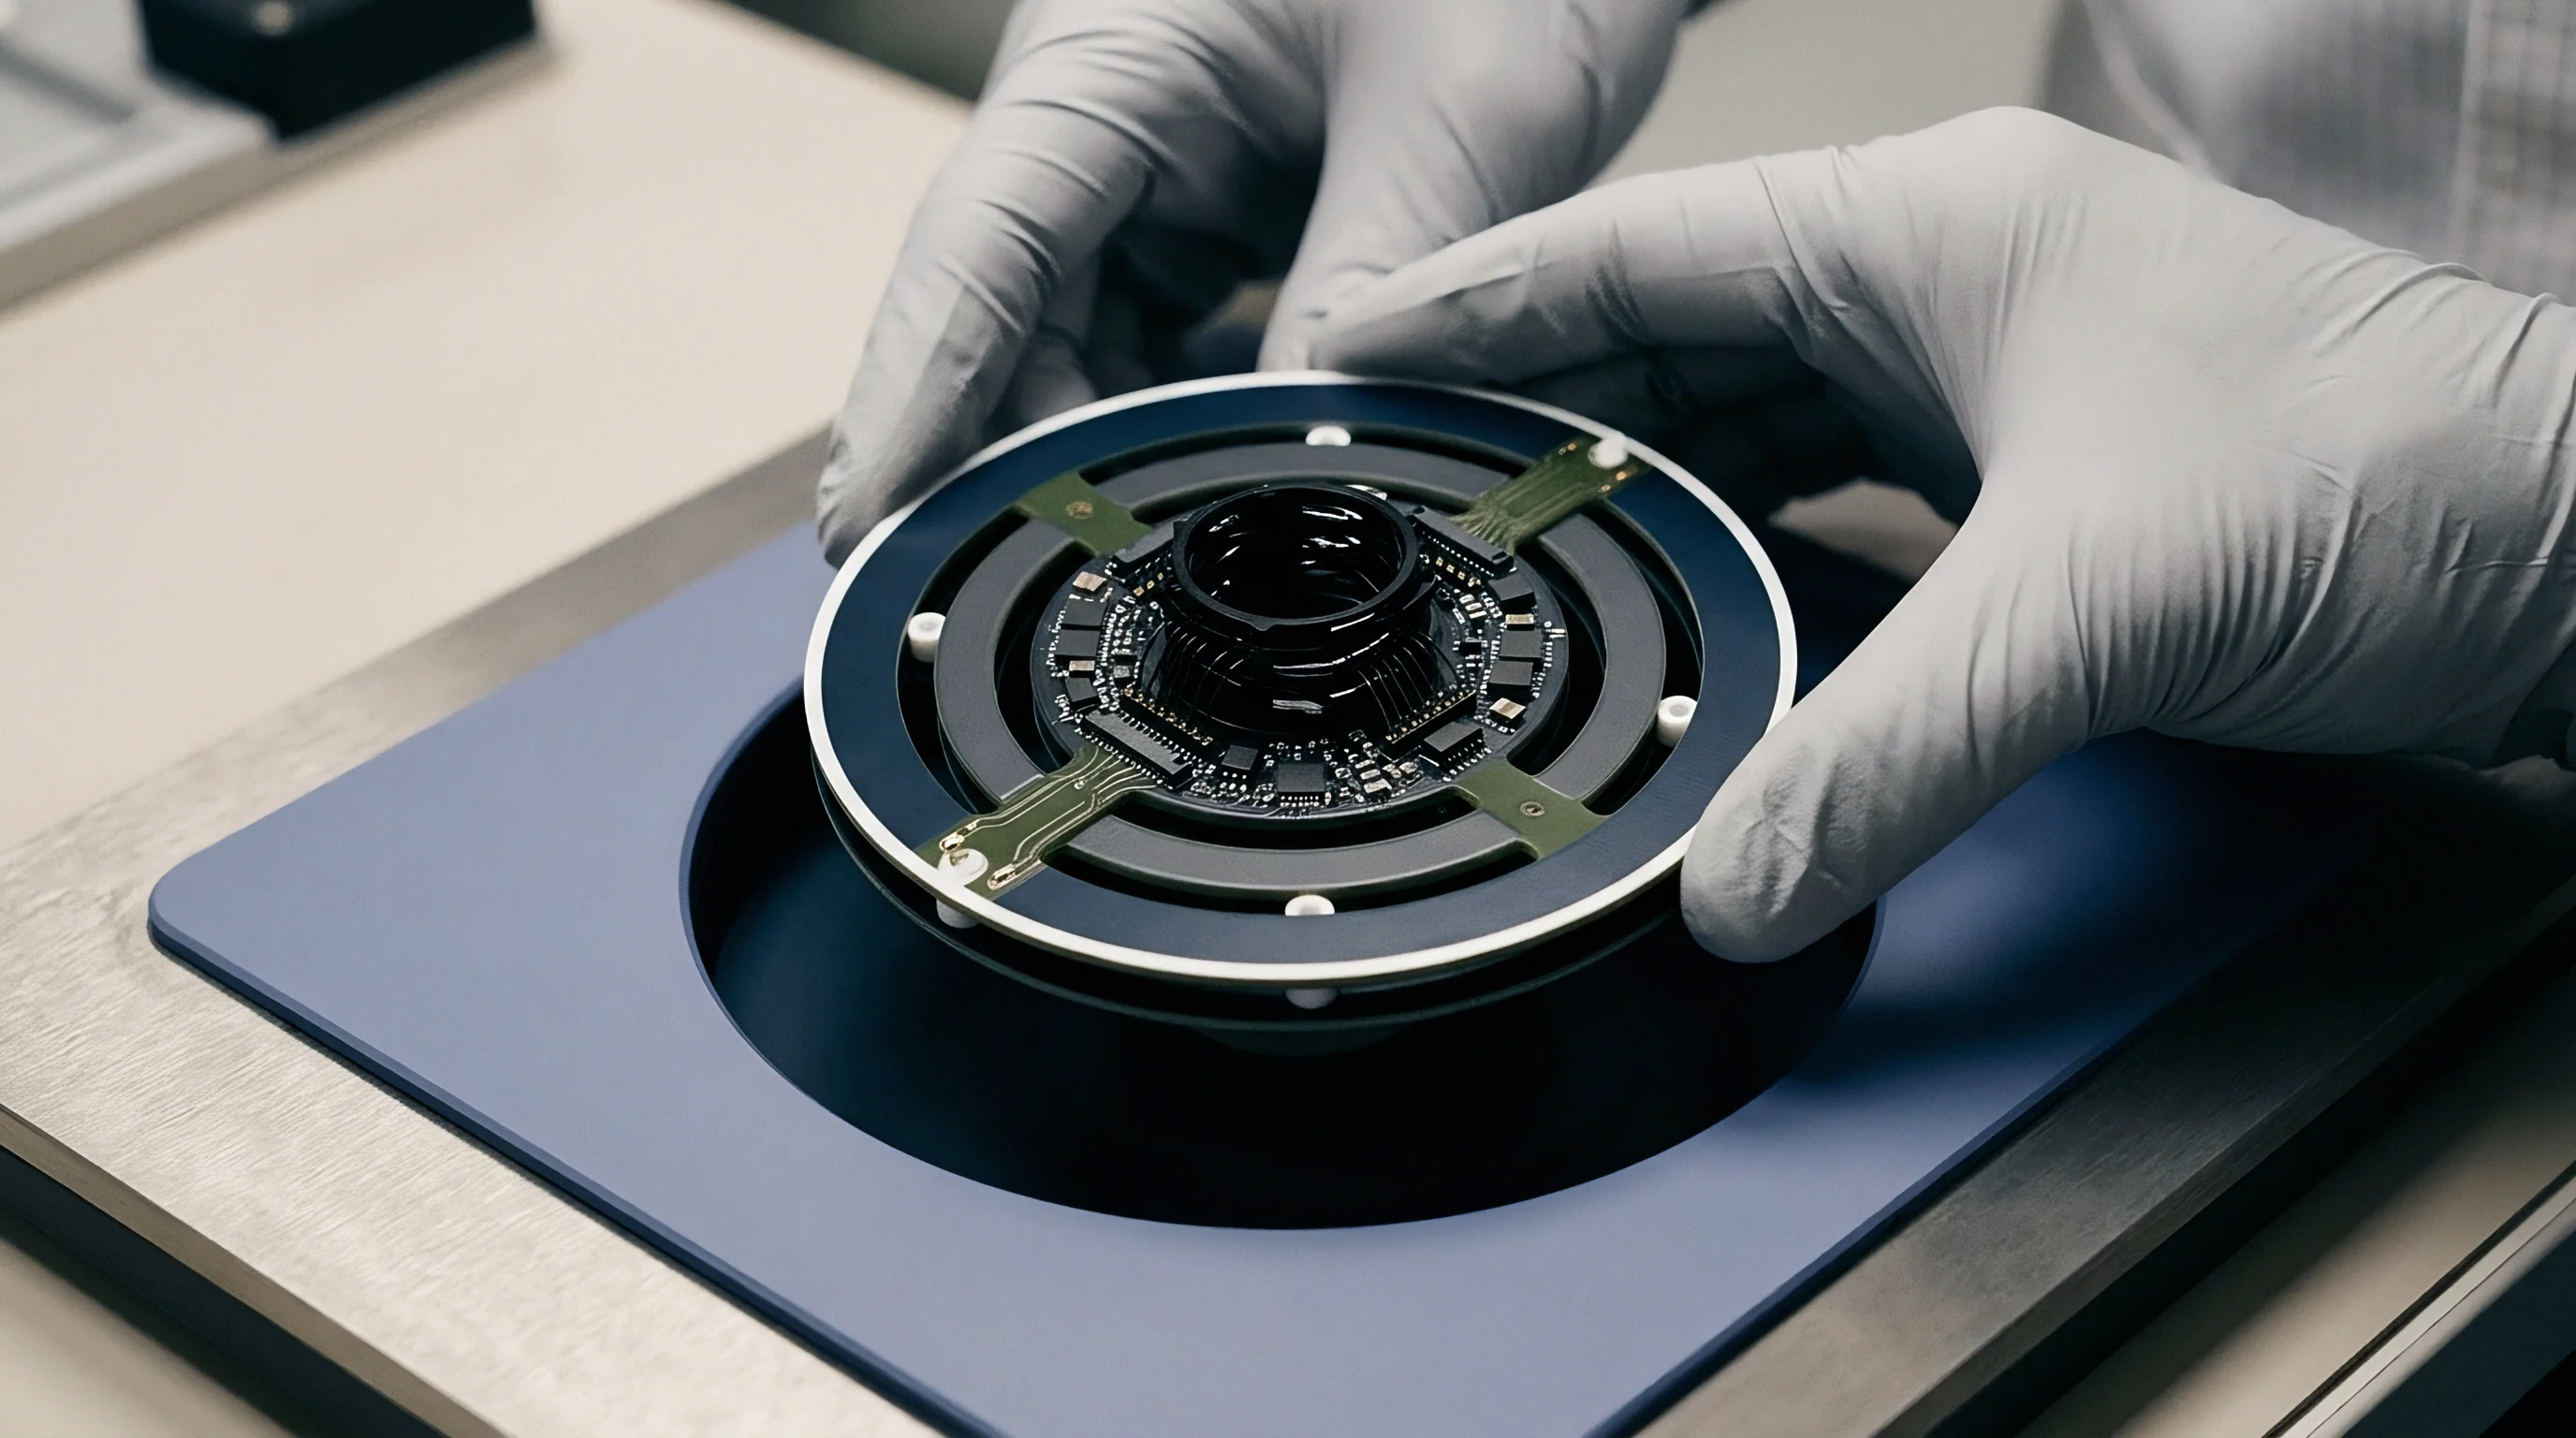
Modern handheld transceivers integrate high-density multi-radio architectures within constrained housing volumes. Operating cellular sub-6 GHz, Wi-Fi 6E/7, Bluetooth, and ultra-wideband transceivers simultaneously creates complex radio frequency exposure environments. Evaluating compliance relies on calculating combined exposure ratios across co-located antenna modules.
When combined SAR summation ratios exceed maximum allowable limits, device firmware must implement dynamic power management algorithms to constrain real-time radiation parameters.
Dynamic Transmit Power algorithms, commonly called Time-Averaged SAR mechanisms, actively monitor and control instantaneous transmit power levels. Rather than capping maximum output power permanently to meet worst-case static limits, time-averaging software tracks energy deposition over sliding time windows. The transceiver can operate at high burst power levels during weak signal conditions, then scale down output power in subsequent time blocks to keep cumulative average exposure strictly below regulatory limits.
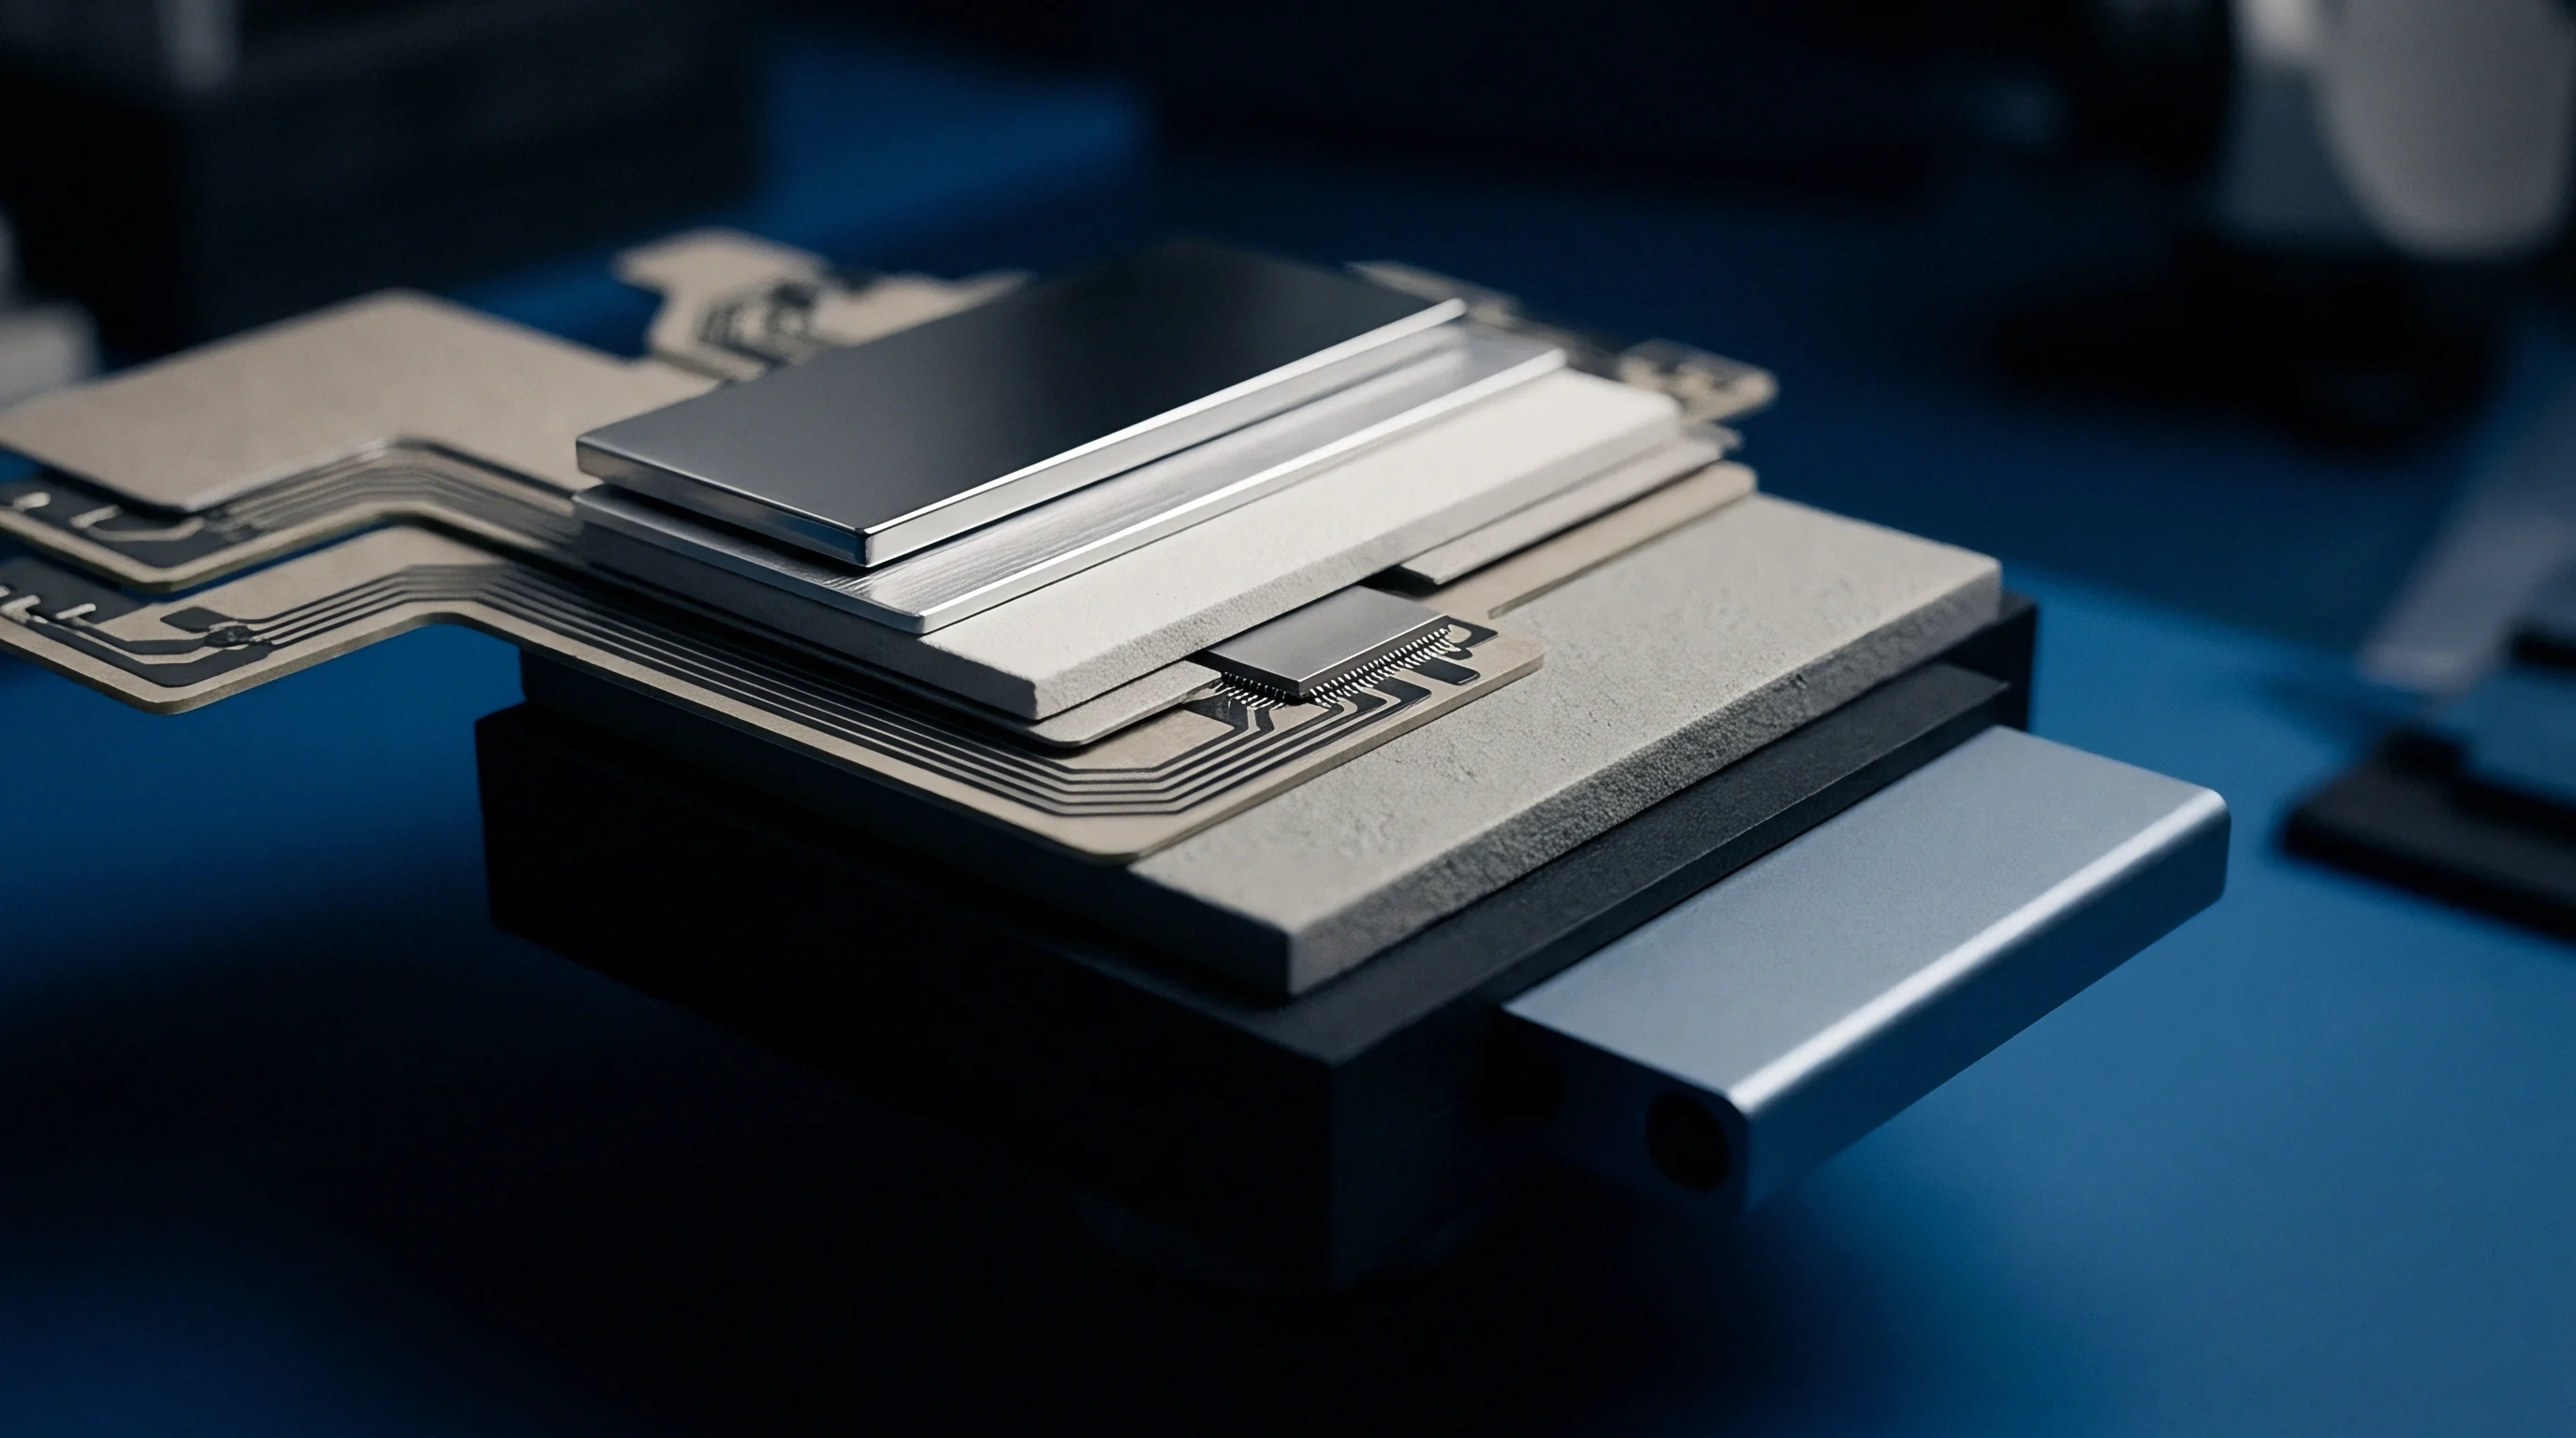
Time Averaged Power Control and Firmware Determinism
Time-averaged algorithms implement deterministic control state tables embedded directly into cellular baseband modems and Wi-Fi system-on-chip controllers. Certification bodies, particularly the FCC and ISED, enforce rigorous qualification protocols for devices using dynamic power control. Filing dossiers must contain complete mathematical descriptions of tracking algorithms, sliding time window parameters (typically 100 seconds below 3 GHz and 60 seconds between 3 GHz and 6 GHz), and real-time power feedback loop response times.
Firmware architecture must prevent end users from modifying dynamic power management algorithms. Regulators treat dynamic exposure controls as critical compliance mechanisms. If a user flashes customized OS software or executes root access scripts that alter baseband power tables, the device loses its certification coverage.
Certification filings must include comprehensive security documentation detailing cryptographic signature checks, secure boot chains, and closed power lookup tables stored in protected flash memory.
| Radio Interface | Test Position | Standalone 1g SAR (W/kg) | Antenna Separation (mm) | Peak Location (x, y, z) | Summed Ratio |
|---|---|---|---|---|---|
| LTE Band 13 (777 MHz) | Cheek Touch | 0.82 | Baseline | (12.4, -45.2, -170.1) | N/A |
| NR n78 (3500 MHz) | Cheek Touch | 0.54 | 22.5 | (34.8, -20.1, -165.0) | N/A |
| Wi-Fi 6E (5925 MHz) | Cheek Touch | 0.31 | 45.0 | (-15.2, 10.4, -160.5) | N/A |
| Simultaneous Combined | Cheek Touch | 1.67 (Raw Sum) | Multi-Antenna | Spatially Resolved | 0.94 (SPLSR) |
Simultaneous Transmission Exposure Ratios in Multimode Terminals
Evaluating multi-transmitter devices requires assessing spatial peak superposition. When co-located antennas are widely separated, their localized absorption peaks occur at distinct coordinates within human tissue. Simple numerical addition of standalone peak SAR values produces overly conservative figures that can fail compliance checks unnecessarily.
Spatial Peak Location SAR Ratio (SPLSR) calculations resolve true overlapping exposure fields by analyzing three-dimensional distance vectors between peak absorption coordinates.
When the computed peak-to-peak distance ratio remains below regulatory thresholds, transmitters can operate simultaneously without triggering global power back-off routines. If localized exposure fields overlap substantially, the combined SAR ratio must stay at or below 1.0. Dynamic exposure management software resolves overlapping fields by calculating real-time normalized exposure ratios across active radio chains, throttling secondary Wi-Fi or Bluetooth output power whenever primary cellular transmissions approach peak allocation budgets.
Software-driven dynamic power back-off mechanisms introduce regulatory risk when firmware revisions modify power tables after laboratory certification.
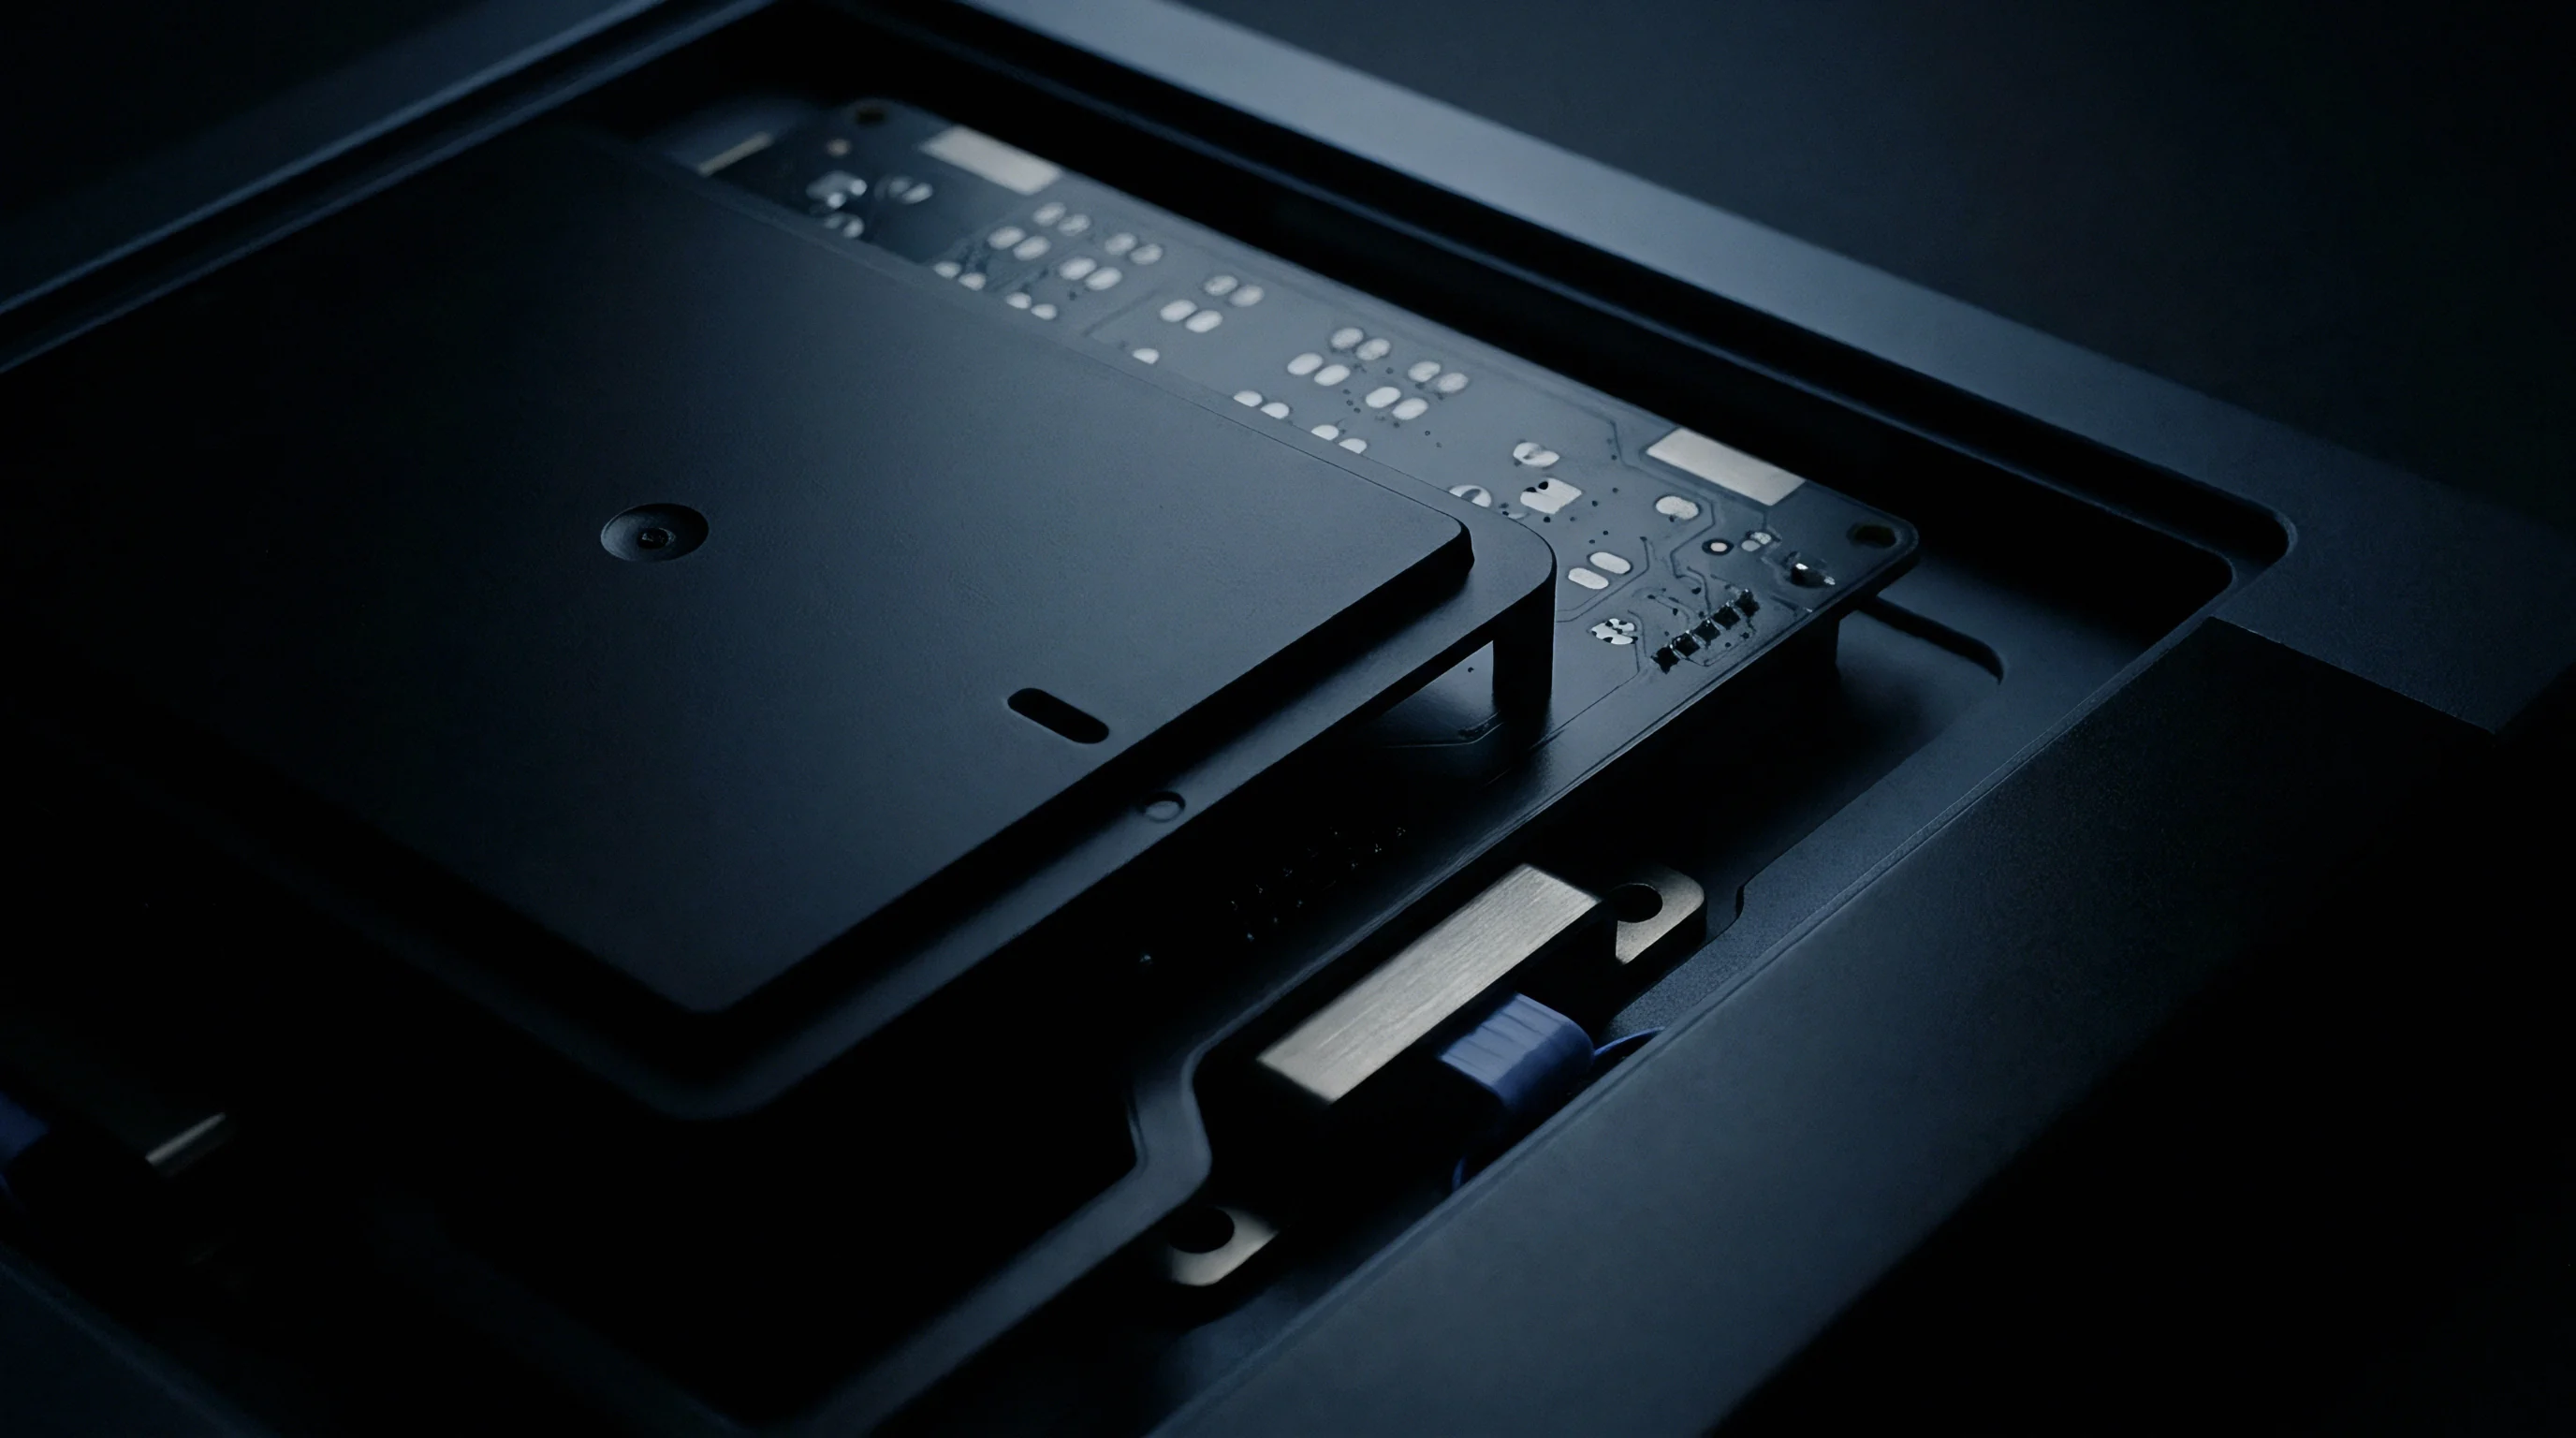
Proximity Sensor Backoff Validation and Hysteresis Gaps
Capacitive proximity sensors embedded along outer housing frames detect body contact to trigger radio frequency power back-off states. Transceivers use these sensor pads to distinguish between free-space operation on a table and close proximity to a user’s leg or torso. When proximity triggers, device firmware reduces maximum allowable conducted power by defined decibel steps, keeping localized SAR within legal limits during body-worn operation.
Validating proximity sensor operation demands rigorous mechanical testing in accredited laboratories. Engineers must record triggering distances across multiple vectors approaching front, rear, top, bottom, and side housing surfaces. The physical distance where power back-off engages must exceed the distance where power recovers as the device moves away from skin.
This hysteresis gap prevents rapid power toggling during subtle user movements, ensuring stable radio connections while maintaining compliance.
- Initial test setup validates baseline maximum conducted power levels using hardwired radio call-box connections under free-space conditions.
- Mechanical positioning stages shift human-equivalent phantom blocks toward capacitive sensor zones in precise sub-millimeter increments.
- Power meter traces record the exact displacement coordinate where conducted output power drops to the designated back-off state.
- Reverse mechanical translation isolates the hysteresis release point, confirming that power remains attenuated until safe distance margins are cleared.
- Robotic SAR probes scan active liquid phantoms with the device held at the minimum triggering distance minus one millimeter to verify compliance.
When real-time power capping algorithms rely on capacitance sensors, physical contact during extremity exposure tests always yields higher repeatability than free-space proximity triggering.

Sequence
Executing multi-market exposure filings requires disciplined program management and strategic sequencing. Filing radio approvals across United States, European, Canadian, Asian, and South American jurisdictions without a coordinated test campaign leads to duplicated laboratory hours, redundant sample shipments, and escalating budgets. Compliance workflows should be structured around test report transpositions, identifying mutual recognition agreements that allow a single accredited test report to satisfy multiple regional regulatory authorities.
Lead times for international certification vary dramatically based on mandatory in-country representation and local laboratory re-testing mandates. While the European Union accepts manufacturer Declarations of Conformity backed by accredited laboratory reports, markets such as China (SRRC/SAMR), South Korea (KC), and Brazil (ANATEL) enforce strict local testing rules or mandatory local agent sign-offs. Staging campaigns to obtain primary FCC and CE test reports first provides the baseline technical evidence package necessary to initiate secondary market filings rapidly.

Test Campaign Pre Scan Optimization and Routing
Optimizing test campaigns begins at the prototype hardware stage. Engineers should conduct preliminary pre-scans using calibrated near-field probes, thermal imaging, and fast-SAR array scanners long before finalizing internal mechanical layouts. Pre-scanning identifies localized chassis hot spots, validates proximity sensor triggering thresholds, and tunes antenna matching networks.
Resolving exposure issues during early design eliminates catastrophic formal chamber failures that halt mass production schedules.
Sample routing strategies demand careful tracking of physical test units allocated for global regulatory programs. Laboratories require transceivers flashed with specialized test software capable of locking continuous transmission states across specific modulation schemes, data rates, and channel frequencies. Allocating four identical golden units flashed with factory test firmware allows parallel execution of exposure, spurious emission, and safety evaluation programs across two independent test houses.

Mutual Recognition Agreements and Laboratory Report Transposition
Mutual Recognition Agreements between regulatory regions simplify compliance workflows by recognizing testing performed in foreign accredited facilities. An ISO/IEC 17025 accredited laboratory in North America or Europe can generate SAR test reports accepted directly by Canadian ISED, Japanese MIC, and Australian ACMA filing authorities. Leveraging common baseline test procedures under unified standards like IEC/IEEE 62209-1528 minimizes physical sample movement and reduces total test program expenditure.
Transposing test reports requires careful verification of regional administrative details. Test reports written for European Union compliance using 10-gram spatial mass averaging cannot support US FCC filings without generating 1-gram spatial average calculations from raw data files. Advanced test facilities capture full three-dimensional volumetric grid scans during primary test runs.
Storing raw spatial datasets enables software post-processing routines to export both 1-gram and 10-gram localized peak SAR reports from a single physical scan campaign.
Certification Budget Allocation and Filing Retest Management
Budgeting multi-market filing campaigns requires accounting for direct laboratory testing fees, regulatory application costs, local agent representation fees, and contingency reserves for retest management. Initial full-SAR assessment campaigns for complex multi-band handheld transceivers cost between 25,000 USD and 60,000 USD per market set, depending on total frequency band counts and simultaneous transmission permutations. Unplanned retests resulting from failed proximity sensor logic or uncalibrated antenna power drift rapidly expand project costs and delay global commercial launch dates.
Retest risk management hinges on setting conservative internal factory tuning targets. Manufacturing power tolerances must account for component variations, thermal drift, and assembly tolerances across high-volume production lines. If a transceiver leaves the factory with a nominal tuned power set to 23 dBm plus a 1.0 dB upper tolerance limit, formal laboratory exposure testing must be conducted at the maximum theoretical upper bound of 24 dBm.
Testing at nominal target power levels invalidates compliance grants the moment a production audit discovers units operating near the upper manufacturing tolerance threshold.
Whether international harmonization bodies will establish unified dynamic power density spatial averaging standards before millimeter-wave transceivers become standard in handheld emergency communications remains uncertain.