Acoustic Emission in Line Detection of Cavity Insert Micro Wear Kinetics
In line acoustic emission sensors detect mold cavity insert micro wear and coating spalling by filtering mechanical press noise above 100 kHz.

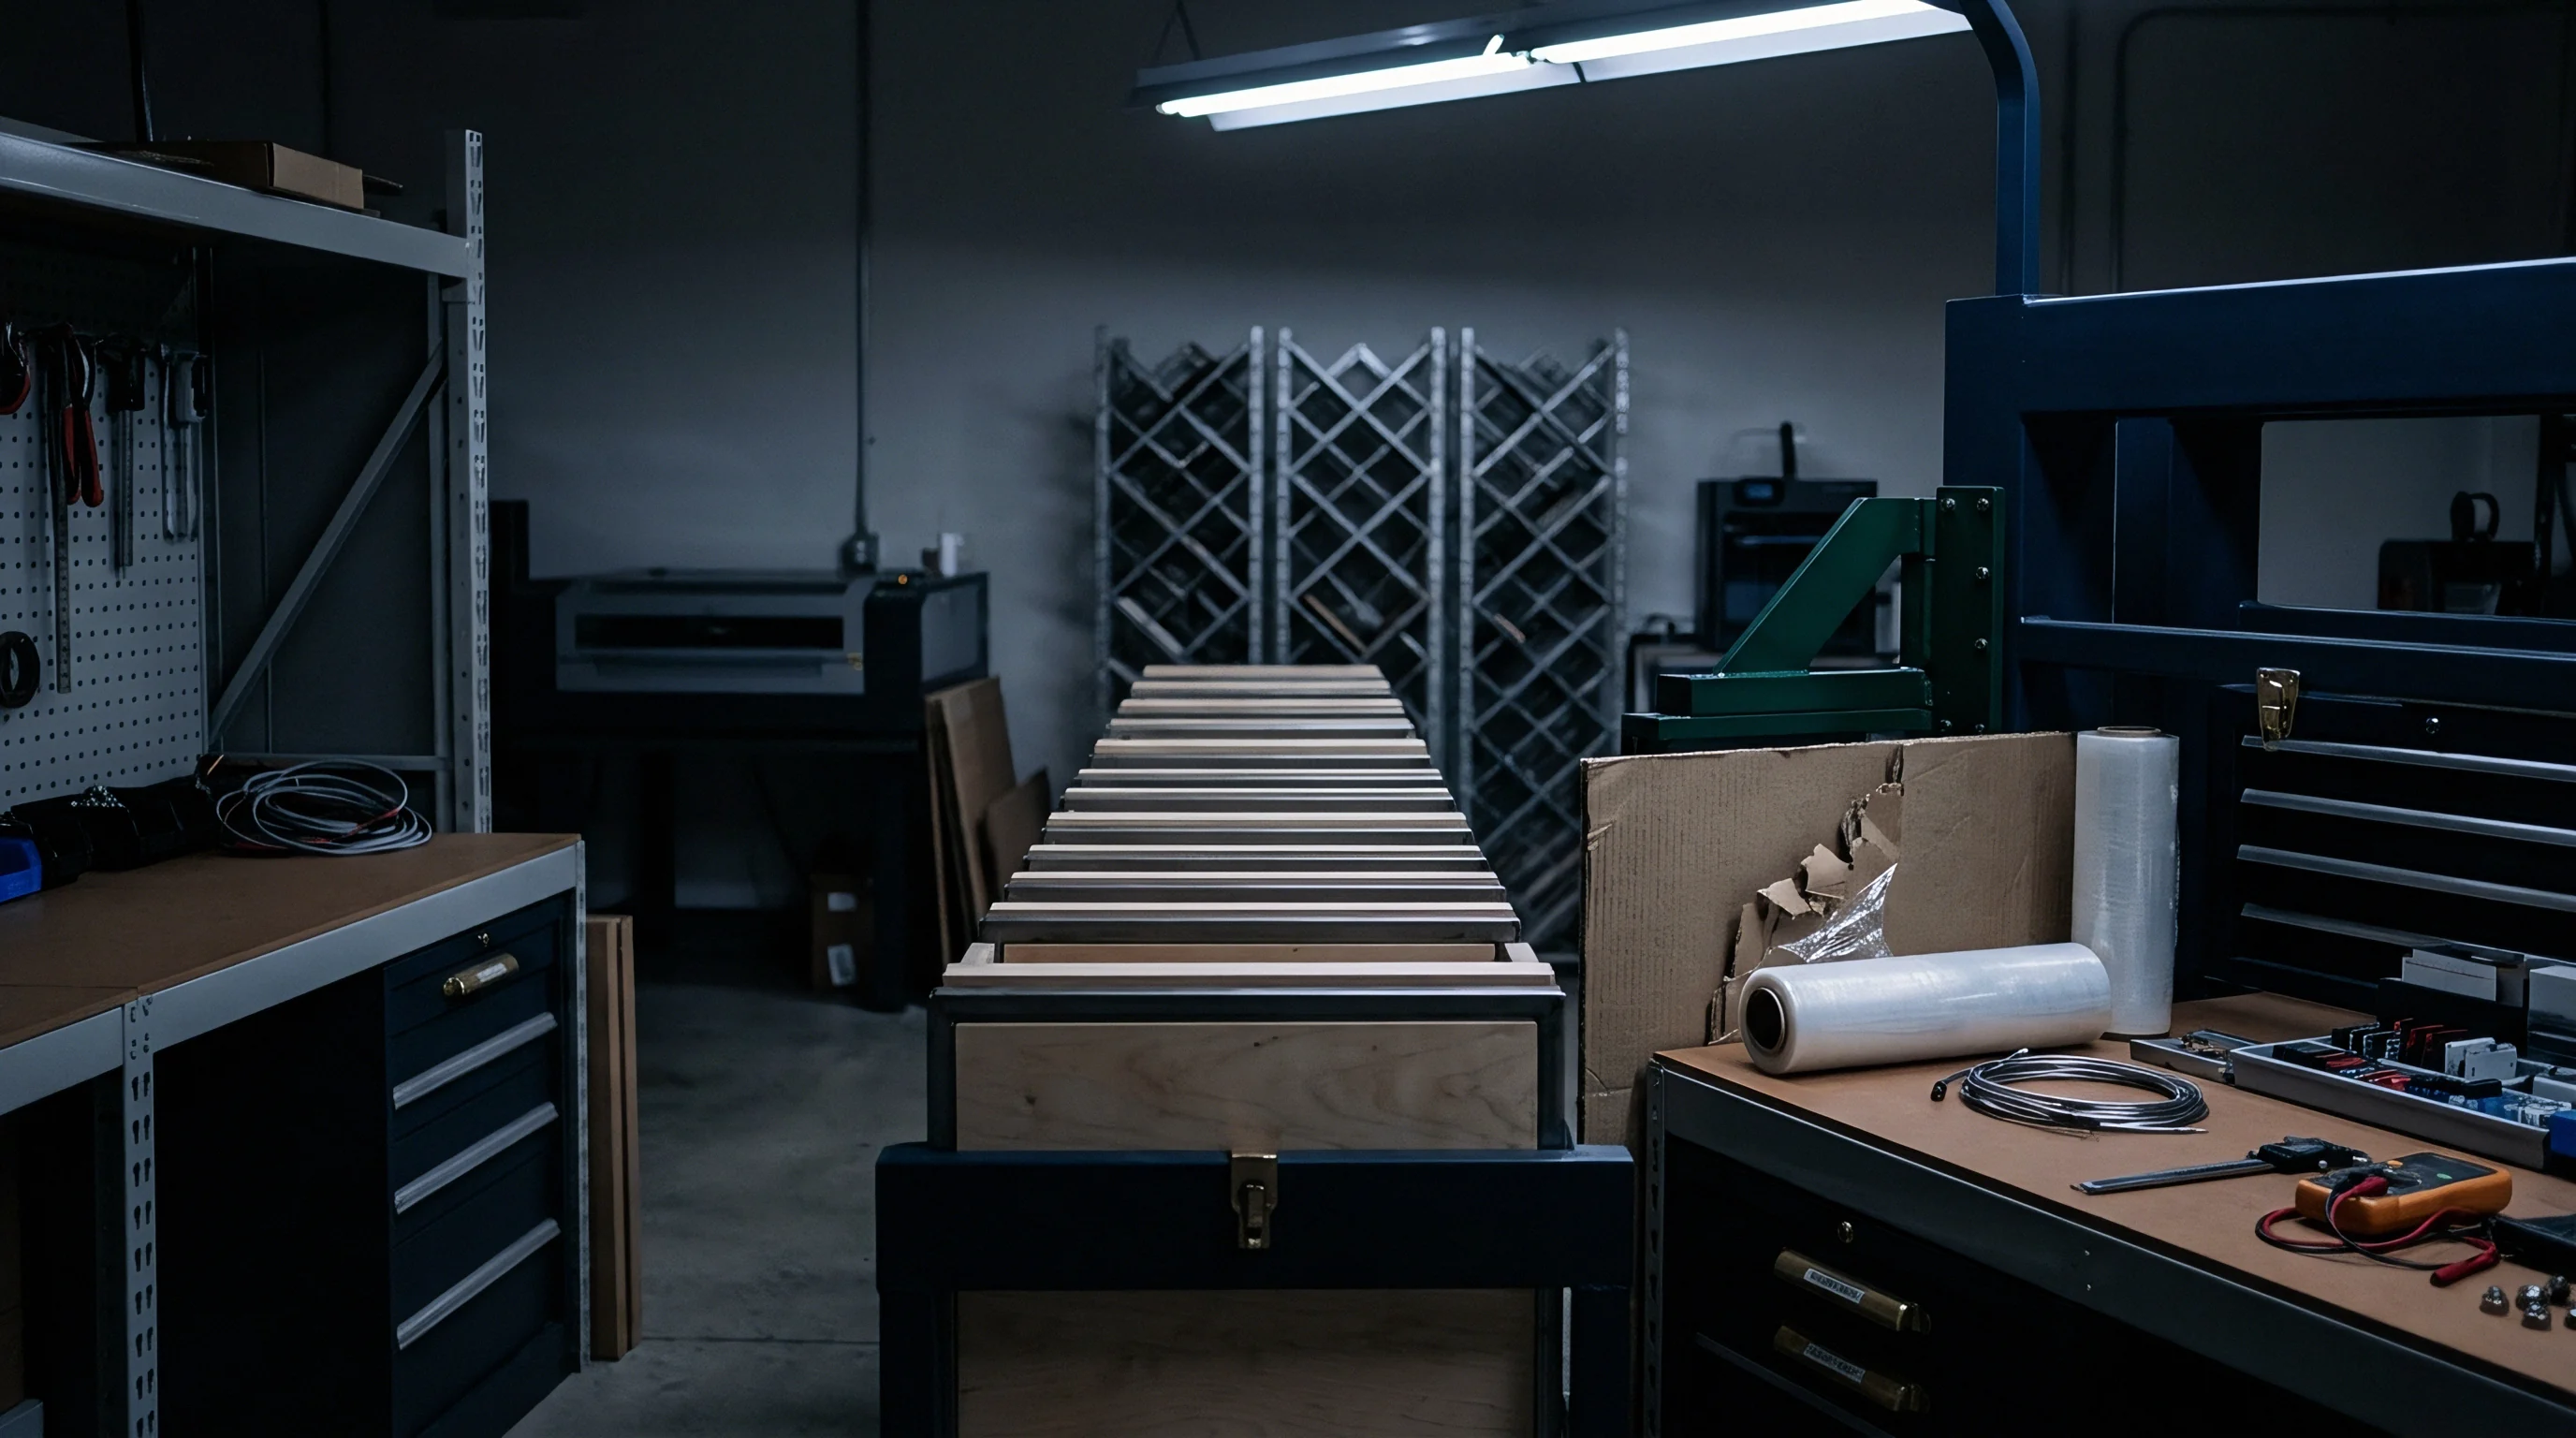
Probe
Transient strain pulses stem from elastic energy released during micro-scale surface deformation inside a mold tool during the injection cycle. Friction between the resin compound and tool steel generates continuous acoustic energy, whereas surface degradation mechanisms produce discrete transient stress waves. These stress waves propagate through tool steel substrates at phase velocities determined by bulk longitudinal and shear acoustic modes.
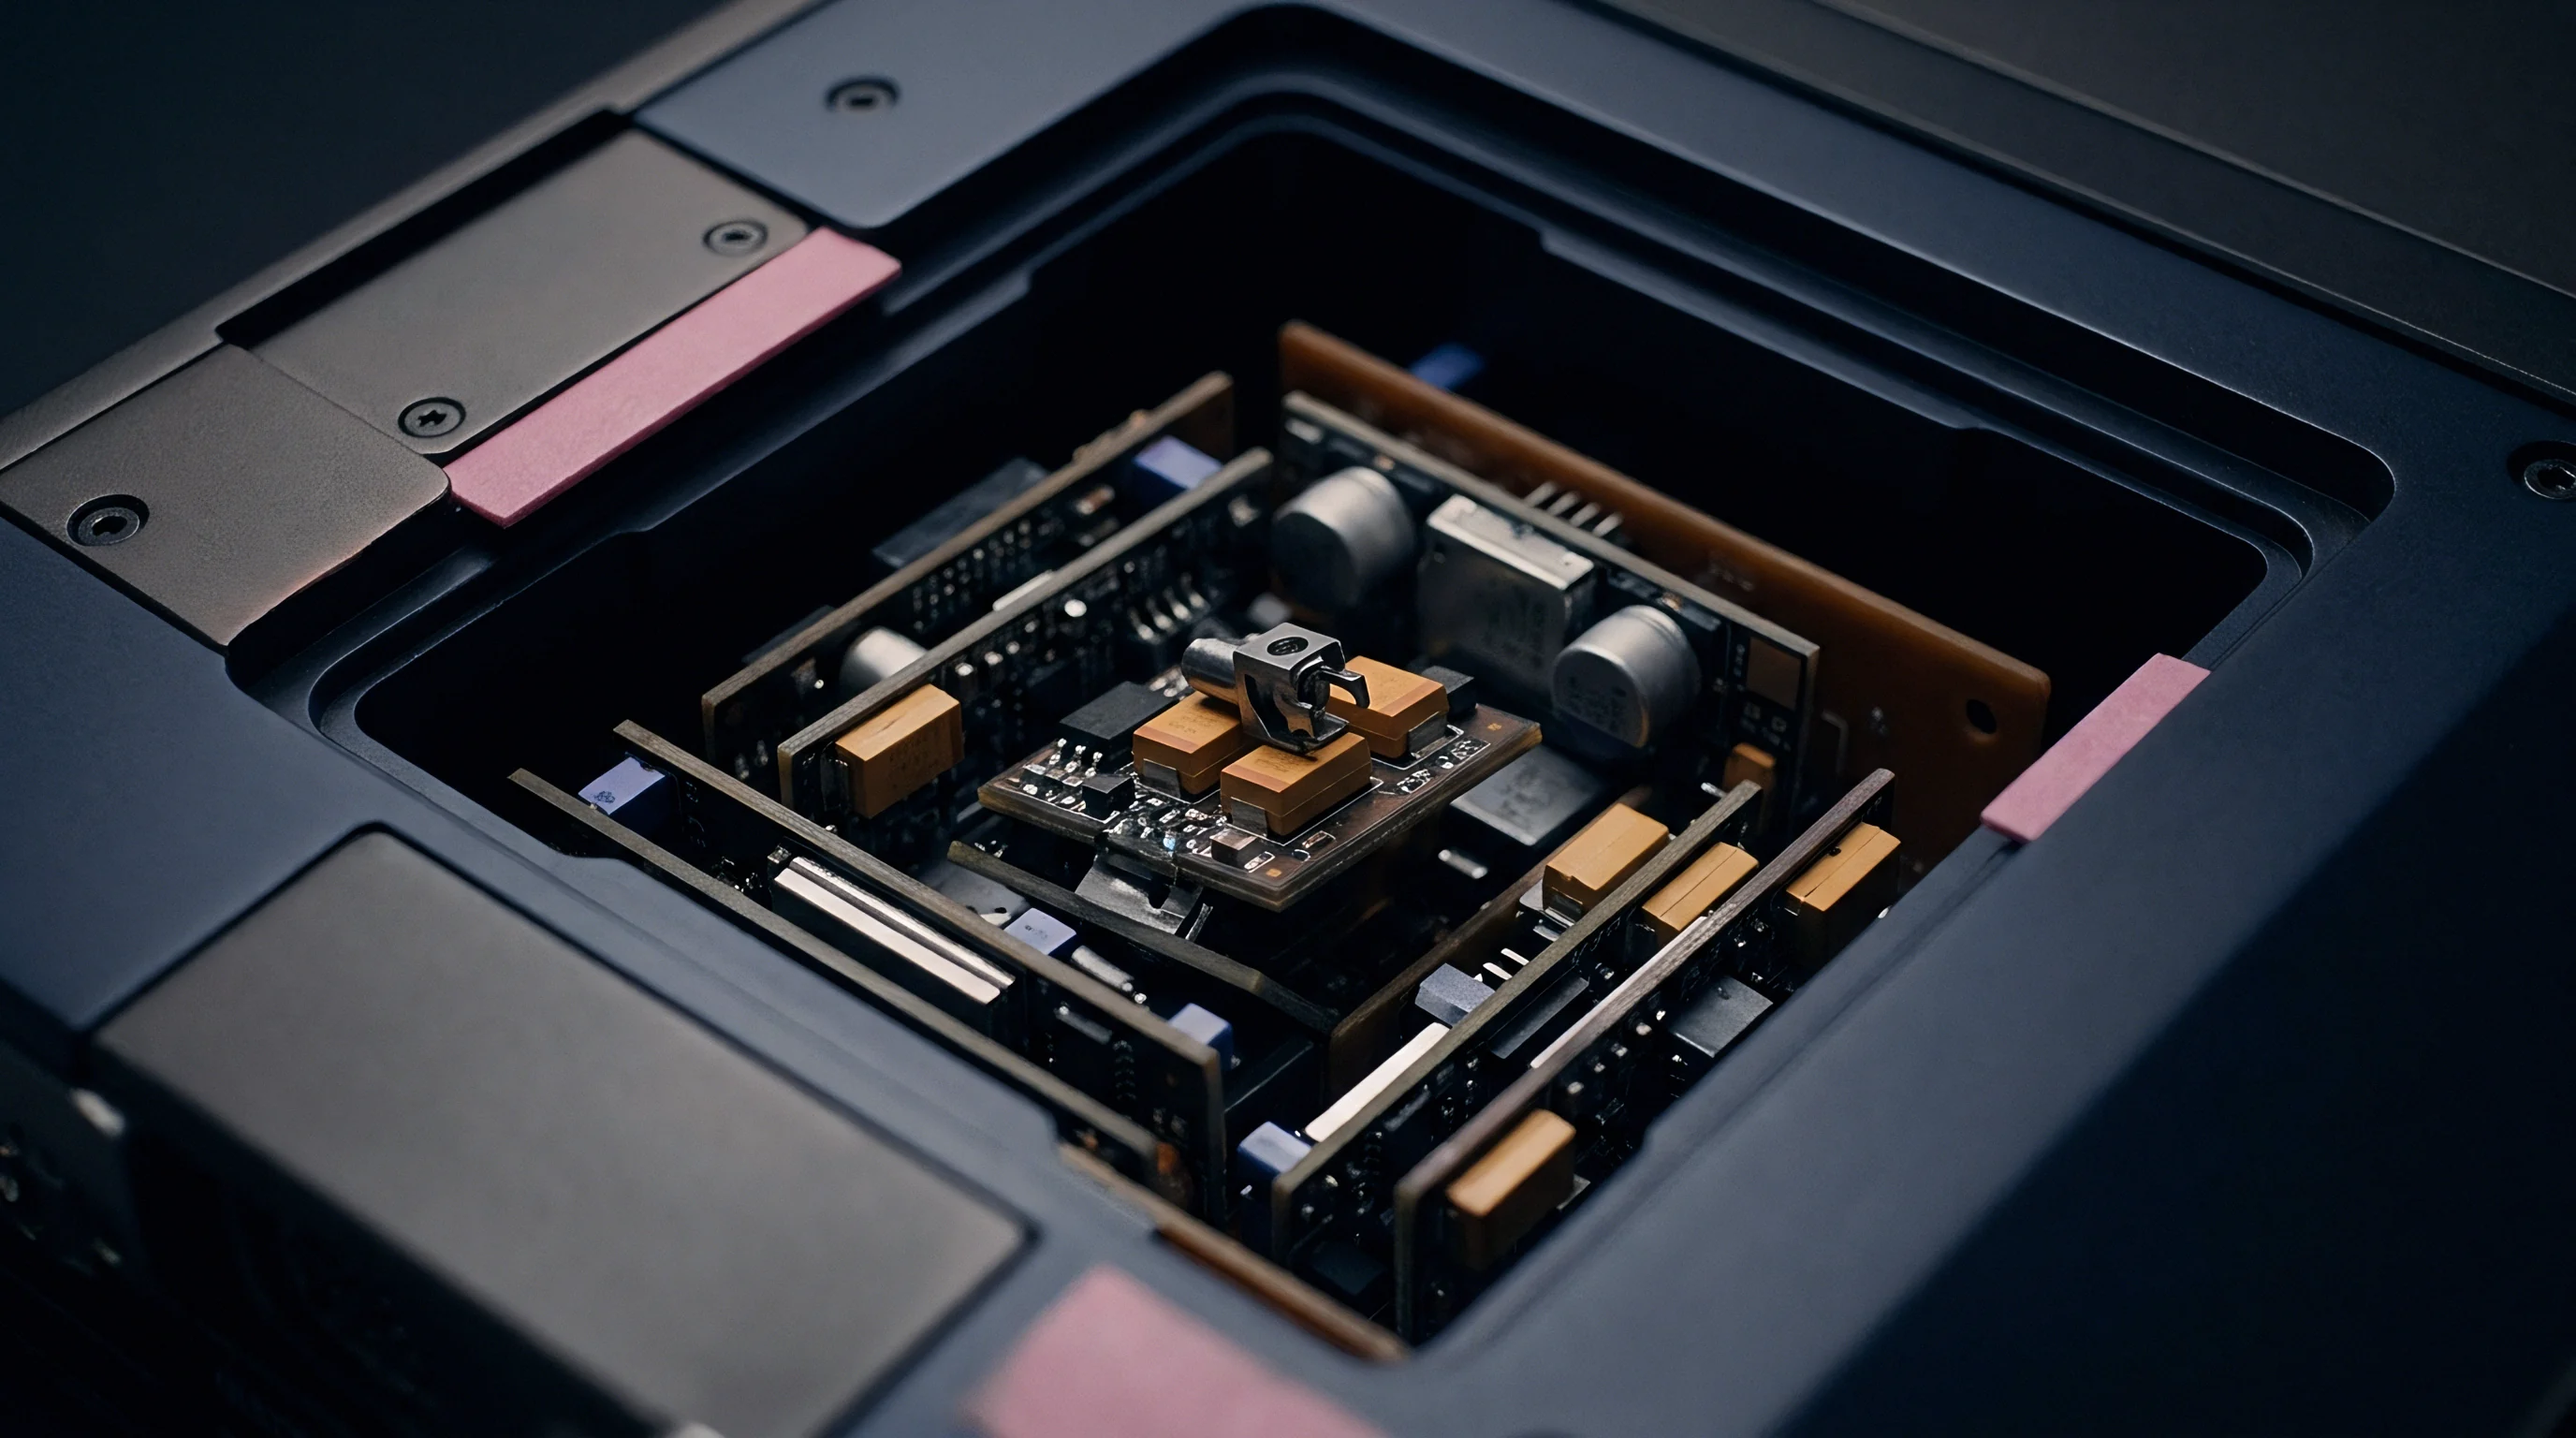
High-frequency piezoelectric transducers mounted on or behind cavity inserts pick up these mechanical pulses before macroscopic wear alters part dimensions or surface finish.
Acoustic energy transmission depends on material acoustic impedance, interface pressure, and physical distance between the degradation site and the sensor. Tool steel alloys such as 1.2343 (H13) and 1.2083 (420 stainless steel) display acoustic shear wave speeds near 3,200 meters per second and longitudinal wave speeds exceeding 5,900 meters per second. Micro-cracks, surface micro-chipping, and tribofilm disruption produce transient rise times below one microsecond, emitting acoustic frequency spectra extending from 100 kilohertz to well above 1 megahertz.
Signal amplitude attenuates across internal tool interfaces, cooling line voids, and mechanical ejector pin clearances.
Sensor coupling directly governs wideband frequency response and signal fidelity. High-temperature piezoelectric ceramics, including modified lead zirconate titanate formulations or bismuth titanate elements, withstand cavity insert temperature variations reaching 180 degrees Celsius. Surface mounting behind cavity inserts requires controlled clamping pre-load, applied via precision threaded retention sleeves or wave springs, maintaining contact pressure above 15 megapascals.
Acoustic coupling pastes or silver-filled foil interlayers eliminate air gaps at the tool insert boundary. Direct physical bonding through physical vapor deposition of zinc oxide or aluminum nitride piezoelectric thin films onto the rear face of cavity inserts provides direct acoustic path coupling, eliminating boundary attenuation losses entirely.
Transient acoustic stress waves propagate through hardened tool steel substrates without measurable frequency distortion up to two megahertz.
Different physical degradation modes inside precision mold cavity inserts generate distinct transient acoustic signal signatures during injection, packing, and ejection phases:
- Asperity Shearing Events emit continuous, low-amplitude acoustic emissions across the 100 to 250 kilohertz spectrum during melt filling, corresponding to localized micro-friction along tool cavity walls.
- Micro Chipping Incidents generate high-amplitude, short-duration burst acoustic emission signals with rise times under five hundred nanoseconds and dominant frequency peaks between 400 and 700 kilohertz.
- Subsurface Micro Cracking produces high-frequency burst trains exceeding 800 kilohertz prior to surface material loss in tool steel or tungsten carbide inserts.
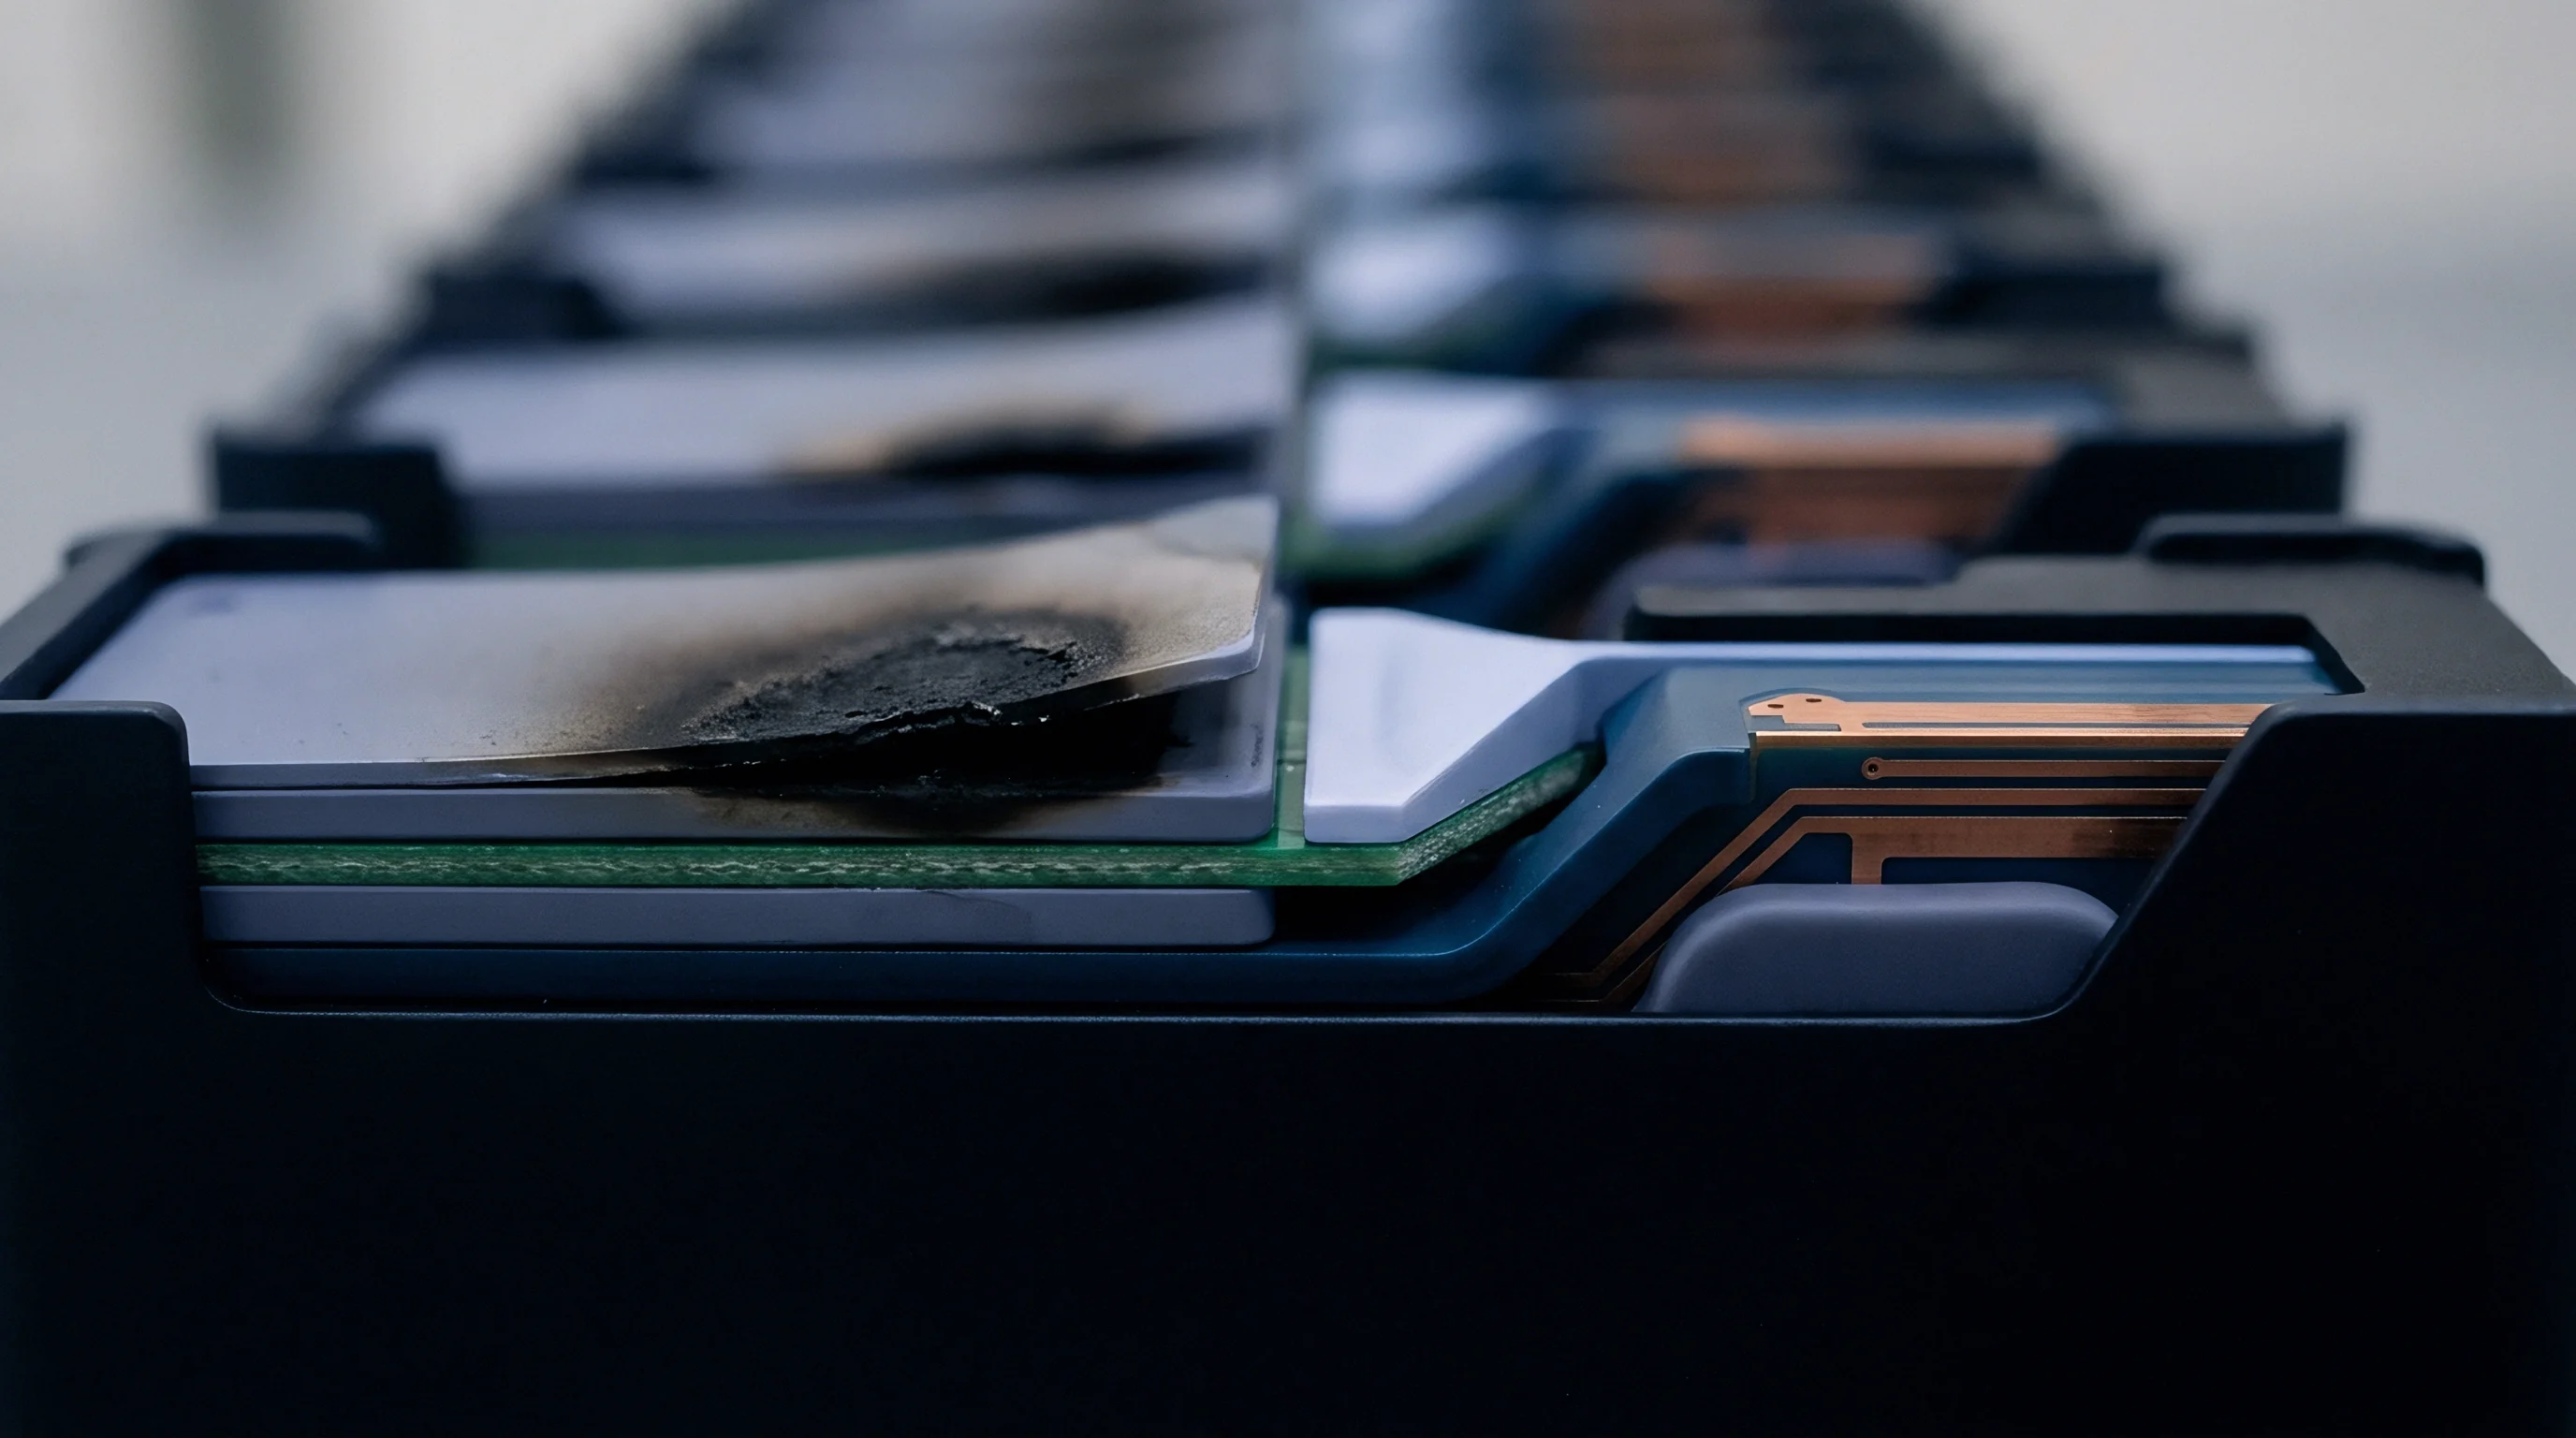
- Coating Delamination Events in physical vapor deposition coatings release discrete acoustic burst signatures with steep ringdown counts and broad spectral coverage between 300 kilohertz and 1.2 megahertz.
Cavity geometry and insert mounting arrangements define the physical acoustic transmission paths available to the sensor. Waveguides manufactured from hardened steel or sapphire rods transmit acoustic energy from restricted insert locations to externally mounted transducers, though signal reflection and attenuation increase across every physical waveguide joint. Direct sensor integration behind the cavity insert yields optimal signal-to-noise ratios, though required tooling modifications increase upfront cost.
Placing transducers closer to high-wear tool features improves signal amplitude while reducing transmission distance across internal mold plate boundaries.
Filter
Raw acoustic signals from cavity inserts require specialized analog conditioning and digital signal processing to separate micro-scale wear events from industrial press noise. Mechanical press operation generates low-frequency acoustic energy from hydraulic pumps, servo motor drives, mold clamping toggles, and mechanical ejector movements. These mechanical noise sources concentrate energy below 80 kilohertz.
Preamplifiers located within thirty centimeters of the sensor apply analog high-pass filtering with roll-off characteristics exceeding 40 decibels per decade to reject mechanical press interference.
What Signal Metrics Isolate Cavity Micro Wear?
Extracted acoustic features allow continuous evaluation of tool insert condition across production cycles. Root Mean Square energy metrics track average friction levels during the injection stroke, whereas burst features capture discrete material fracturing events. Digital signal processors compute feature values in real time using dedicated hardware blocks within field programmable gate arrays or high-speed microcontroller units.
| Degradation Mode | Frequency Band (kHz) | Dominant Feature Metric | Signal Character | Noise Discrimination Strategy |
|---|---|---|---|---|
| Adhesive Micro Sliding | 100 ~ 250 | RMS Voltage Energy | Continuous low level | Time-windowing during injection stroke |
| Abrasive Asperity Shearing | 200 ~ 450 | Cumulative Energy Rate | Semi-continuous pulses | High-pass analog filtering at 150 kHz |
| Coating Micro Delamination | 300 ~ 700 | Peak Amplitude & RDC | High-amplitude bursts | Threshold triggering above press background |
| Subsurface Micro Cracking | 500 ~ 1100 | Ringdown Count (RDC) | Ultra-short transient bursts | Bandpass digital filter (500-1000 kHz) |
| Press Hydraulic Shock | 5 ~ 60 | Peak Voltage | High-amplitude impact | Hardware analog high-pass filtering |
Time-domain feature extraction isolates transient burst events from background friction energy. Threshold detection algorithms establish dynamic baseline levels based on the running average of prior acceptable molding cycles. Ringdown counts measure the number of times the filtered acoustic emission waveform crosses a defined voltage threshold within a specified time window, while peak amplitude identifies maximum localized strain energy release.
Energy metrics, calculated by integrating the squared voltage signal over specific injection cycle segments, track cumulative mechanical work transferred through surface friction and material fracture, though these baseline values drift over time.
Digital bandpass filtering between 150 kilohertz and 750 kilohertz removes press mechanical noise while preserving micro-wear burst transients at a sample rate of 5 megasamples per second.
Digital front-end hardware requires precise operational sequencing during each molding cycle to prevent false triggers from press mechanical actions:
- Preamplification Stage Calibration matches sensor charge output to the input range of the analog-to-digital converter using low-noise differential amplifiers with configurable gain up to 60 decibels.
- Hardware Analog Filtering applies a 4th-order Butterworth bandpass filter to suppress low-frequency structural noise and prevent aliasing before signal digitization.
- Molding Cycle Synchronization gates signal acquisition using machine interface signals such as mold closed, injection start, and cavity pressure threshold triggers.
- Real-Time Feature Computation extracts RMS energy, peak amplitude, and ringdown counts across discrete cycle windows corresponding to filling, packing, and cooling phases.
- Dynamic Threshold Comparison evaluates extracted features against baseline statistical limits to identify micro-scale tool wear events during production.
Processors combine time-domain features with frequency-domain transforms to distinguish tool wear from polymer flow anomalies. Fast Fourier transforms and short-time Fourier transforms convert discrete burst signals into spectral density profiles. Abrasive glass fiber filler wear in engineering plastics such as polybutylene terephthalate produces broad-spectrum continuous emission, whereas micro-cracking in physical vapor deposition coatings generates localized spectral peaks above 400 kilohertz.
Joint time-frequency analysis isolates transient wear events occurring simultaneously with high-speed resin filling, preventing unfiltered noise from triggering false alarms.
General-purpose vibration sensors mounted on external mold plates are sometimes used to detect insert wear, but internal steel interfaces and cooling channels introduce severe signal attenuation and frequency distortion that limit their effectiveness.
Kinetics
Tool steel wear progression follows distinct mechanical phases that manifest directly in acoustic energy rate curves. Initial running-in wear involves the rapid shearing of surface micro-asperities left by machining operations such as wire electrical discharge machining or precision grinding. This phase exhibits moderate acoustic energy rates that decline as contact surfaces smooth out.
Steady-state wear succeeds running-in, characterized by uniform low-amplitude continuous acoustic emissions and low burst counts over thousands of molding cycles. Phase transition to accelerated micro-wear occurs when subsurface shear stresses induce fatigue micro-cracking or coating failure.
Micro-wear rate kinetics inside precision mold cavity inserts correlate directly with cumulative acoustic emission energy rates. The volume loss rate of cavity insert material connects to the acoustic energy generation rate through mechanical energy conversion factors. Micro-chipping events along sharp cavity edges, tool parting lines, or micro-textured surfaces release stored elastic strain energy proportional to the fractured crack volume.
Accumulation of high-amplitude burst events heralds the onset of visible tool wear long before dimensional tolerance limits are exceeded on molded components.
ISO 2859 acceptance sampling fails to detect initial micro-wear transitions on cavity inserts, whereas inline acoustic burst counting identifies coating breakdown forty thousand cycles prior to dimensional flash formation.
Coating integrity on cavity inserts dictates tool service life in highly abrasive or corrosive molding environments. Physical vapor deposition coatings, including chromium nitride, titanium aluminum nitride, and diamond-like carbon, maintain low friction coefficients and high hardness. Micro-crack initiation within thin coatings generates ultrasonic burst signatures due to rapid stress relaxation.
Delamination at the coating-substrate interface releases high-energy acoustic pulses with steep rise times, indicating localized coating loss before resin adheres to exposed tool steel.
Selecting operational parameters and monitoring criteria requires systematically mapping physical tool wear mechanisms against observable signal characteristics:
- Abrasive Wear Transitions cause steady increases in continuous RMS acoustic energy during the high-velocity resin injection stroke, indicating surface micro-scratching from glass fibers or mineral fillers.
- Adhesive Material Transfer produces erratic acoustic emission spikes during component ejection as resin debris or degraded polymer deposits adhere to cavity insert walls.
- Micro Fatigue Cracking generates localized burst events with dominant frequencies above 500 kilohertz, concentrating around sharp corners and high-stress tool geometries.
- Parting Line Erosion manifests as repeated acoustic burst sequences during the final mold clamping phase as micro-burrs and flash crush between mating insert faces.
Injection process variables influence wear kinetics and acoustic signal amplitude. Higher melt injection speeds increase wall shear stress and filler particle impact velocity, elevating continuous acoustic energy generation rates. Mold cavity temperature variations alter resin viscosity and interface friction dynamics, shifting the baseline acoustic energy level.
Glass fiber content in materials such as polyamide 66 accelerates abrasive wear kinetics, shifting the wear curve transition point to earlier cycle counts.
Whether real-time acoustic signal parameters can reliably predict remaining cavity insert life under variable resin lot viscosity without periodic baseline recalibration remains open to empirical study across different tool geometries.
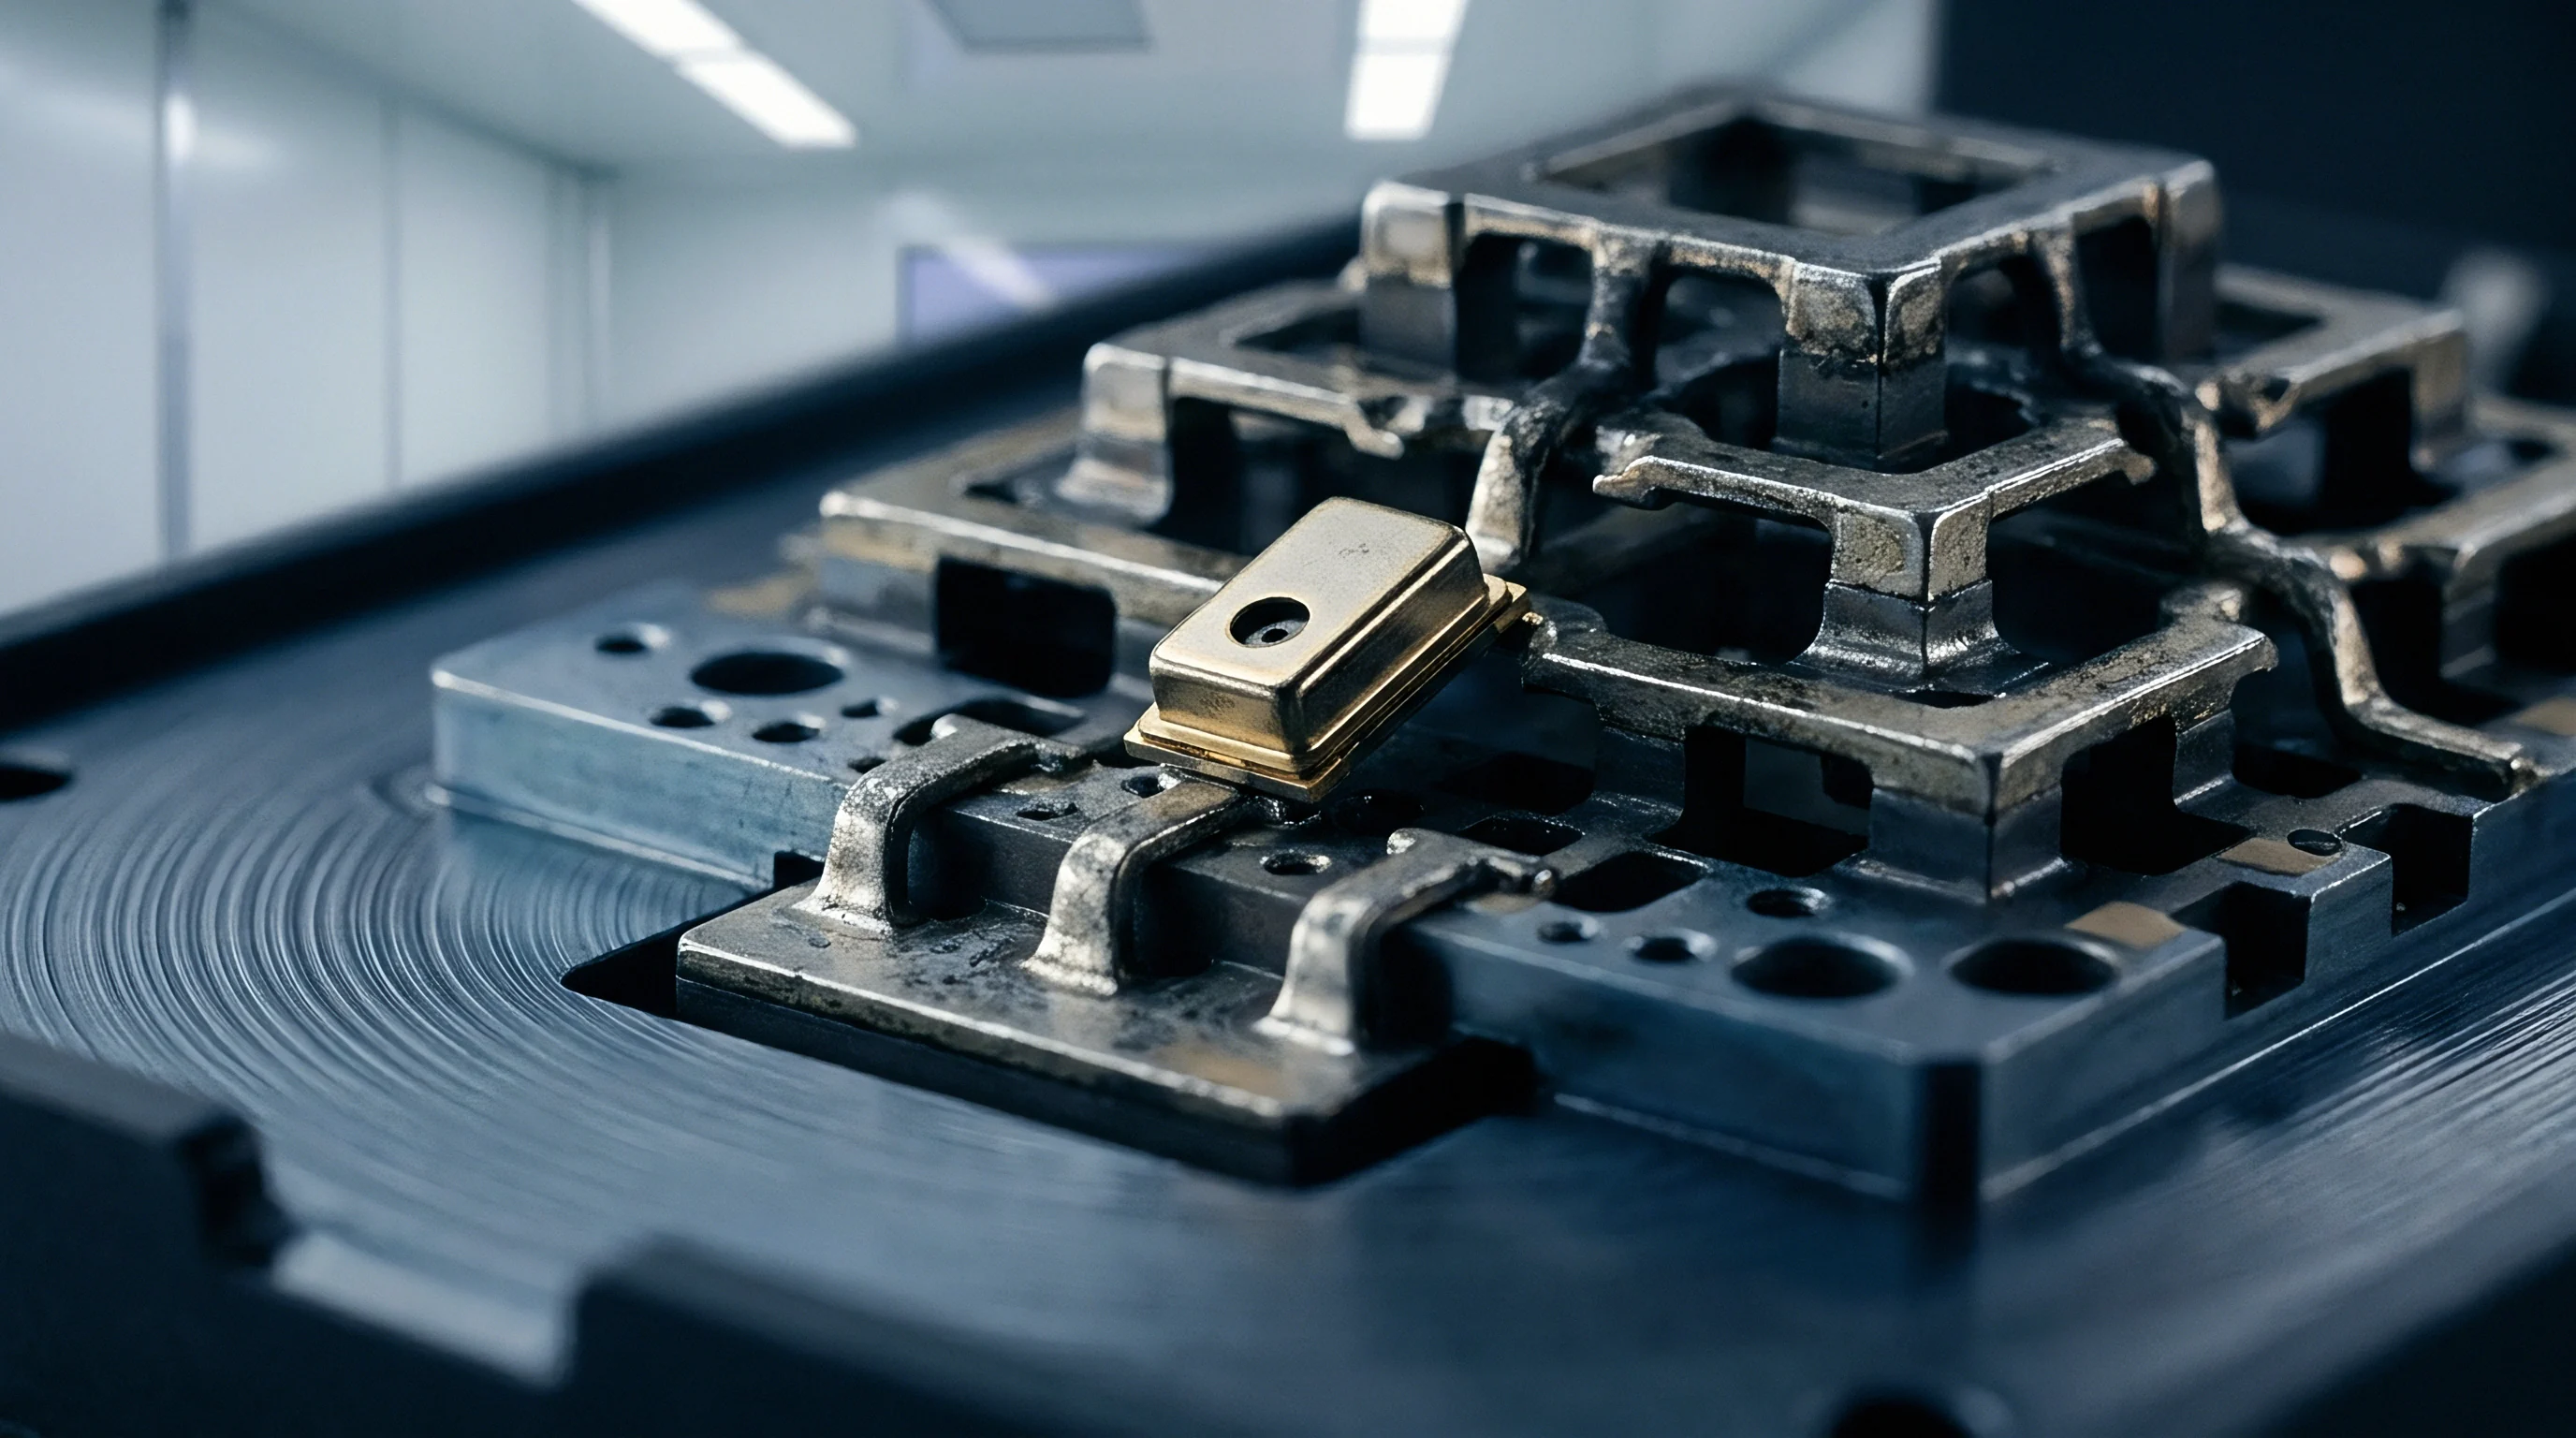
Scope
Implementing inline acoustic emission detection for cavity insert wear requires precise boundary definition across hardware, firmware, and signal processing architecture. Sourcing options range from complete turnkey commercial monitoring systems to custom embedded sensor-conditioning module designs integrated directly into the mold base or press controller. Turnkey commercial systems offer rapid installation but limit access to raw high-frequency signal data and custom feature extraction algorithms.
Custom hardware designs grant complete ownership over schematics, firmware, and signal analytics, lowering per-unit production costs across high-volume mold installations.
| Scope Layer | Turnkey System | Semi-Custom Module | Custom Embedded Board |
|---|---|---|---|
| Sensor Hardware | Commercial PZT package | Standard piezo element | Custom PVD film / raw piezo ceramic |
| Signal Conditioning | Enclosed fixed preamplifier | Custom gain stage board | Integrated differential charge amp |
| Analog Front End | Proprietary enclosed DAQ | Evaluation DAQ module | Dedicated FPGA / high-speed ADC design |
| Firmware & DSP | Compiled binary, locked | Vendor library, parameter access | Full C/VHDL source code ownership |
| NRE Cost Range | $2,000 ~ $5,000 | $15,000 ~ $35,000 | $60,000 ~ $120,000 |
| Unit Production Cost | $8,000 ~ $15,000 | $2,500 ~ $5,000 | $400 ~ $900 |
Non-recurring engineering fees reflect the scope of design transfer and ownership boundaries. Developing a dedicated signal acquisition board with multi-channel simultaneous sampling at 10 megasamples per second requires specific analog shield design, PCB stack-up design for noise isolation, and FPGA firmware development. Higher upfront engineering expenses reduce per-mold electronics unit costs for medical device or automotive connector molders deploying sensors across dozens of press lines while reducing module footprint.
Firmware architecture and algorithm IP ownership determine long-term vendor dependency. Turnkey system vendors retain proprietary algorithms for signal filtering and feature extraction, delivering output metrics over industrial fieldbus networks without providing raw time-series data. Custom embedded scopes require explicit delivery of uncompiled C code, FPGA register maps, hardware schematics in native EDA formats, and bill-of-materials documentation with second-source component definitions.
Proprietary firmware locks prevent modification of acoustic trigger thresholds and hide raw high-frequency time-series data required for advanced wear classification.
Evaluating design transfer packages for embedded acoustic signal conditioning hardware follows a structured verification sequence:
- Review complete hardware schematic files, PCB layer stack-up documentation, and fabrication outputs in Gerber X2 or IPC-2581 formats.
- Inspect uncompiled source code for onboard firmware, including DSP filter coefficients, feature extraction routines, and fieldbus communication stacks.
- Verify component bill-of-materials documentation, confirming second-source availability for active high-speed operational amplifiers and analog-to-digital converters.
- Examine manufacturing test specifications, calibration procedures, and automated test jig designs used for factory unit validation.
- Validate mechanical enclosure drawings, sensor retention mounting specifications, and thermal dissipation calculations for high-temperature mold environments.
Misaligning integration scope boundaries leads to unbudgeted development expenses, schedule delays during mold bring-up, locked proprietary firmware that prevents algorithm updates, and complete loss of second-sourcing flexibility when production scales across multiple manufacturing sites.
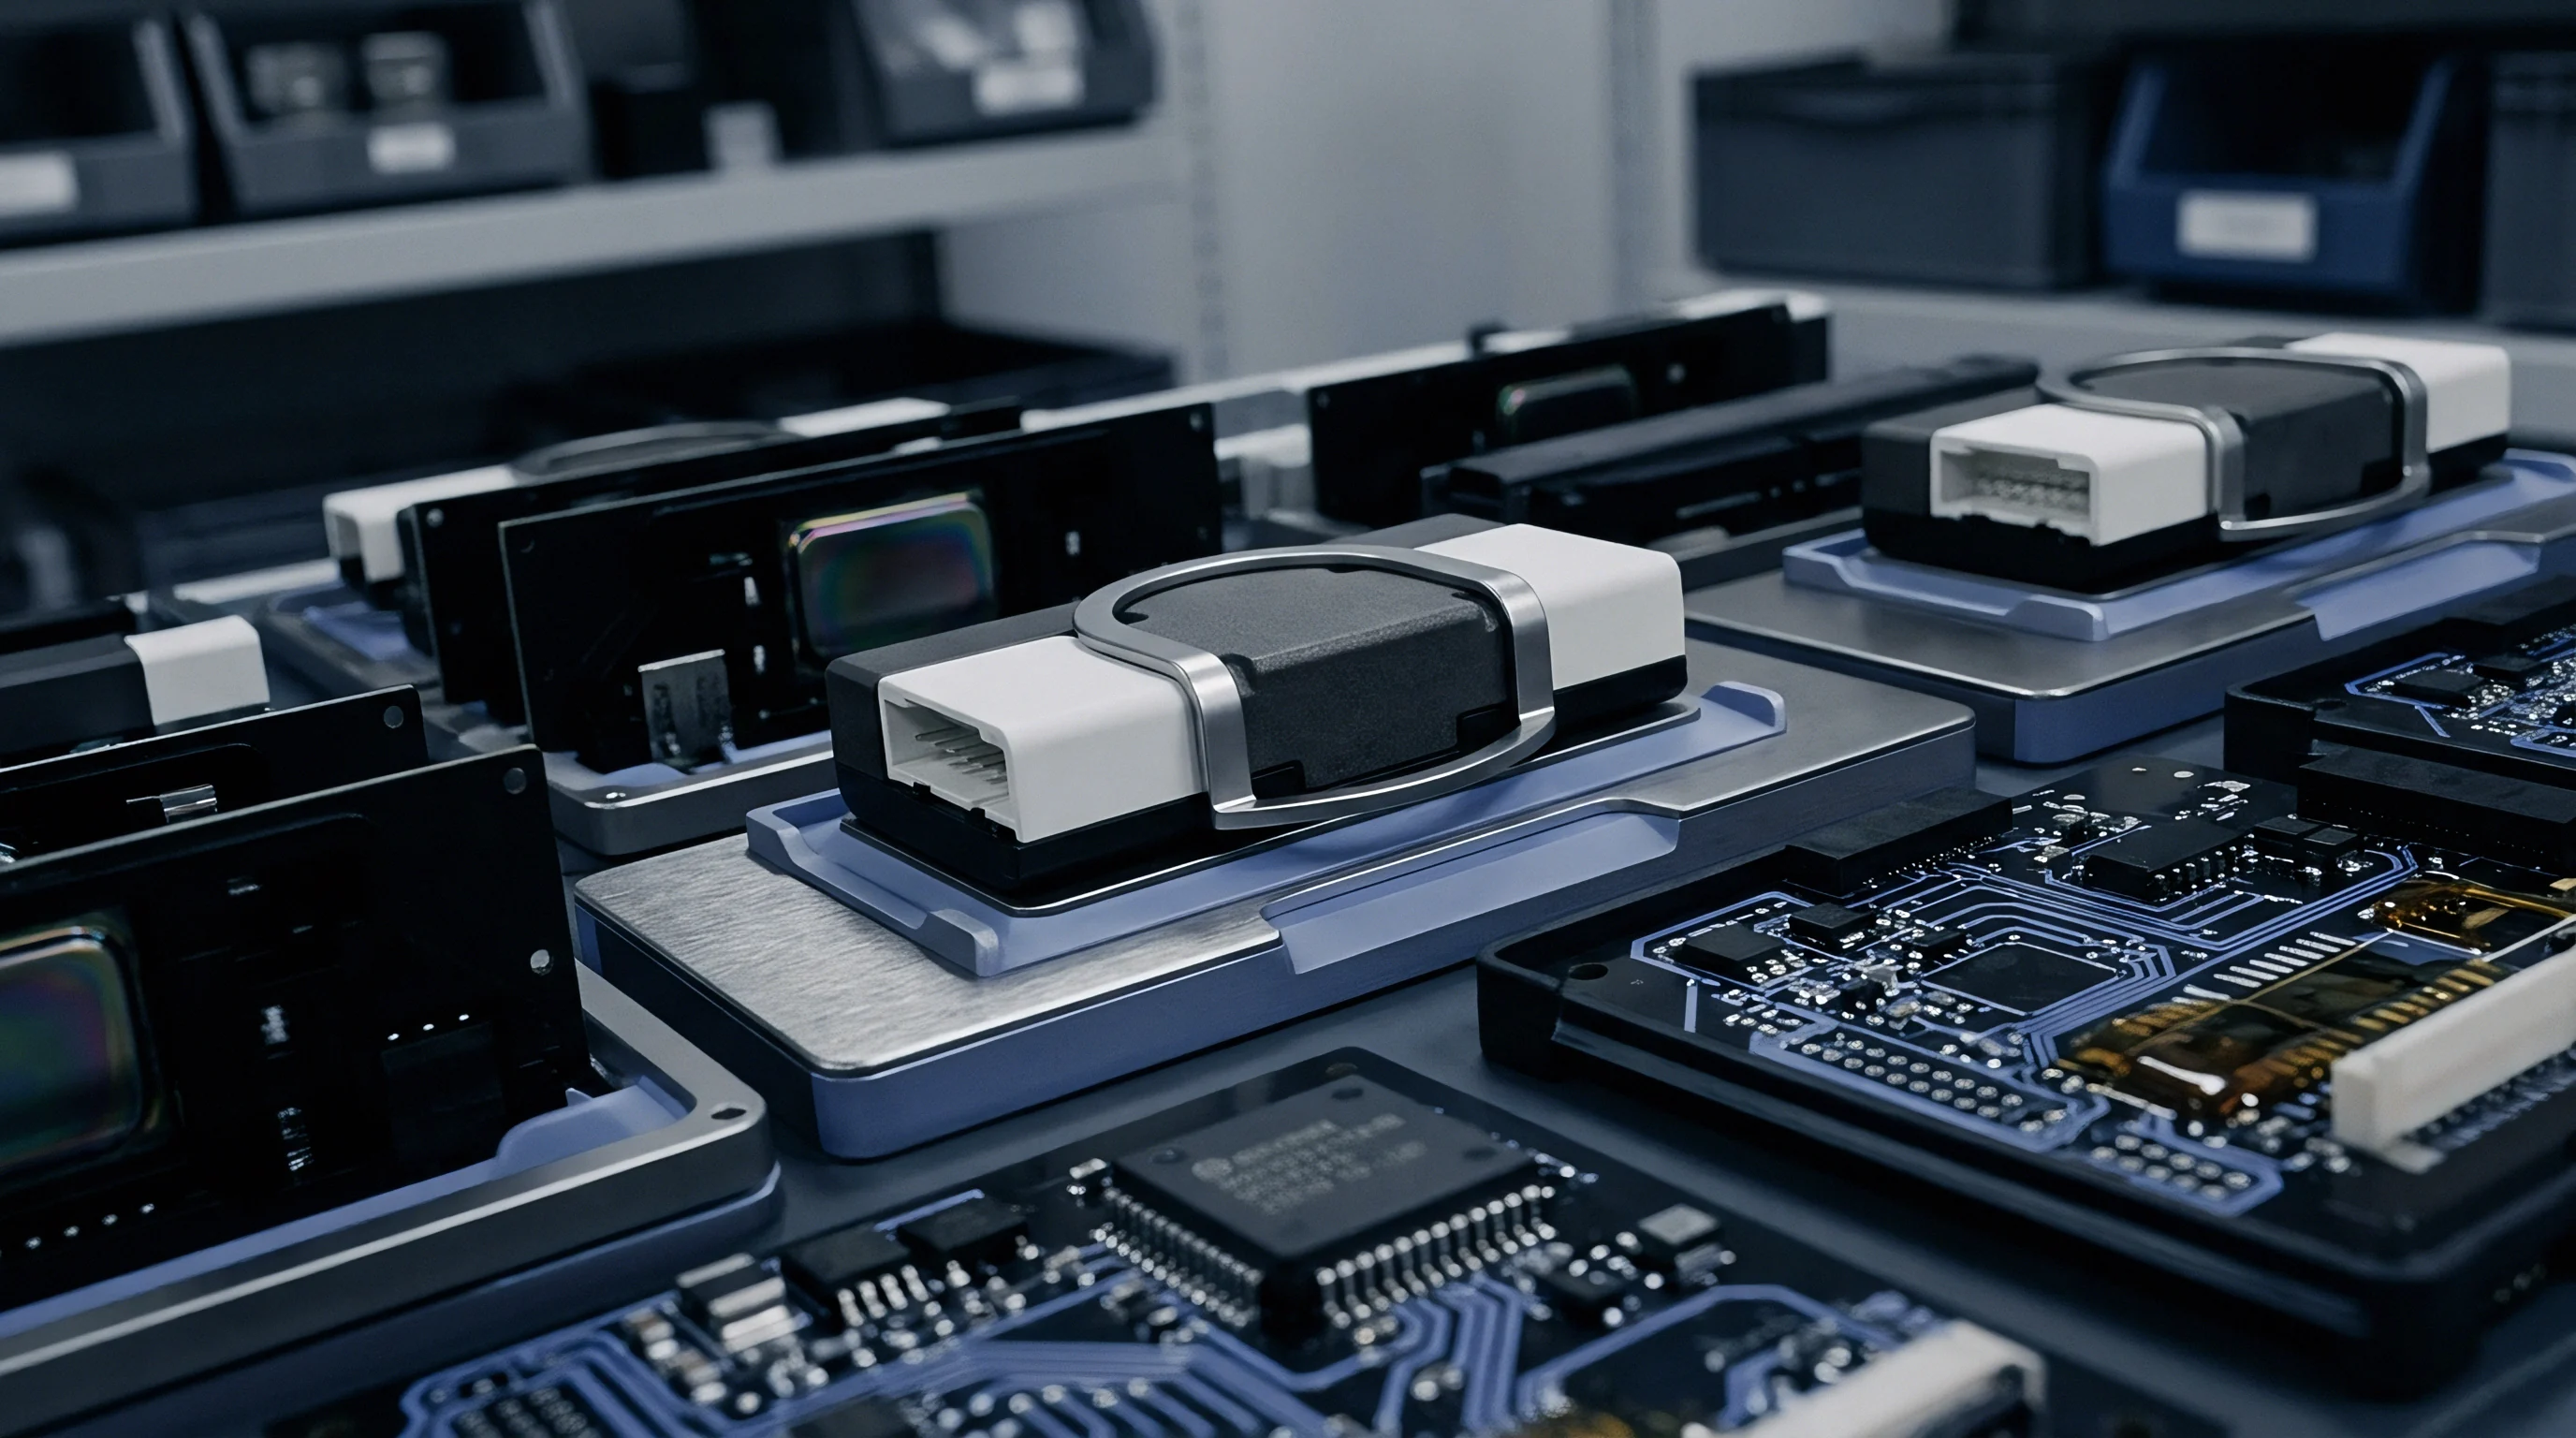
Bench
Acceptance testing and sensor calibration establish a reliable baseline for inline cavity wear monitoring systems before mold qualification runs start. The ASTM E976 standard provides guidelines for determining repeatability of acoustic emission sensor response using pencil lead break testing, also known as the Hsu-Nielsen source. Breaking a 0.5 millimeter 2H pencil lead at a 30-degree angle against the cavity insert surface generates a repeatable stress impulse.
Transducer installation verification requires consistent peak amplitude and rise time measurements across multiple test breaks across the insert face.
Waveguide continuity and acoustic coupling integrity require systematic verification before tooling commissioning. Signal attenuation testing measures stress wave loss from the cavity insert face to the sensor mounting location using artificial acoustic sources. Coupling pressure verification ensures that threaded retention sleeves or wave springs maintain required force levels, preventing acoustic signal loss during thermal cycling from cold mold conditions to operational temperatures above 140 degrees Celsius, where thermal expansion alters contact pre-load.
Factory acceptance procedures demand complete documentation of preamplifier gain calibration, frequency response curves, and noise floor baselines under real machine operating conditions. Preamplifier gain curves must remain flat within plus or minus one decibel across the target frequency band of 100 kilohertz to 1 megahertz. Environmental noise testing identifies external EMI and electrical press noise coupled through sensor cables, requiring double-shielded twisted-pair wiring and differential signal routing.
Quality agreements and design transfer contracts specify part change notification requirements for sensor electronics and signal conditioning modules. Supplier change control clauses under ISO 9001 and IATF 16949 mandate written approval prior to modifying piezo ceramic suppliers, preamplifier component layouts, sensor potting encapsulation compounds, or embedded filtering software algorithms, ensuring consistent long-term wear detection accuracy.