Establishing Stable Control Limits Following High Speed Line Tooling Changes
Stable control limits post-tooling change require thermal break-in stabilization, 25 subgroup sampling, and short-term capability proof before sign-off.
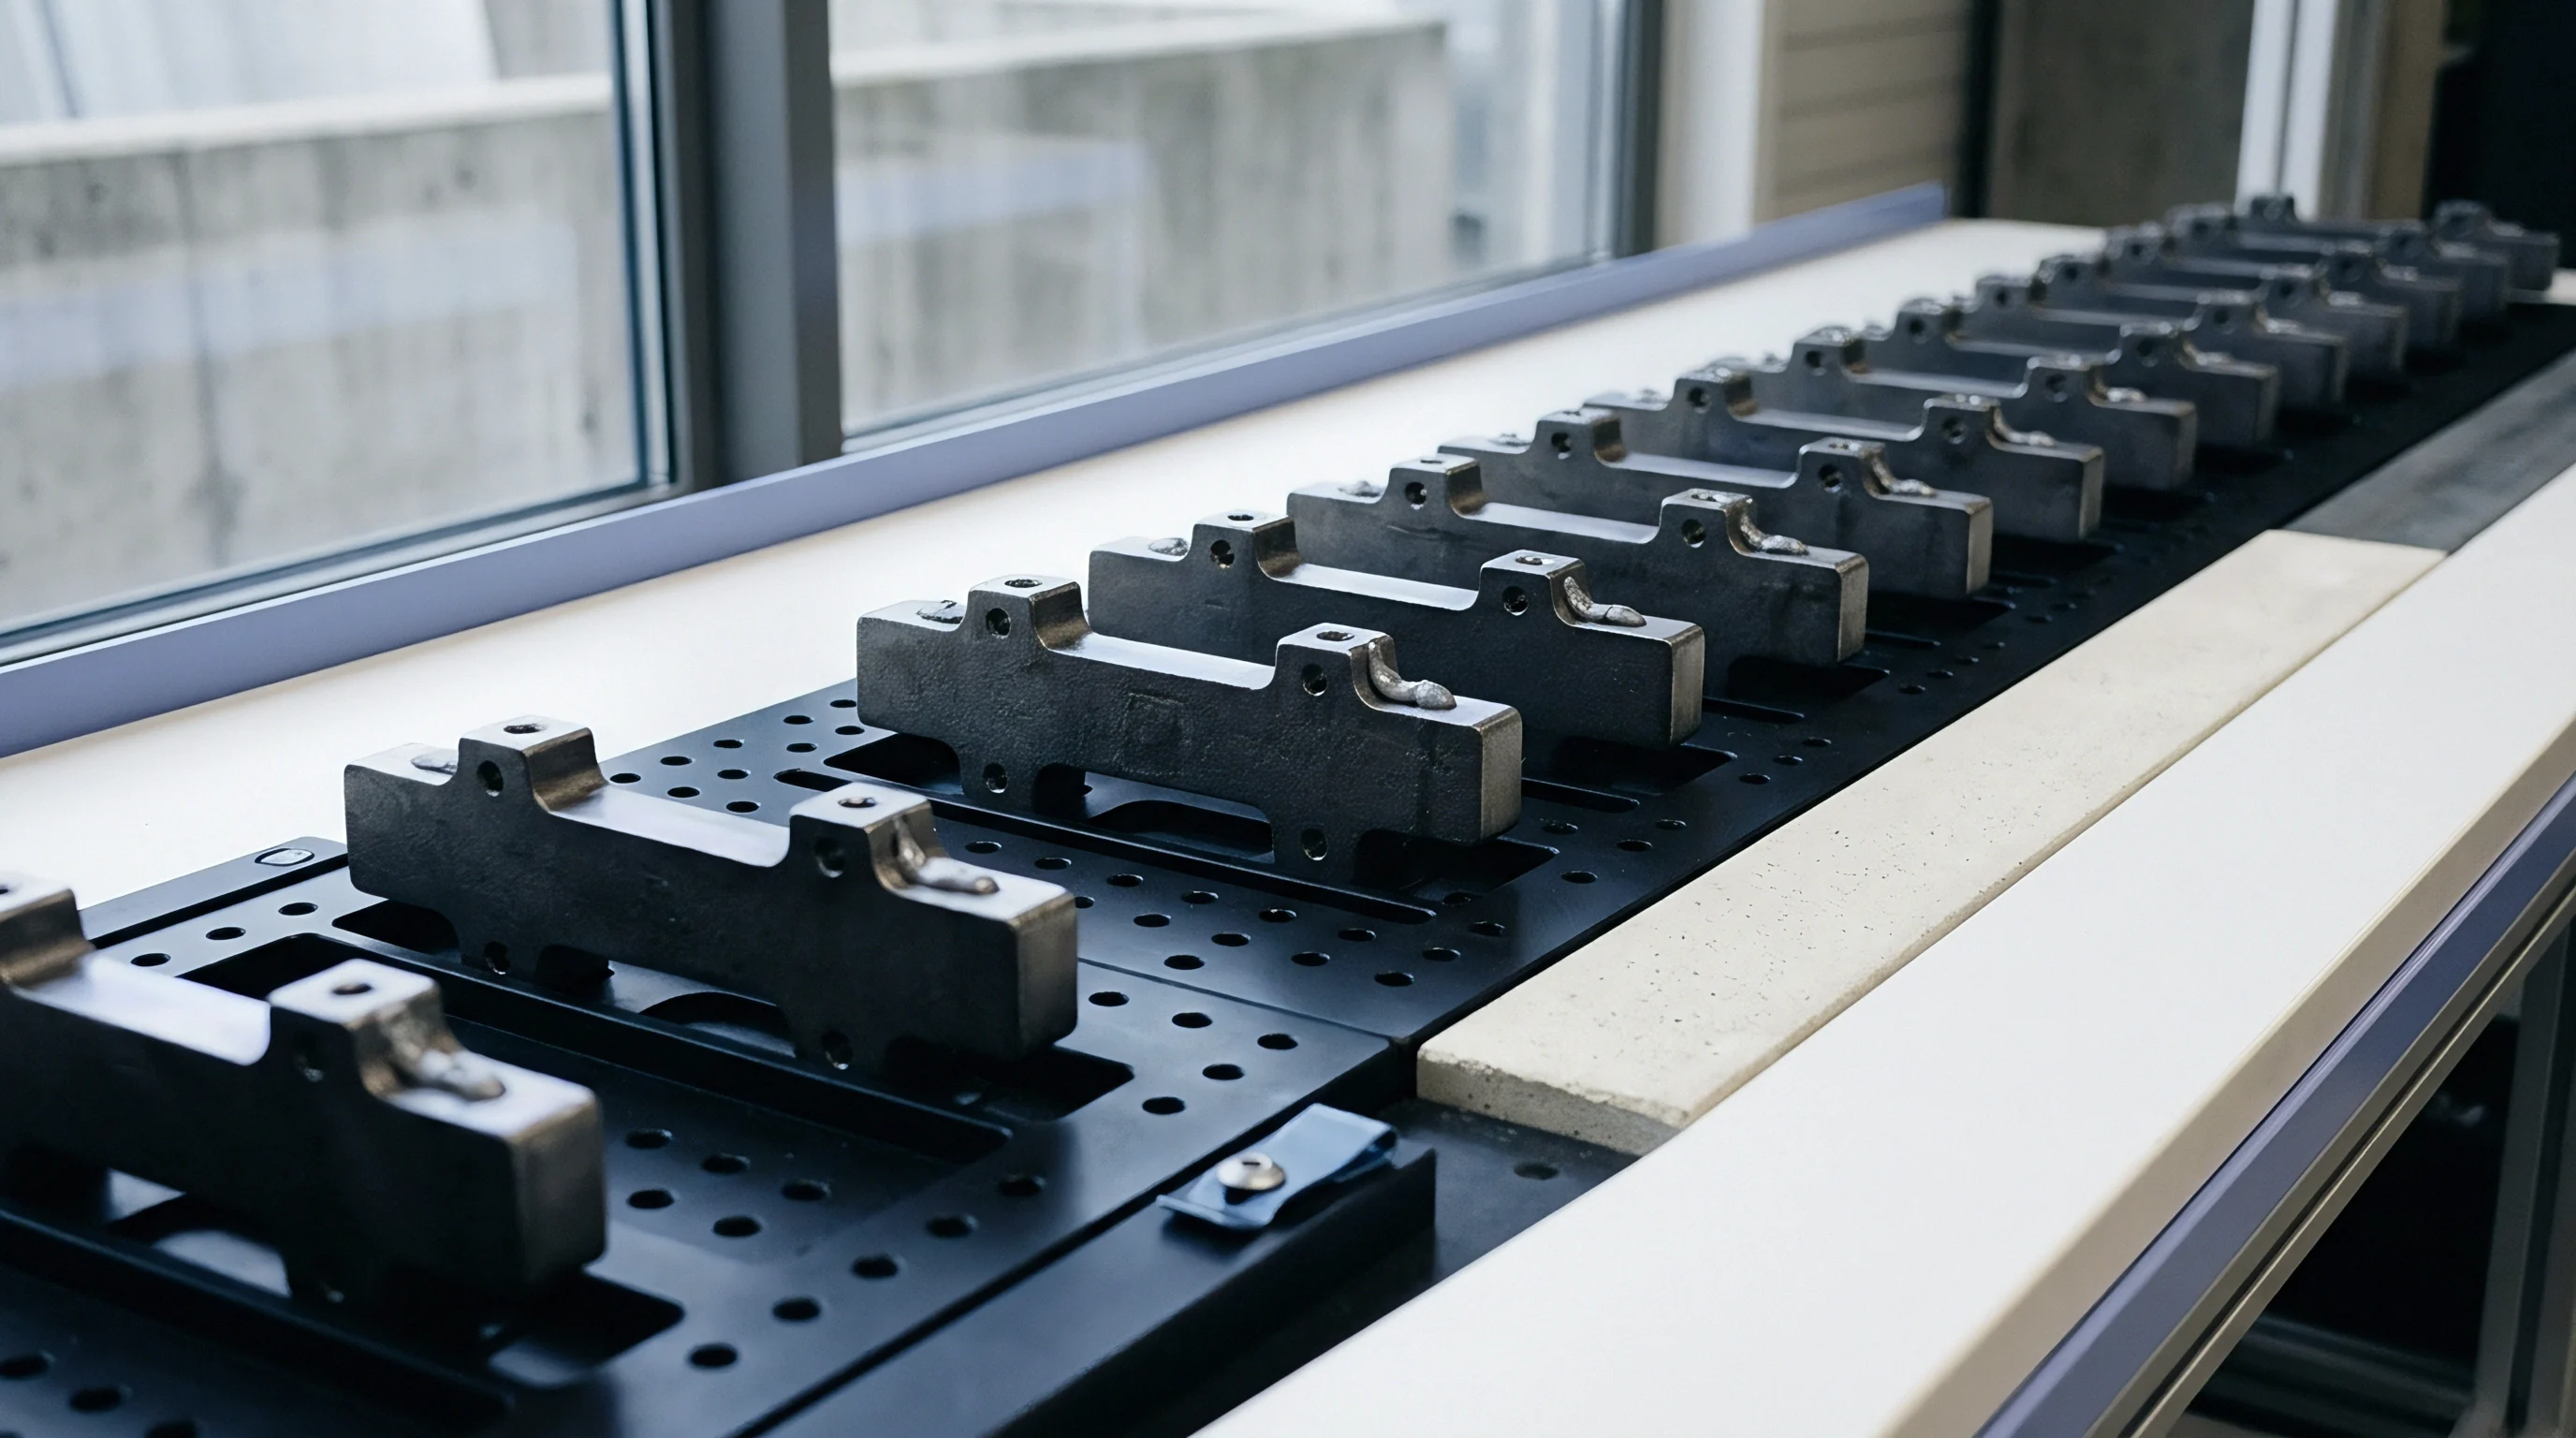
Wear
Replacing a punch, die, or core pin on a line running at eight hundred strokes per minute alters the dynamic geometry of the mating interface. Contact surfaces experience immediate mechanical seating and intense localized friction during initial operation. Thermal expansion shifts critical clearances across the first several thousand production cycles before reaching steady-state heat dissipation.
Line operators who freeze control limits using pre-change statistical baselines trigger false alarm rates exceeding thirty percent across the first shift.
High press speeds directly increase friction across tooling contacts.
High-speed contact produces rapid initial friction along unpolished mating tooling edges. Tooling steel expands under load, altering workpiece dimensions along the primary axis of displacement. Process variance during this break-in phase reflects mechanical seating rather than true special-cause instability, so establishing permanent statistical process control boundaries during this window misstates natural process capability.

Mechanical Settling and Thermal Equilibrium Windows
Continuous stroke rates generate friction that raises die body temperature from ambient room conditions to operating levels between sixty and ninety-five degrees Celsius. Hydraulic clamping pressure and high-velocity metal displacement distort component alignment until internal temperatures reach steady state. Data gathered during the first three thousand strokes captures thermal expansion rather than repeatable machine precision.
Tooling temperature rises by thirty-five degrees Celsius across the first two thousand strokes, expanding punch diameter by nine micrometers before stabilization.
Thermal drift takes time to achieve steady equilibrium.
Different tooling materials exhibit distinct break-in durations before dimensional movement stops. Tungsten carbide punches require fewer cycles to stabilize thermally compared to D2 tool steel inserts, though carbide exhibits sharper micro-fracturing risks during initial alignment checks. The table below outlines typical thermal stabilization windows and initial wear behavior across common high-speed tooling materials under continuous production loads.
| Tooling Substrate | Stroke Speed Range (SPM) | Cycles to Thermal Equilibrium | Initial Dimensional Drift (μm) | Dominant Break-In Failure Mode |
|---|---|---|---|---|
| D2 Tool Steel | 300 – 500 | 4,500 | 12 – 18 | Edge micro-chipping |
| A2 Tool Steel | 200 – 400 | 3,800 | 10 – 15 | Surface galling |
| Tungsten Carbide (12% Co) | 600 – 1,200 | 1,200 | 2 – 5 | Brittle edge spalling |
| CPM M4 Powder Metal | 500 – 900 | 2,500 | 6 – 10 | Adhesive wear transfer |
Die Clearance Shifts under Continuous High Stroke Velocity
Punch displacement relative to the die plate alters shear margin ratios on stamped metal contacts or injection mold parting line shut-offs. High stroke speeds reduce oil film thickness across wear plates, increasing friction until lubrication channels establish uniform fluid pressure. Standard operating procedures requiring immediate capability qualification after tool installation produce invalid process capability indices due to this transient mechanical bed-in period.
Tooling wear directly drives shifts in the process mean.
Unadjusted statistical boundaries set immediately following a die change generate unnecessary line halts when normal break-in drift crosses tight historical limits. Managing high-speed stamping or molding operations requires accounting for initial batch variance rather than treating early drift as abnormal material quality.
- Punch clearance decay alters burr height across metal stampings during the first two hours of continuous operation.
- Thermal cavity expansion causes initial volumetric overflow on thin-wall injection molded connector housings.
- Guiding post misalignment creates asymmetric edge wear across progressive die stations prior to complete clamping torque verification.
- Stripper plate deflection introduces dynamic pitch variation across high-speed carrier strips under full press tonnage.
Initial dimensional variance often falls within broad raw material batch allowances until five thousand press cycles complete.

Interval
Establishing control limits after line maintenance requires explicit separation between transient break-in sampling and long-term statistical monitoring. Sampling frequencies effective during steady-state production fail to catch early tool clamping shift or bed-in drift. Initial sampling protocols collect data in tight consecutive subgroups to isolate mechanical stabilization from raw material lot variance.
The choice of subgroup frequency governs how quickly shifts are detected.
High-speed lines producing five units per second generate three hundred parts per minute. Collecting five consecutive parts every hour samples less than one-tenth of one percent of total volume, missing rapid tooling shifts caused by loose punch retaining screws or thermal fluid leaks. Qualification protocols mandate aggressive initial subgroup selection schedules until process capability metrics demonstrate statistical stability.
Which Statistical Phase Handles Initial Tool Break-In?
Initial production post-tooling change operates under a provisional qualification phase using short-term subgrouping strategy. Standard practice deploys continuous subgroup collection of five consecutive parts every hundred cycles across the first two thousand cycles. This phase isolates tooling settling dynamics from broader long-term process variation.
ISO 22514-2 requires minimum subgroup counts of twenty-five with sample sizes of five to calculate preliminary process performance indices following major tool revisions.
Data gathered during the preliminary phase populates temporary individual-moving range charts or preliminary subgrouped mean and range charts. Line operators track short-term variation without updating permanent factory control limits. Once the process demonstrates statistical control across twenty-five consecutive subgroups, engineers calculate permanent baseline center lines and control boundaries.

Subgrouping Frequency and Sample Size Calibration
Rational subgrouping groups parts produced under identical machine conditions to minimize intra-subgroup variation while capturing inter-subgroup process shifts. High-speed tooling changes introduce immediate shift potential along die alignment pins, heat-affected zone profiles, and feeder strip indexing mechanisms. The step-by-step sequence below defines the subgroup calculation workflow for post-tooling verification.
- Isolate initial production by running the press at twenty-five percent rated operational velocity for two hundred strokes to confirm mechanical clearances and strip feed alignment.
- Increase press velocity to nominal production speed and allow the machine to run continuously for five hundred strokes without sampling to allow thermal stabilization.
- Extract twenty-five consecutive subgroups of five parts each at fixed intervals of one hundred strokes, marking each sample with exact stroke count and die cavity position.
- Measure critical feature dimensions using calibrated optical coordinate measuring machines or automated inline vision fixtures to four decimal places.
- Calculate subgroup average values and subgroup range values for each dimensional feature across all twenty-five collected datasets.
- Compute overall process average and mean range values to establish provisional center lines for control limit construction.
- Calculate provisional upper and lower control limits utilizing standard statistical constants corresponding to subgroup sample size.
Staying within tolerance limits is not the same as maintaining statistical control.
Setting limits based on engineering print tolerances rather than calculated process variance permits hidden tooling instability to propagate downstream. A process running within engineering drawing limits can still operate completely out of statistical control, indicating loose fixtures or worn guide bushings that will eventually break tooling.
Tooling replacement protocols mandate three distinct sampling frequency stages before full line sign-off.
Spread
Calculating upper and lower control limits demands rigorous mathematical separation of process spread from tooling setup error. Mean shifts indicate offset tooling setup or incorrect die height adjustment. Range expansion reflects mechanical looseness, vibration, or inconsistent strip feeding speed.
Control limit formulas convert sample standard deviation or average range into action thresholds that prevent premature operator intervention.
Using provisional limits helps prevent false alarms during initial runs.
Initial limit calculations rely on short-term data sets, expanding control boundaries to account for small sample size uncertainty. As production volume accumulates, limit calculations transition from wide preliminary bands to narrow, stable control thresholds that reflect true baseline repeatability. The mathematical relationship between sample size, range average, and control limits governs this transition.
Calculating Short-Term Capability and Provisional Limits
Consider a high-speed progressive stamping press producing terminal pins following replacement of a primary bend punch. The quality engineer collects twenty-five subgroups of five parts each (k = 25, n = 5). Measurements target pin insertion tip width, specified at 0.640 millimeters with a tolerance of plus or minus 0.025 millimeters.
The overall average pin tip width across all one hundred twenty-five measured parts calculates to barbarX = 0.6412 mm. The average range across the twenty-five subgroups calculates to barR = 0.0048 mm. Using standard Shewhart statistical constants for subgroup size n = 5, A2 = 0.577, D3 = 0, and D4 = 2.114.
The provisional Upper Control Limit (UCLbarX) for the subgroup mean is calculated as:
UCLbarX = barbarX + (A2 × barR) = 0.6412 + (0.577 × 0.0048) = 0.64397 mm
The provisional Lower Control Limit (LCLbarX) for the subgroup mean is calculated as:
LCLbarX = barbarX – (A2 × barR) = 0.6412 – (0.577 × 0.0048) = 0.63843 mm
The provisional Upper Control Limit (UCLR) for the subgroup range is calculated as:
UCLR = D4 × barR = 2.114 × 0.0048 = 0.01015 mm
The Lower Control Limit (LCLR) for n = 5 equals zero. The calculated process standard deviation estimate (hatσ) uses the d2 factor for n = 5, which is 2.326:
hatσ = fracbarRd2 = frac0.00482.326 = 0.002063 mm
Short-term process capability (Cpk) evaluation against upper specification limit (USL = 0.665 mm) and lower specification limit (LSL = 0.615 mm) proceeds as follows:
Cpu = fracUSL – barbarX3hatσ = frac0.665 – 0.64123 × 0.002063 = frac0.02380.006189 = 3.84
Cpl = fracbarbarX – LSL3hatσ = frac0.6412 – 0.6153 × 0.002063 = frac0.02620.006189 = 4.23
The resulting preliminary Cpk of 3.84 confirms that short-term variation falls comfortably within design specifications. The calculated control limits (0.63843 to 0.64397 mm) sit inside the engineering tolerance boundaries (0.615 to 0.665 mm). Setting machine alarm thresholds to engineering tolerances instead of these statistical limits allows significant tooling mechanical drift before operator notification occurs.
Statistical control limits must sit inside engineering print tolerances, bounding true machine process capability rather than product rejection boundaries.
Unfiltered variance distorts interpretation of range charts.
Different tooling types and sampling regimes demand specific SPC chart selections to avoid misinterpreting high-speed line dynamics. The table below compares standard control chart selections used during post-tooling qualification.
| Chart Type | Subgroup Size (n) | Primary Statistical Sensitivity | Best Application Scenario | Limit Calculation Basis |
|---|---|---|---|---|
| Individual-Moving Range (I-MR) | n = 1 | Large mean shifts, low part volume | Low-rate qualification runs, expensive prototype parts | Moving range average (barMR) |
| Mean and Range (barX – R) | 2 le n le 9 | Moderate mean shifts, short-term spread | High-speed progressive stamping, automated assembly | Subgroup range average (barR) |
| Mean and Standard Deviation (barX – S) | n ge 10 | Within-subgroup variation, high precision | Multi-cavity injection molding, multi-spindle machining | Subgroup standard deviation (barS) |
| EWMA (Exponentially Weighted) | n ge 1 | Small, persistent drift trends | Continuous wear monitoring on high-stroke die punches | Weighted historical mean (λ) |
Control Chart Selection for Low-Volume Initial Runs
Low-volume qualification runs often lack sufficient output to form large subgroups. Deploying individual-moving range charts during the first five hundred parts allows tracking of single-unit dimensional progression. Moving range limits capture part-to-part variation caused by thermal escalation before subgroup pooling masks individual out-of-spec events.
Scrap accumulates rapidly when tool drift goes unmonitored.
Failing to establish verified statistical limits following high-speed tooling changes leads to massive scrap production within minutes. A high-speed line running unmonitored with an uncalibrated tool mean produces tens of thousands of non-conforming parts before off-line laboratory inspection identifies the defect.


Ledger
Contractual agreements between module integrators and manufacturing facilities determine who pays for re-qualification engineering hours following line tooling modifications. Standard supply contracts distinguish between planned tool maintenance and unscheduled tool replacement driven by line failures. When tooling modifications occur due to poor die design or improper setup, the factory absorbs non-recurring engineering costs and material scrap charges.
Without precise tracking, unallocated scrap costs fall on the buyer.
Manufacturing supply agreements frequently hide re-qualification costs inside broad setup line items or unit amortisation schedules. Unbundling these charges requires strict ledger tracking of tooling wear cycles, scrap counts, and engineering sign-off billable hours. Clear contractual definitions protect buyers from absorbing supplier process development costs.
Contractual Allocation of Re-Qualification Engineering Hours
Engineering change orders triggered by component redesign require buyer-funded re-qualification engineering hours. Tooling replacement caused by supplier tool maintenance neglect falls under supplier operational overhead. RFQ documentation must isolate tooling sign-off scopes into explicitly priced lines to establish accountability.
Turnkey manufacturing agreements that omit explicit tooling change sign-off criteria expose buyers to uncontrolled re-qualification engineering fees during component revisions.
The commercial matrix below defines responsibility boundaries across integration levels when tooling modifications alter production line control limits.
| Integration Level | Tooling Ownership | Re-Qualification Engineering NRE | Scrap Amortization Scope | Firmware & Control Limit Ownership |
|---|---|---|---|---|
| Turnkey Module Supplier | Factory owned | Included in base unit price | Absorbed fully by supplier | Supplier proprietary |
| Semi-Custom Engineering Scope | Shared custody | Billed at pre-negotiated hourly rate | Split based on scrap threshold allowance | Buyer owns limit specification files |
| Reference Design Transfer | Buyer owned | Fully billable to buyer | Buyer absorbs all line scrap | Buyer owns complete design package |
| White-Label Build-to-Print | Buyer owned | Fixed fee per change notice | Supplier absorbs scrap above target rate | Factory holds process configuration copy |

Landed Scrap Amortization and Tooling Warranty Claims
Tooling warranties specify total rated stroke lifespan under nominal operating conditions. Early die failure requires pro-rated supplier replacement of tooling components and credit for scrap material generated during failure events. Contract clauses governing post-tooling change qualification state that production run acceptance remains contingent upon SPC limit verification.
Formal sign-off locks down the operating baseline.
Standard manufacturing purchase orders incorporate quality provisions stating that production batches manufactured under modified tooling will not be accepted or paid for until control limit documentation receives formal sign-off. A typical contract clause enforcing this requirement reads as follows:
Section 8.4 of the Master Supply Agreement states that any modification to primary tooling, dies, or molds requires submission of an updated Process Capability Dossier including twenty-five verified SPC subgroups, and no invoice for units produced post-modification shall become payable until written approval of new statistical control limits is issued by the buyer’s quality engineering desk.

Dossier
Final sign-off of a high-speed line tooling change requires a complete design transfer package. The engineering transfer dossier documents physical tool dimensions, machine setup parameters, raw material batch certification, and verified SPC chart outputs. Storing raw data files alongside processed statistical control limit calculations provides traceable audit capability for future second-sourcing or facility transfers.
Empirical data guides adjustments to control limits.
A complete design transfer package contains full fabrication files, tooling maintenance logs, and calibrated inspection routines. Missing firmware configuration maps or SPC calibration logs prevents second-source factories from replicating validated production conditions. Complete custody transfer ensures operational continuity across global manufacturing sites.

Design Transfer File Formats and Calibration Logs
Transferring production responsibility between manufacturing facilities requires exchange of raw, machine-readable engineering files. Providing flat PDF reports hides underlying data structures, preventing independent statistical verification by the buyer’s quality desk. The decision checklist below outlines mandatory data deliverables required within the post-tooling change qualification dossier.
- Statistical Process Control Data delivered in open CSV or XML format containing raw individual measurement values, subgroup indexes, timestamp markers, and cavity IDs.
- Coordinate Measuring Machine Programs supplied in native DMIS format alongside CAD model overlays detailing alignment datums and feature vectors.
- Tooling Maintenance Inspection Logs provided as digitized records capturing initial steel dimensions, surface roughness measurements, and coating thickness certifications.
- Machine Setup Configuration Files exported directly from press controllers specifying ram velocity curves, feed pitch timing, press tonnage monitor limits, and die cushion pressures.
- Vision System Calibration Master Files delivered as exported job files containing spatial resolution metrics, lighting intensity presets, and pixel-to-millimeter transformation matrices.
Engineering Change Notice Protocols for Control Limit Sign-Off
Every control limit modification demands formal Engineering Change Notice tracking. Line operators cannot adjust controller alarm bands or SPC software limits without an approved change notice signed by the quality manager and process engineer. Version-controlled limit files prevent unauthorized adjustments that mask tool wear or mechanical degradation.
The transfer dossier binds factory performance to contractual commitments. Without complete file transfer and verified statistical control limits, cross-border sourcing practices face unquantifiable quality risks during volume ramp.
What specific threshold of long-term variance expansion should trigger mandatory dual-source tooling re-qualification when component production shifts to secondary manufacturing facilities?