Inline Thermal Drift Qualification for Automated Optical Inspection Cells
Inline thermal drift qualification for AOI cells demands gantry growth mapping, illuminator heat isolation, and calibrated glass target verification.

Expansion
When ambient shop-floor temperatures swing by more than two degrees Celsius, the structural framing inside automated optical inspection cells shifts enough to throw off measurements. High-resolution line-scan optics and multi-megapixel area-scan sensors register printed circuit board features down to sub-micron pixel scales. As heat builds up over a shift, gantry beams lengthen, mirror mounts deflect, and lens barrels creep forward along the optical axis.
A drift of just three micrometers across the field of view corrupts coordinate registration, flagging good surface-mount assemblies as defective. Accounting for these movements requires mapping how camera supports, lighting rigs, and board conveyors physically expand under true operating thermal loads.
While granite beds expand at predictable rates, extruded aluminum frames respond much faster to air temperature spikes caused by nearby reflow ovens or HVAC cycling. Aluminum 6061-T6 exhibits a coefficient of thermal expansion of approximately 23.6 parts per million per Kelvin, whereas synthetic granite bases hold a lower expansion coefficient near 8.5 parts per million per Kelvin. The structural junction connecting an aluminum camera bridge to a granite support base accumulates internal shear stresses as temperatures rise.
This thermal expansion mismatch tilts the optical axis relative to the board travel plane, introducing keystoning distortion into image capture pipelines.
Kinematic Mounts and Camera Gantry Displacements
When an inspection cell pairs granite foundations with extruded aluminum frames, the two materials expand at different rates across all three spatial axes. On high-speed cells where top-down camera gantries span up to 800 millimeters to clear dual-lane conveyors, a five degrees Celsius temperature rise stretches an aluminum beam by nearly 94 micrometers. Without kinematic flexures to absorb that growth, the linear guide rails bind.
Edge-mounted encoders still log mechanical travel accurately, but the sensor itself has drifted off the central optical origin.
Heat from motor drives conducts straight through uninsulated alloy mounting brackets into the camera housing, warming the lens barrel. As the tube expands, changing distances between glass elements alter the lens’s focal length and working distance. Telecentric lenses, chosen specifically for measuring component height and coplanarity, lose their telecentricity when elements expand unevenly along the barrel.
Magnification then varies across the field of view, making identical packages at the frame edge read larger than those in the center.
A ten-millimeter aluminum sensor bracket expands by 236 nanometers for every single-degree temperature increase during continuous line-scan operations.

Optical Z-Height Focus Shift Mechanics
Extended illumination runs cause anodized 6061 aluminum lens barrels to elongate along the optical axis. For high-numerical-aperture vision systems, modulation transfer function falls off rapidly once the focal plane drifts outside the depth-of-field margin. In an optical assembly operating at five-times magnification with a numerical aperture of 0.15, that acceptable depth of field is under 24 micrometers ~ a tolerance window the mounting tube’s thermal growth easily consumes during a four-hour production run.
Inspection software often attempts to mask defocus by tweaking spatial filtering thresholds. Adjusting algorithm sensitivity hides the blur, but it also misses genuine defects like insufficient solder fillets or lifted leads while leaving the root optical problem untouched. Tracking physical drift directly requires baseline laser displacement gauges and vertical optical sensors mounted along the conveyor bed to monitor focus degradation in real time.
| Material Specification | Thermal Expansion Coefficient (ppm/K) | Thermal Conductivity (W/m·K) | Linear Growth per Meter at ΔT=5°C (µm) | Structural Distortion Profile |
|---|---|---|---|---|
| Aluminum 6061-T6 | 23.6 | 167.0 | 118.0 | Rapid linear growth, high thermal sensitivity to draft currents |
| Structural Steel A36 | 12.0 | 52.0 | 60.0 | Moderate expansion, higher thermal mass slows ambient response |
| Synthetic Granite | 8.5 | 3.0 | 42.5 | Low growth, high thermal inertia creates long hysteresis lags |
| Invar 36 Alloy | 1.2 | 10.1 | 6.0 | Minimal dimensional change across standard operational ranges |
An uncorrected focal plane shift of fifteen micrometers drives up false-call rates, causing acceptable solder joints to fail inline screening.
Heat
Enclosing an automated optical inspection cell protects optics from shop dust, but it traps heat thrown off by board-handling stepper motors, high-intensity LED illuminators, and overhead fans. Temperatures in the upper chassis bay routinely sit eight to twelve degrees Celsius above ambient room air. Internal cooling fans circulate this air unevenly, creating hot spots that cause structural columns to bow.
Cool air directed across one side of a gantry while cabling trays shield the other produces asymmetric thermal deflection. As the hotter side expands, the optical axis tilts out of square with the PCB conveyor track. Qualifying an inline cell requires profiling these internal microclimates with multi-channel thermistor arrays under realistic operating cycles.
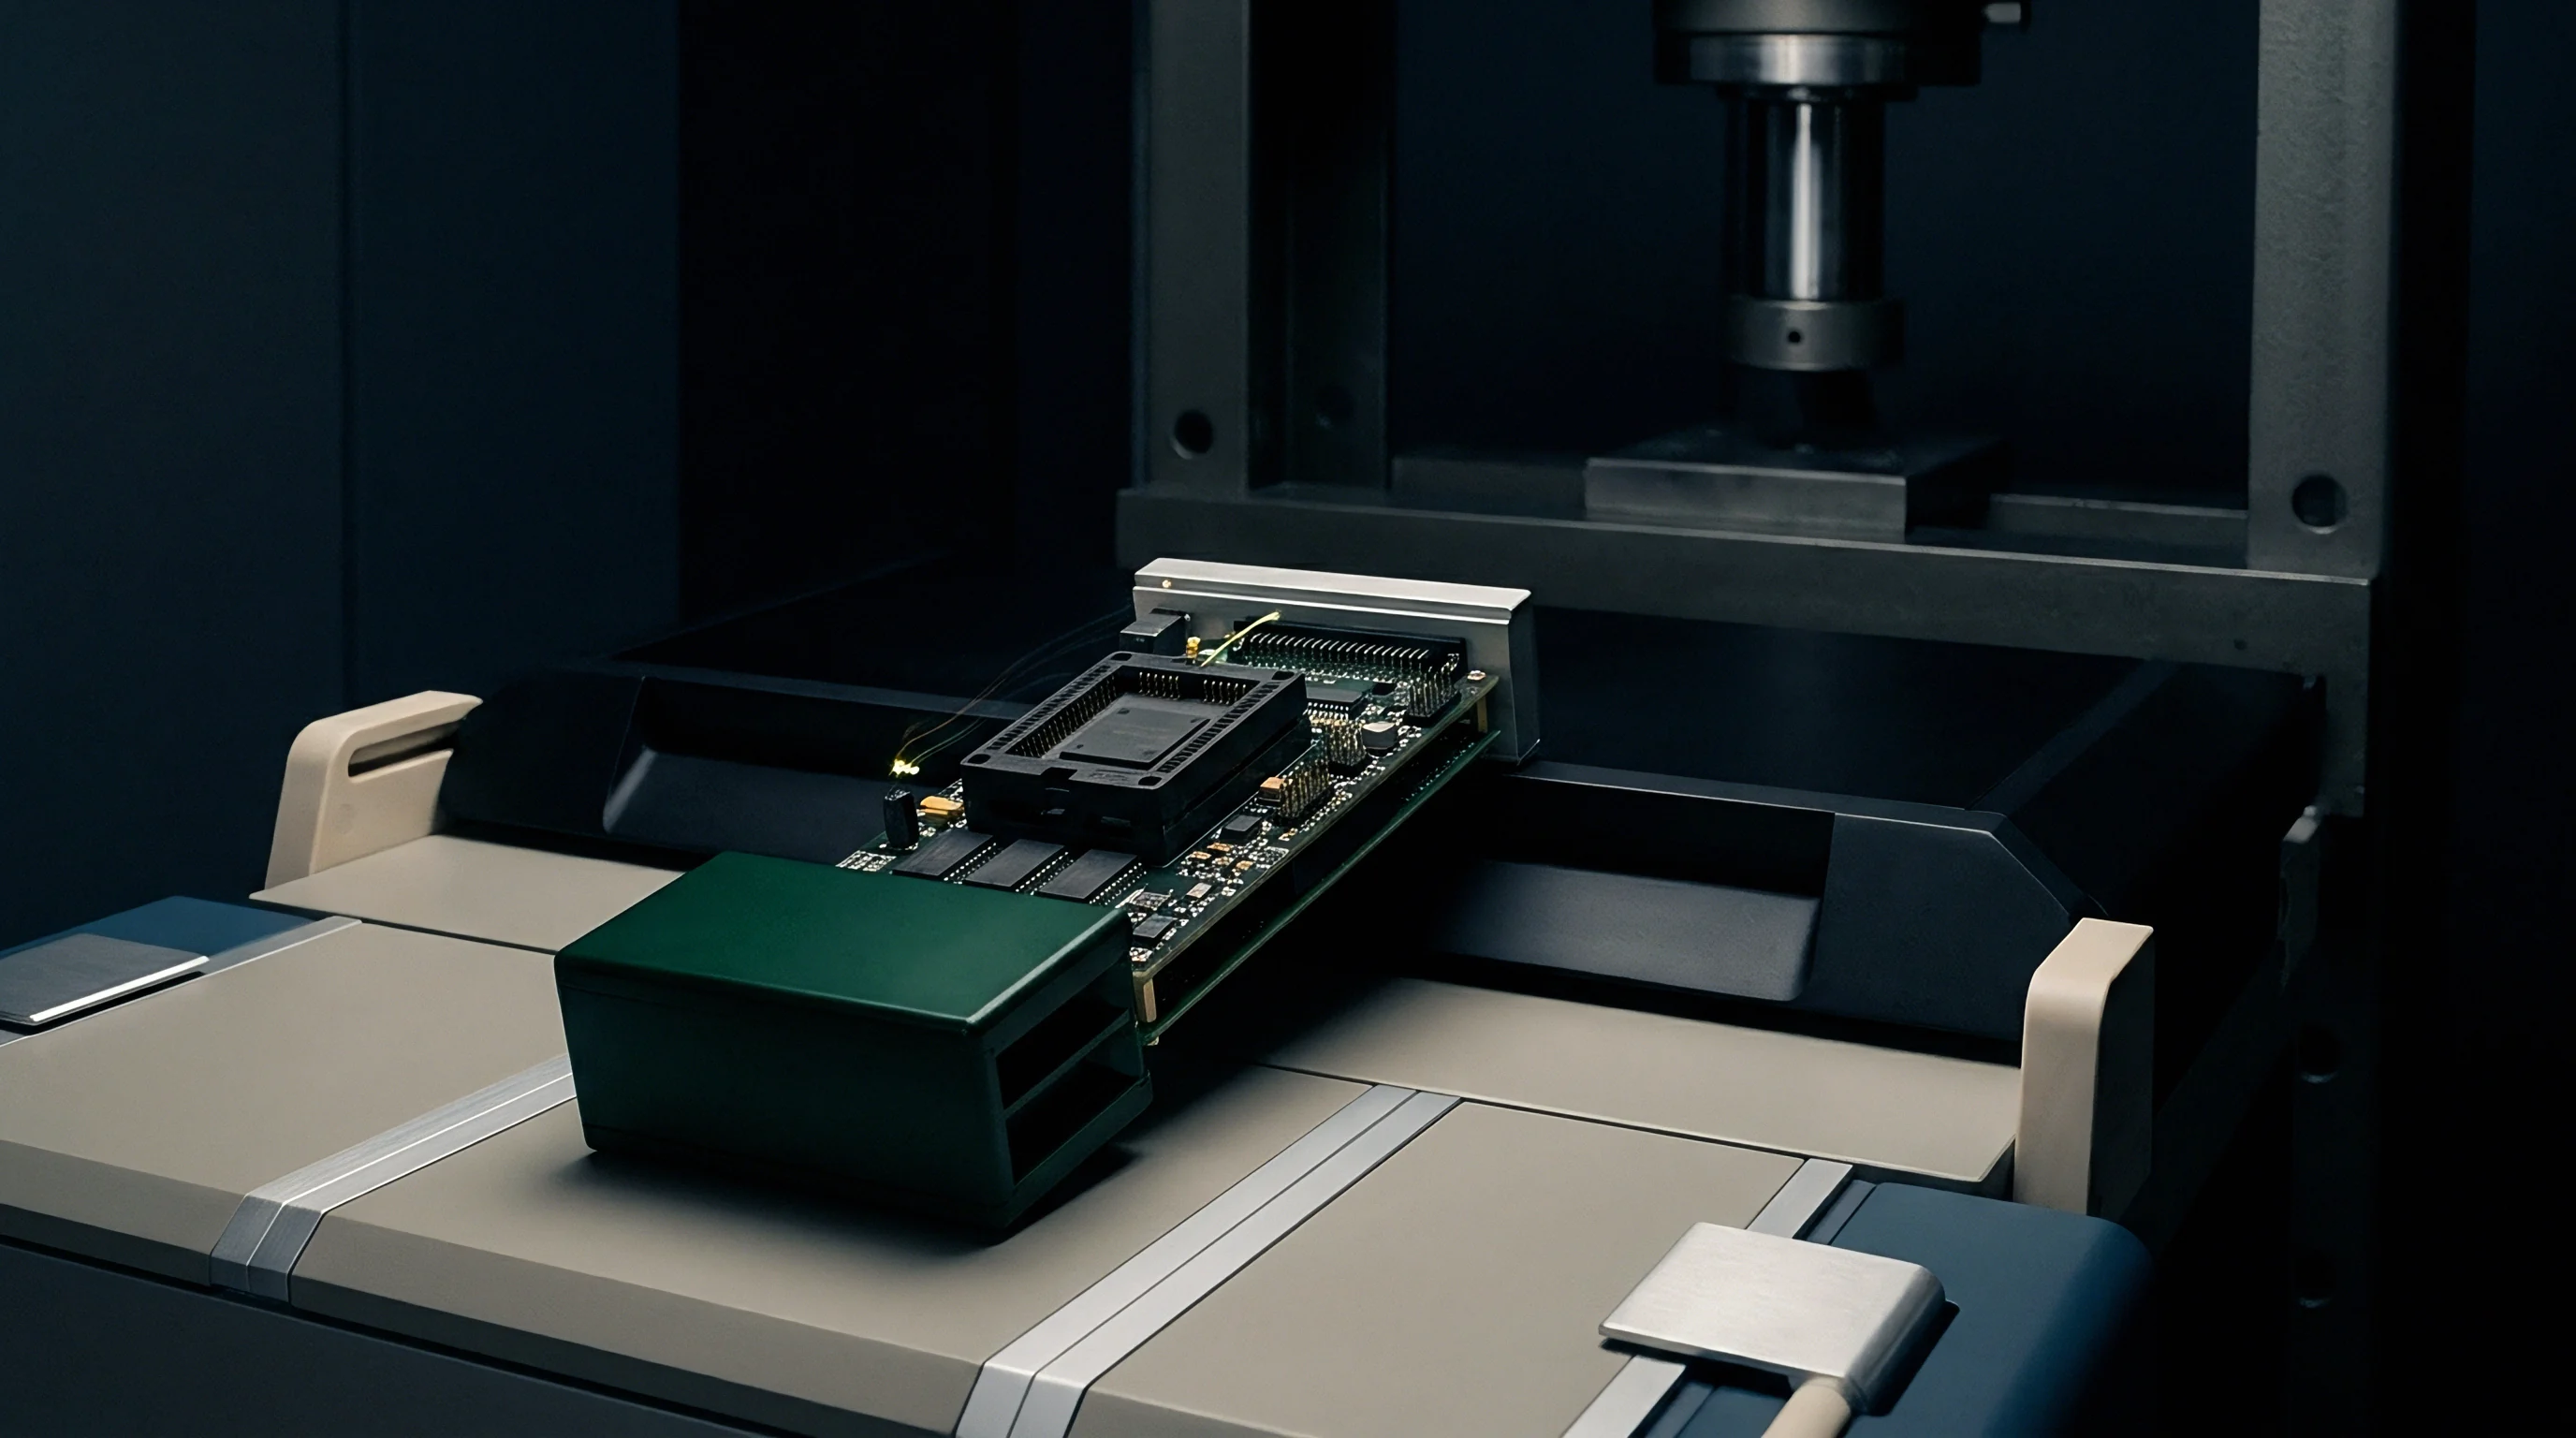
Internal Convection Loops and Structural Thermal Gradients
Cooling fans set up uneven thermal gradients across gantry cross-members, and variable fan speeds designed to cut acoustic noise alter those dissipation patterns throughout a run. When a cell idles during board-feed delays or upstream stoppages, airflow drops, prompting rapid thermal shifts in light alloy brackets. Regaining thermal equilibrium after a restart can take up to forty minutes, during which measurement repeatability suffers.
High-frame-rate CMOS sensors draw substantial power during continuous capture, dumping heat straight into sealed camera bodies. Without conductive heat sinks or liquid cooling loops, sensor temperatures climb steadily over the first two hours of operation. The resulting silicon heating drives up dark current noise, degrading image contrast on low-reflectance surface-mount substrates.
Sensor Core Self-Heating Profile
Drawing six to twelve watts during active capture, CMOS focal plane arrays push internal junction temperatures well above room ambient. That heating expands the silicon substrate, altering pixel pitch across large formats. On an 8K line-scan sensor with 3.5-micron pixels, thermal expansion shifts perimeter pixels relative to the optical center by fractions of a pixel width, reading in software as artificial horizontal scale expansion.
Thermal profiling of 8K line-scan sensors shows package temperatures climbing from 22 degrees Celsius at cold start to 41 degrees Celsius at equilibrium after 140 minutes of continuous scanning. That curve assumes a 25-degree ambient baseline and forced airflow of 1.2 meters per second; dropping airflow to 0.5 meters per second pushes equilibrium up another 6.4 degrees. Placing thermistors directly on the sensor package allows control software to run real-time recalibration routines against internal junction telemetry.
- Focus Degradation occurs when differential thermal swelling tilts camera mount assemblies relative to target conveyor belts.
- Pixel Misalignment distorts coordinate registration across multi-camera stitching boundaries during continuous board passage.
- Illuminator Intensity Decay changes light spectrum output as LED junction temperatures climb toward steady-state operation.
- Telecentricity Loss alters perceived component magnification when optical element spacing drifts under sustained internal thermal exposure.
Clause 4.2 of IPC-9850 mandates thermal stabilization periods prior to conducting machine placement and inspection capability measurements.
Whether active chiller loops inside optical enclosures introduce micro-vibrations that degrade sub-micron line-scan sharpness remains an unresolved engineering trade-off.
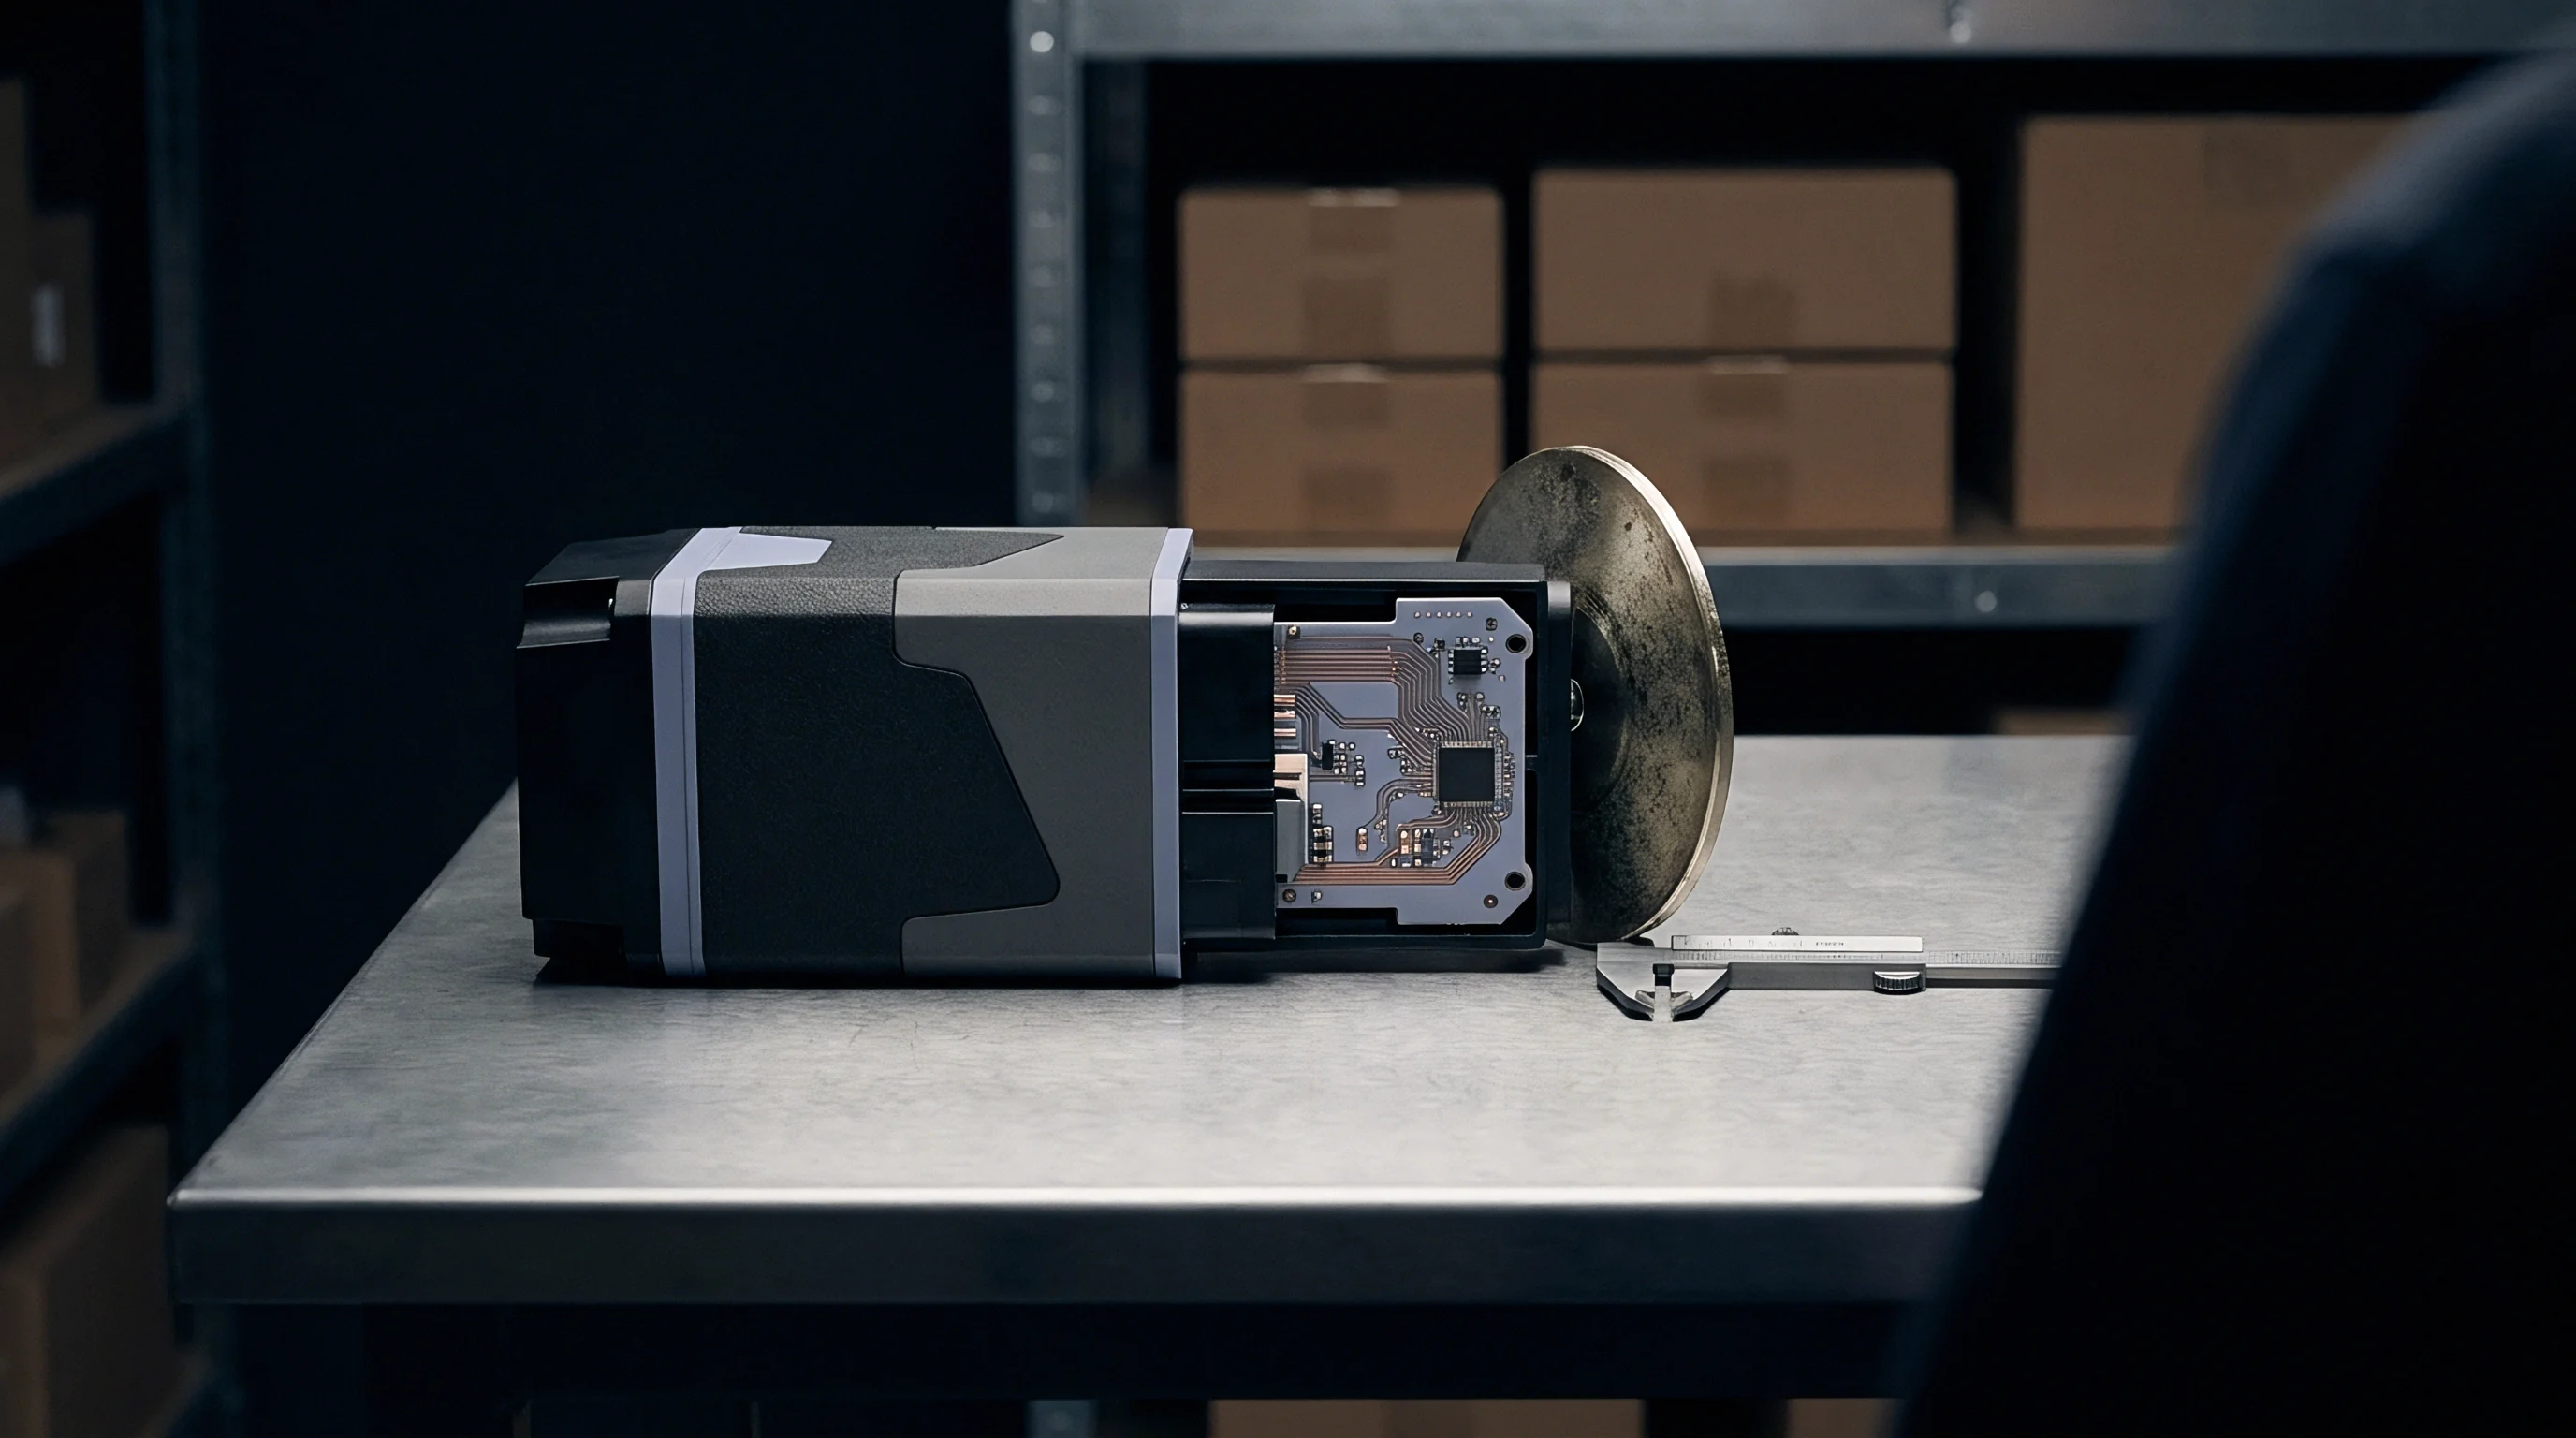

Calibration
Photolithographic chrome patterns on low-expansion glass provide the physical baseline for checking cell measurement accuracy. Because quartz and specialized synthetic glasses exhibit near-zero thermal expansion coefficients, their grid matrices remain stable dimensional references while surrounding gantry members expand. Placing these targets inside the working cell exposes both optical resolution and dynamic spatial accuracy to real factory temperatures.
Running calibration plates across the conveyor lets machines execute automated self-checks at scheduled hourly intervals without manual intervention. Comparing measured dot coordinates against master positions isolates thermal drift vectors across X, Y, and Z without pulling the cell out of the production line.
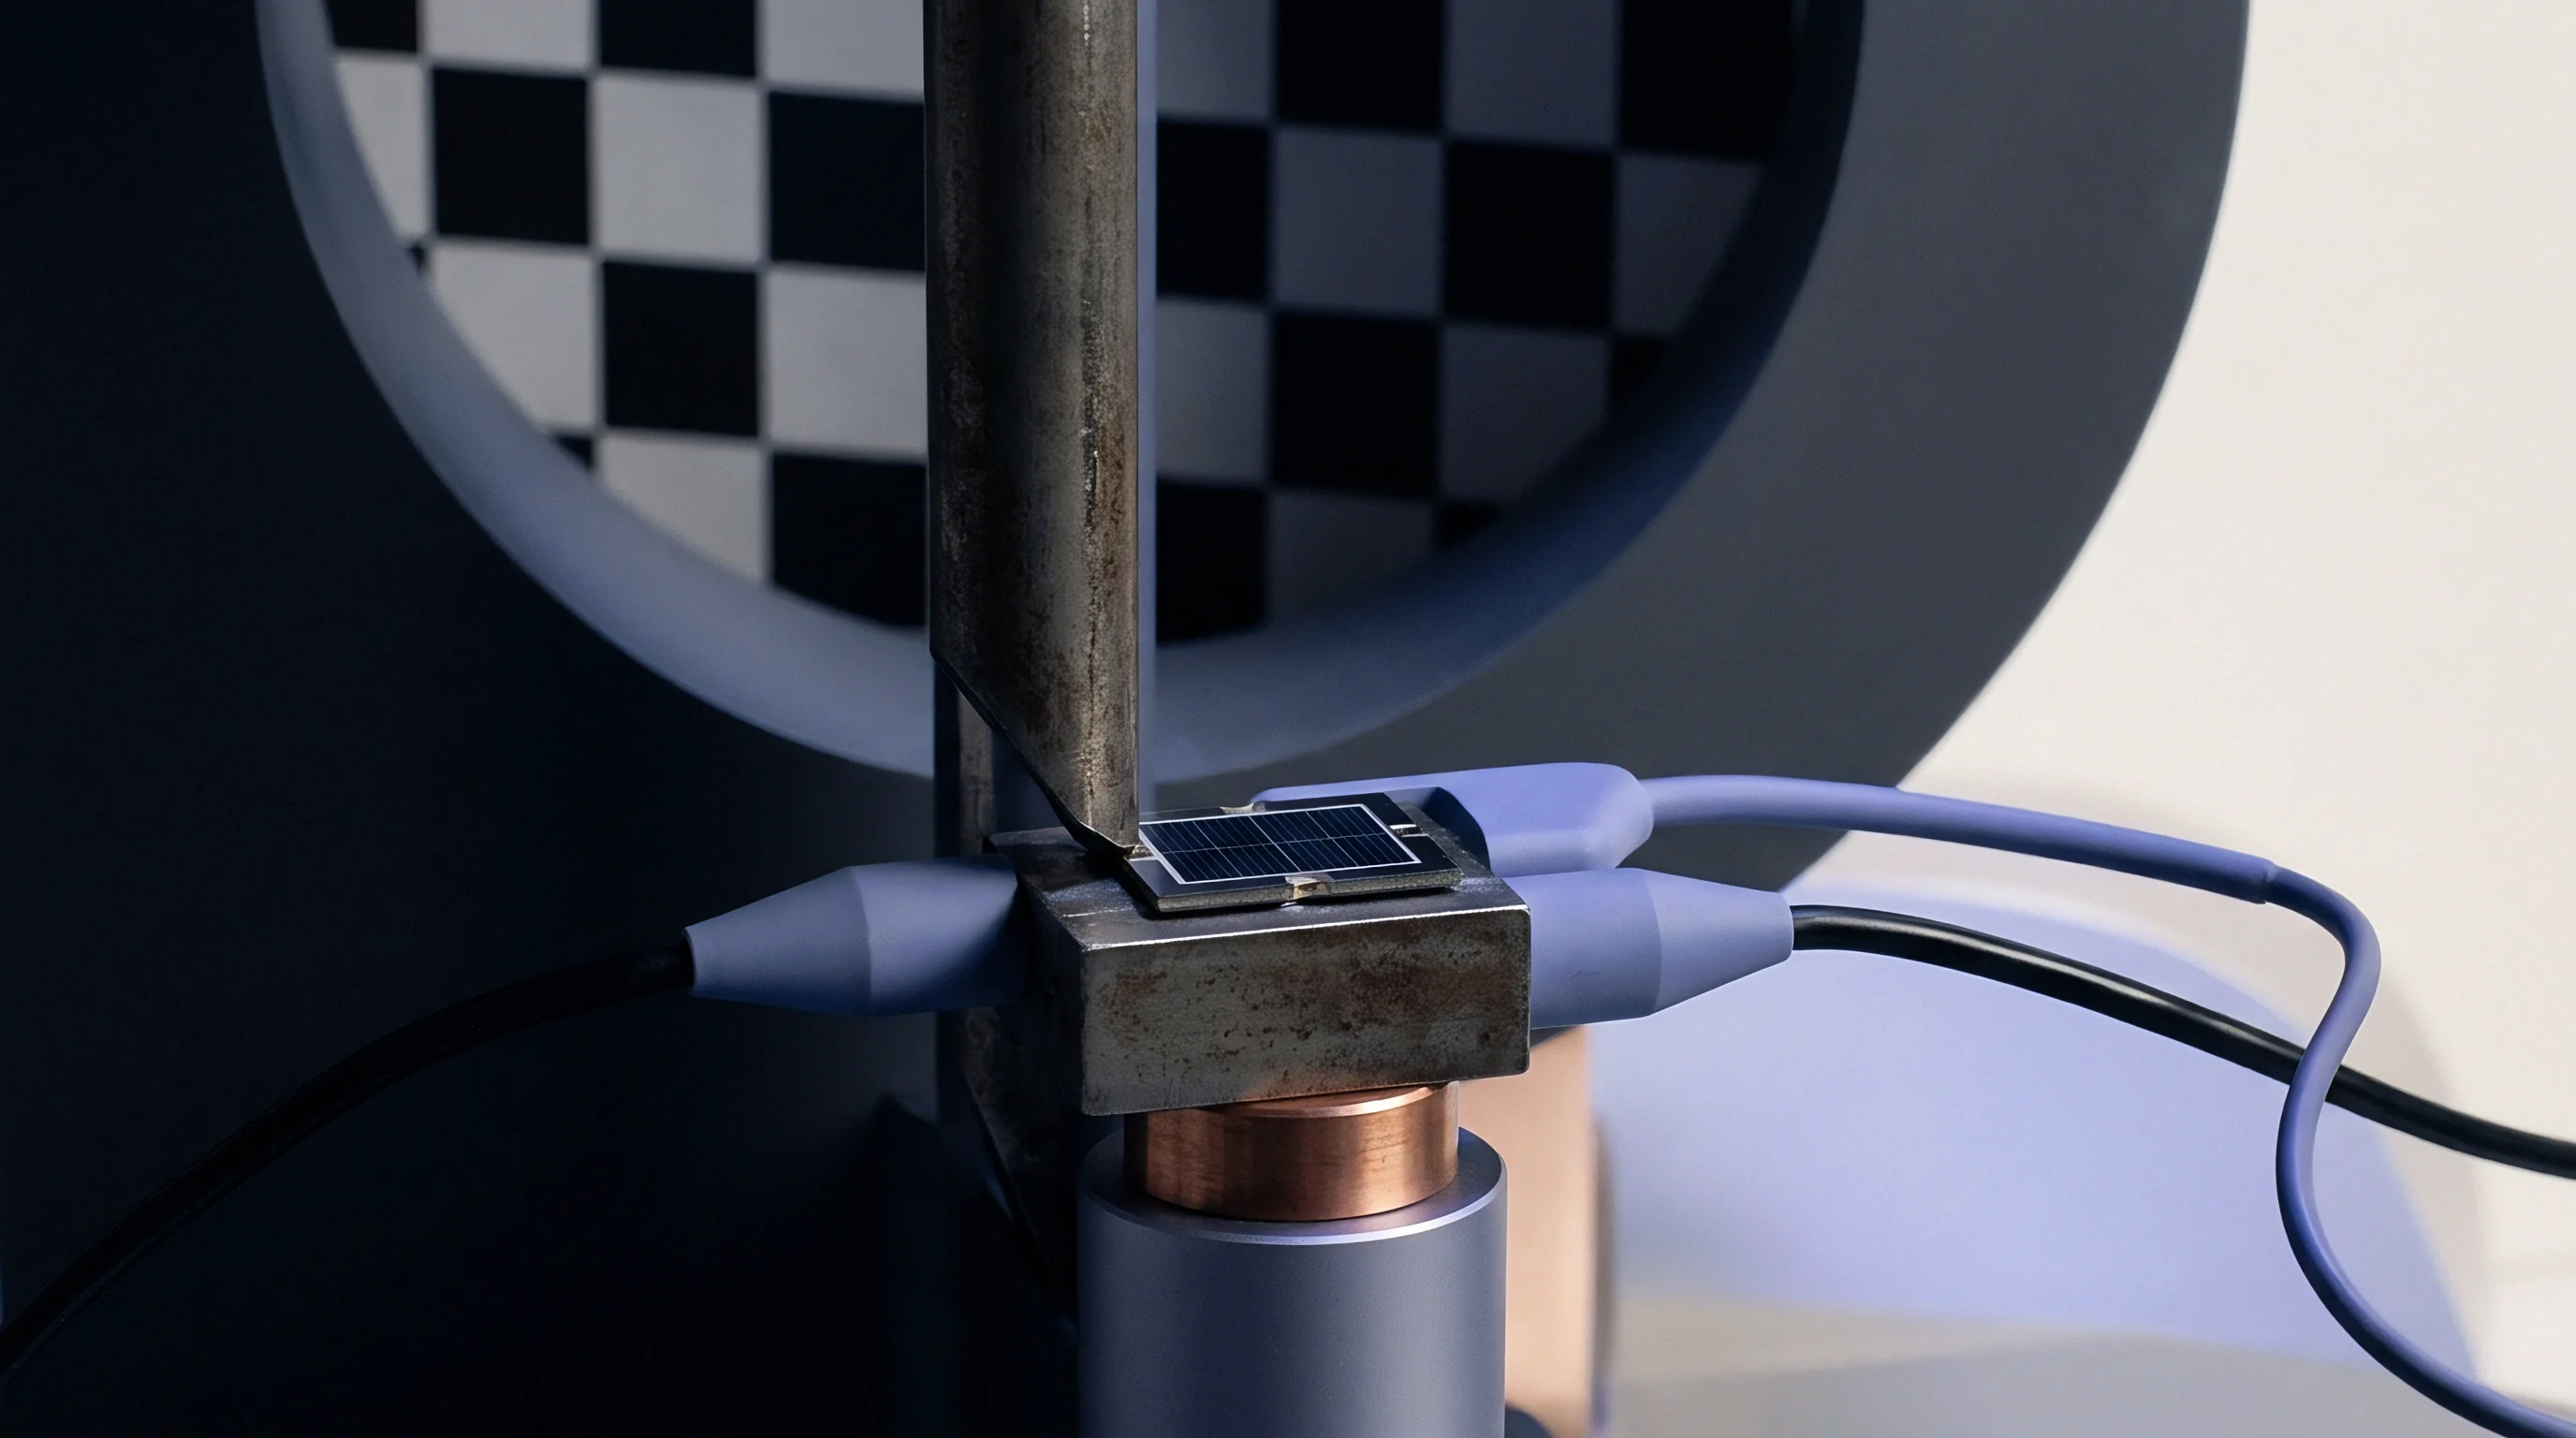
Glass Substrate Grid Artifact Standards
Lithographically patterned chrome-on-quartz grid plates possess a coefficient of thermal expansion below 0.5 ppm per Kelvin. Standard float glass targets present thermal growth rates around 8.5 ppm per Kelvin, which can mask optical gantry expansion if uncorrected during high-precision calibration runs. Synthetic quartz artifacts preserve grid pitch dimensions within 20 nanometers across a twenty-degree thermal window, serving as stable metrology standards for inline qualification routines.
Calibration maps generated at cold startup drift out of tolerance as internal hardware reaches operating temperature. Dynamic correction schemes counter this by pulling data from thermistors along the frame and feeding offsets into software coordinate transformation tables.
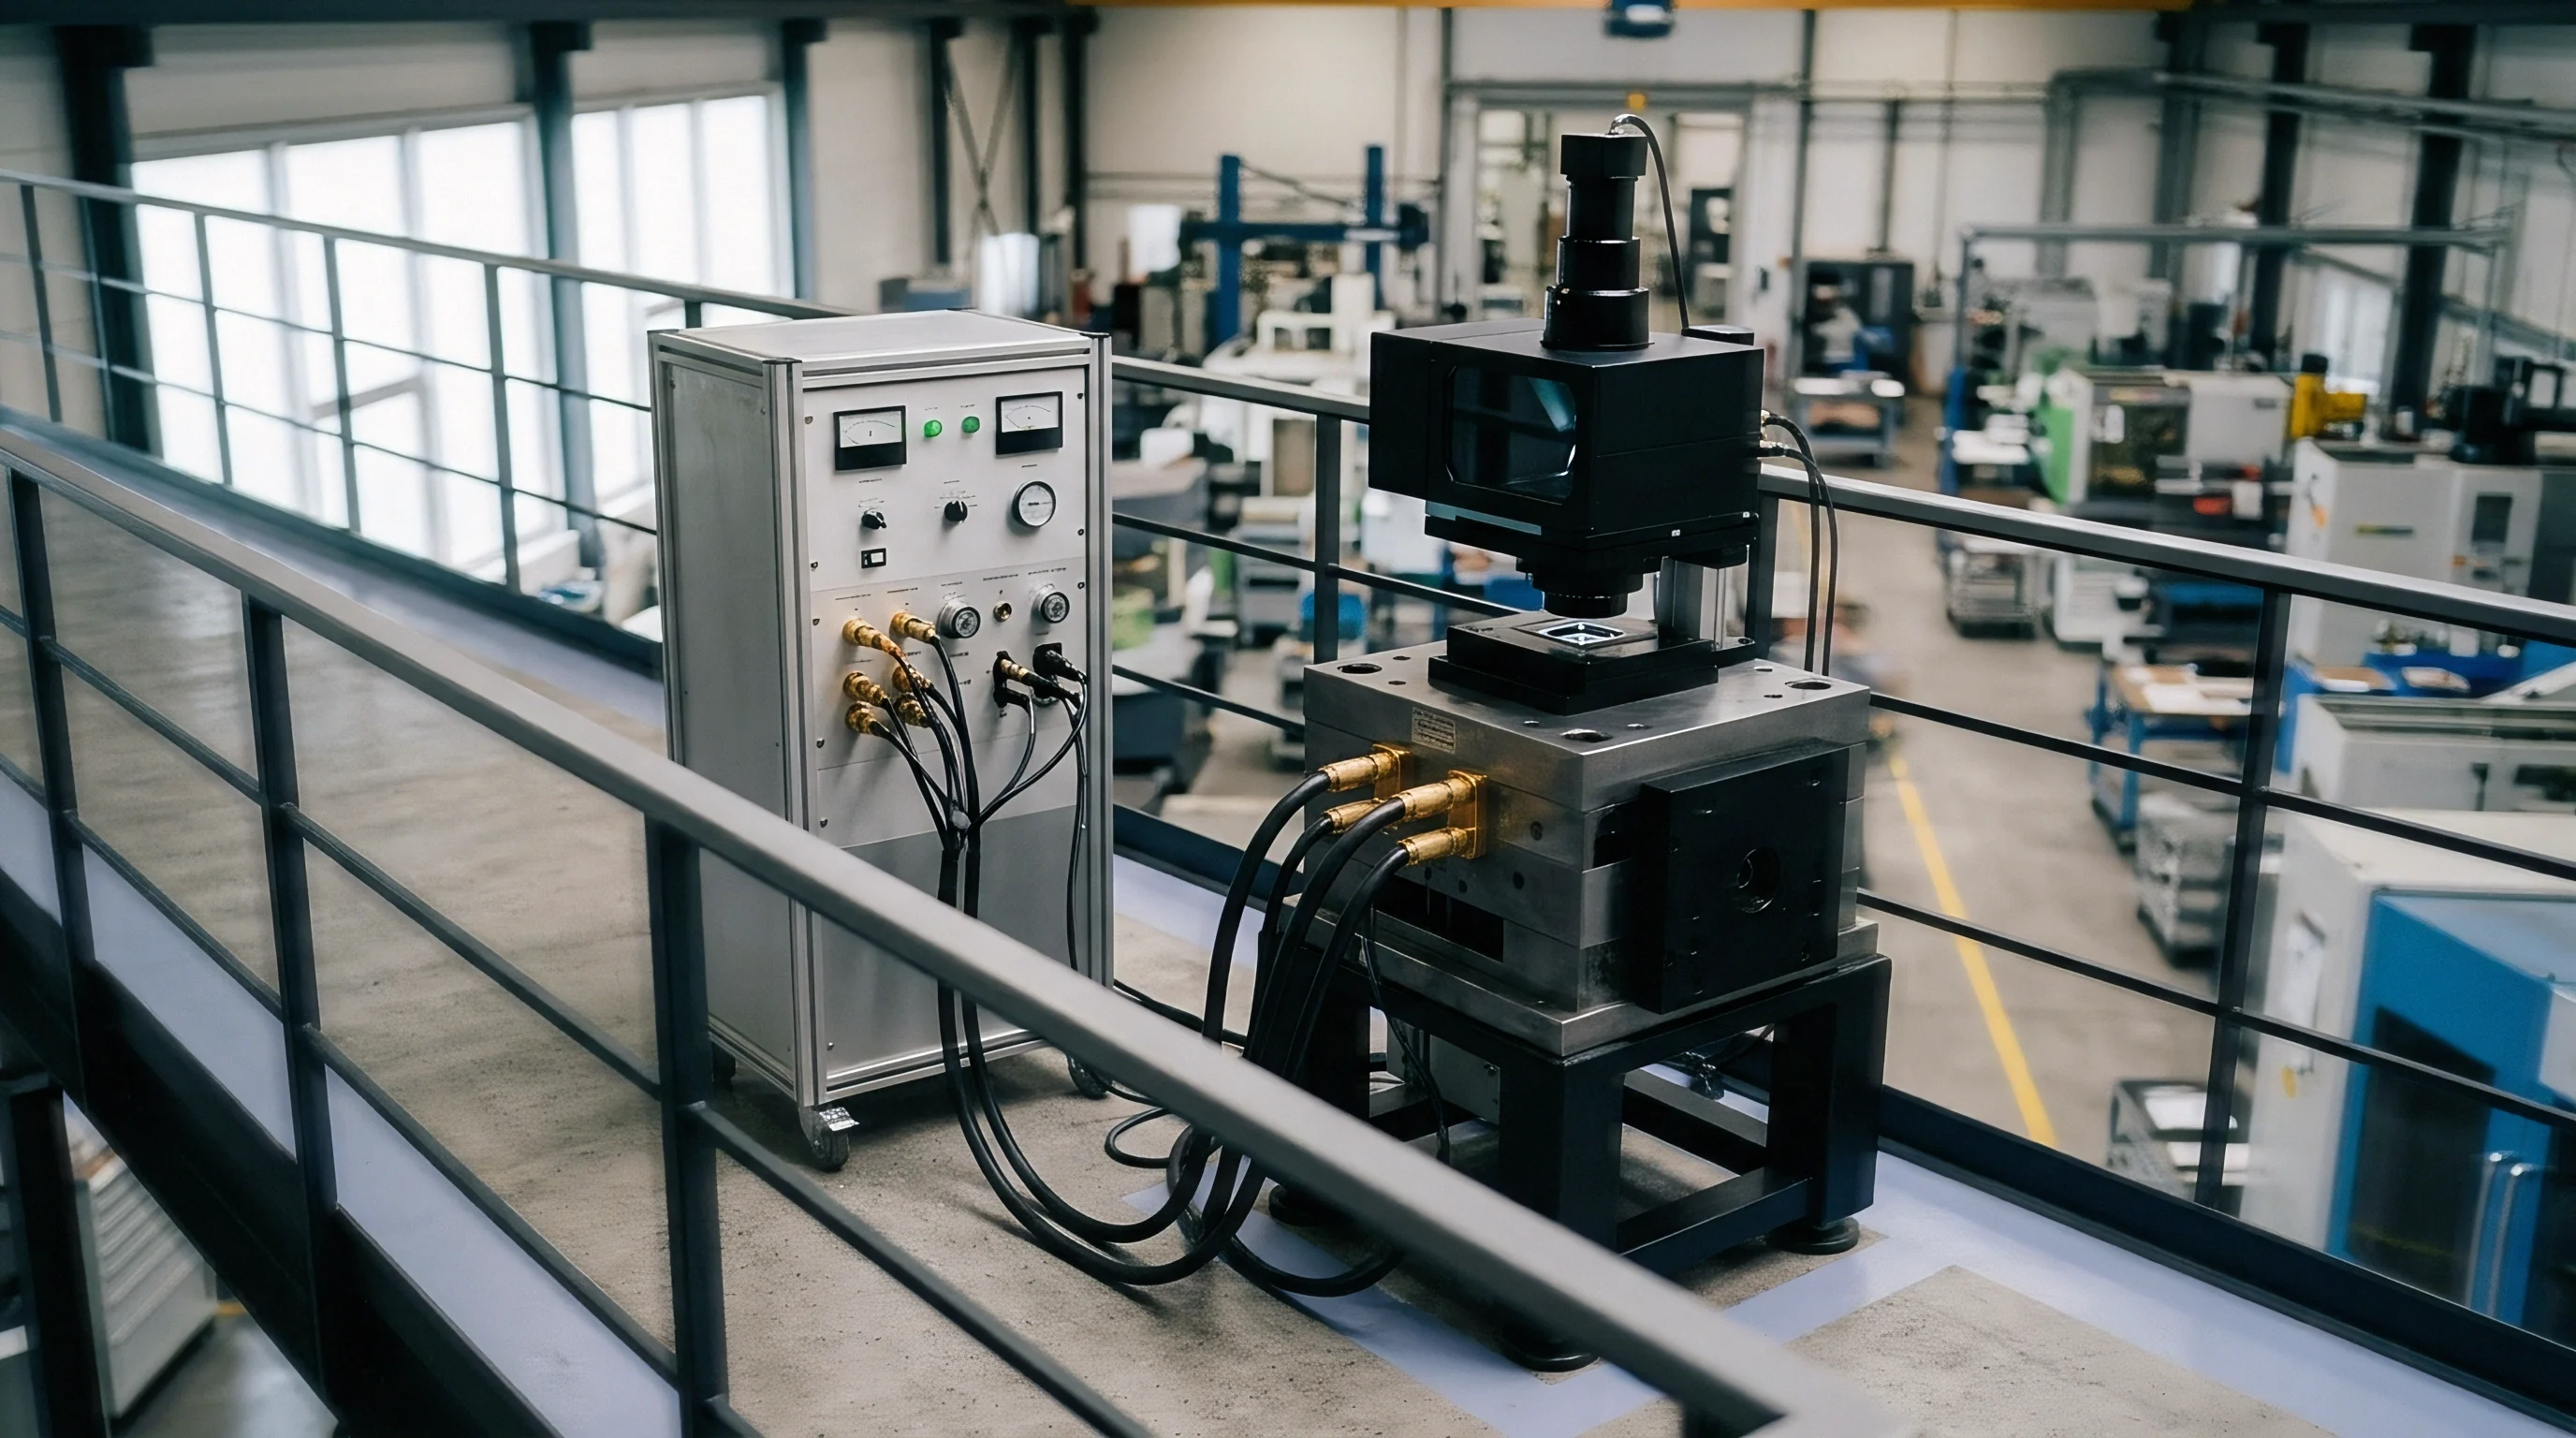
When Does Temperature Creep Void Metrology Certification?
Ambient thermal drift exceeding three degrees Celsius beyond the initial setup window invalidates stored camera spatial transformation maps. Standard factory acceptance criteria mandate verifying spatial calibration accuracy at thermal equilibrium. Running inspection routines before cells reach thermal stability produces inconsistent component placement metrics, resulting in rejections during quality audits.
Software thermal compensation algorithms are cited as eliminating up to 95 percent of gantry position errors caused by room temperature swings, but unverified performance across diverse mounting geometries leads buyers to mandate hard thermal isolation limits in hardware acceptance specifications.
- Mount the low-expansion chrome target onto the internal conveyor assembly at ambient production temperature.
- Execute an initial twenty-point spatial coordinate capture across the entire field of view to define reference grid positions.
- Energize internal lighting banks and gantry drives to initiate cell operational heating for ninety minutes.
- Repeat spatial coordinate capture at fifteen-minute increments to chart thermal pixel displacement curves across all camera channels.
- Calculate volumetric drift vectors and update dynamic compensation matrix coefficients within cell control software.
Physical thermal isolation of optical structures reduces measurement instability far more reliably than software coordinate shifting algorithms.
| Substrate Classification | Thermal Expansion Coefficient (ppm/K) | Substrate Flatness Standard (µm/100mm) | Maximum Grid Uncertainty at ΔT=5°C (nm) | Primary Metrology Application |
|---|---|---|---|---|
| Synthetic Quartz (Fused Silica) | 0.5 | 0.5 | 25.0 | Sub-micron line-scan metrology baseline verification |
| Borosilicate Glass (Boro 3.3) | 3.3 | 1.0 | 165.0 | Standard area-scan camera field calibration |
| Soda-Lime Float Glass | 8.5 | 2.0 | 425.0 | Low-cost gross dimensional verification plates |
| Ceramic Zero-Expansion Class | 0.05 | 0.2 | 2.5 | Primary reference standards for cleanroom qualification |
ISO 10360-2 Section 5.4 reallocates test uncertainty allowances directly to the machine vendor whenever room ambient temperatures fluctuate beyond agreed site limits.
Tolling
Commercial scope allocations for thermal stability qualification dictate whether hardware design changes or software compensation routines absorb non-recurring engineering charges. Machine integrators often quote automated optical inspection cells using standard commercial environmental envelopes. When an end customer specifies operation within uncontrolled assembly plants where ambient temperatures swing by eight degrees Celsius daily, non-recurring engineering costs climb rapidly.
Dividing financial responsibility between mechanical thermal isolation hardware and software correction development requires precise contract language governing non-recurring engineering line items.
Integrating dynamic thermal software routines avoids the substantial upfront expense of mechanical redesigns involving Invar support members or active chilled-water gantry stabilization loops. Software algorithms rely on real-time temperature telemetry to adjust image transformation matrices, keeping physical hardware manufacturing costs low. Relying purely on software compensation increases software validation liability if ambient temperature variations exceed modelled limits.

Enclosure Isolation Scope Allocation
Custom environmental shrouds with dual-stage air-to-air heat exchangers demand dedicated structural drafting hours. High-end inspection cell specifications dictate isolating the optical gantry completely from internal motor heat sources. Designing physical thermal baffles, isolated conveyor drive mounts, and sealed optical chambers increases non-recurring engineering drafting allocations by 80 to 140 engineering hours per cell revision.
Because custom enclosures expand a cell’s operating footprint, factory floor space constraints limit the physical thickness of thermal insulation barriers surrounding optical inspection cells. Integrators evaluate trade-offs between physical enclosure isolation costs and software compensation development budgets to meet target commercial delivery schedules.
Non-Recurring Engineering Amortization Breakdown
System integrators quote turnkey thermal packages by balancing upfront mechanical modifications against long-term operational unit costs. Consider a five-cell optical inspection line deployment for high-density printed circuit assembly. A pure mechanical isolation package incorporating Invar gantry supports and liquid-chilled camera mounts adds $34,000 in direct non-recurring engineering costs per cell and $12,500 in physical hardware component costs.
A software-focused thermal compensation package requires $42,000 in total upfront algorithm development costs, while adding only $850 per unit for embedded thermistor arrays and controller hardware interface cards.
Because tooling deposits commit buyers early in procurement, selecting a software-driven thermal mitigation route lowers physical hardware cost per cell by amortizing non-recurring engineering expenses across larger production volumes. Software compensation models can fail during extreme thermal events, leading to unrecoverable false-call rates during summer production peaks.
- Thermal Isolation Enclosures separate active cooling air channels from internal structural mounting frames to prevent draft-induced gantry deflection.
- Invar Structural Tie-Bars stabilize critical camera distance vectors across wide thermal swings during continuous line operations.
- Closed-Loop Temperature Sensing distributes digital thermistor arrays across camera bodies, granite bases, and frame extrusions for real-time monitoring.
- Dynamic Pixel Re-Mapping updates camera pixel coordinate grids automatically using real-time temperature telemetry inputs.
System integrators frequently classify thermal drift qualification testing as an optional service rather than a core functional acceptance metric.
| Scope Strategy Option | Mechanical NRE Allocation (Hours) | Software NRE Allocation (Hours) | Hardware Cost Adder per Unit (USD) | Residual Thermal Uncertainty (µm) |
|---|---|---|---|---|
| Baseline Air-Cooled Turnkey Shell | 15 | 20 | $0 | ±12.5 |
| Software Dynamic Compensation Pack | 25 | 160 | $850 | ±4.2 |
| Isolated Structural Invar Frame | 140 | 40 | $12,500 | ±1.8 |
| Full Active Liquid Chilled Enclosure | 210 | 85 | $24,000 | ±0.5 |
Active liquid chillers also require dedicated seasonal maintenance routines to prevent coolant fouling and pump degradation over time.
Standard commercial terms treat factory ambient control as entirely the customer’s responsibility once cell installation accepts electrical power, leaving unresolved thermal drift disputes to the buyer.

Transfer
Moving inspection cell designs from pilot validation bays to high-volume secondary production facilities exposes gaps in thermal testing documentation. A vision cell qualified inside a climate-controlled pilot plant operating at a tight 21°C ± 0.5°C tolerance often encounters failure when deployed to a overseas production line where ambient temperatures fluctuate between 18°C and 29°C. Transfer packages must include complete thermal drift qualification dossiers containing raw thermistor logging data, calibration grid test images, dynamic transformation algorithm source files, and mechanical gantry expansion models. Without these assets, local engineering teams at the recipient manufacturing plant cannot diagnose inline measurement errors or adapt inspection thresholds to local environmental conditions.
Pilot lines rarely mirror factory HVAC flows. Direct overhead air conditioning vents located above inline inspection cells introduce localized cooling drafts, causing non-uniform structural bowing along gantry beams. Documenting site acceptance testing conditions requires mapping external ambient airflow velocities alongside internal cell enclosure temperature profiles.
Factory Acceptance Testing Thermal Qualification Specifications
Standard factory acceptance runs measure camera resolution immediately after cold startup, obscuring late-stage thermal drift defects. Factory acceptance testing requirements must incorporate a four-hour continuous thermal soak run while scanning calibrated low-expansion targets. The machine builder must document spatial coordinate retention across the entire operational warming curve before securing final sign-off approval.
Because thermal equilibrium takes two hours, verifying that spatial coordinate drift stays within specified sub-micron limits throughout the thermal soak phase prevents shipping unstable inspection machinery to client assembly plants. Handover documentation must attach raw spatial error vector maps recorded at 15-minute intervals during factory acceptance runs.

Site Acceptance Testing and Environmental Harmonization
Replicating target drift performance at recipient manufacturing plants requires identical ambient HVAC airflow velocity parameters. Outside surface mount technology assembly lines, silicon wafer steppers face similar expansion physics where fractional Kelvin shifts distort sub-nanometer lithography patterns. In optical cell packaging, equivalent principles govern gantry alignment on factory floors.
Site acceptance testing procedures validate that thermal isolation enclosures operate effectively under local HVAC airflow configurations.
Final sign-off documentation establishes clear ownership of thermal calibration logs. Transferring inspection cell ownership to contract manufacturing partners involves providing automated scripts that run periodic thermal baseline verification checks. Standardizing these qualification routines ensures long-term operational consistency across global manufacturing networks.
Inspection cells validated under active thermal loads retain coordinate accuracy across diverse manufacturing sites far more consistently than units verified only at cold startup.