Reconciling High Frequency Test Jig Attenuation Variances across Global Electronics Contract Manufacturing Sites
Cross site RF test jig attenuation variances demand de-embedded scattering matrices, golden board transfer protocols, and automated thermal drift offsets.

Trace
High-frequency test fixtures operating between 2.4 gigahertz and 24 gigahertz drift off baseline because of interconnect wear, laminate dielectric variations, and mechanical tolerances. When an identical radio module shifts from a primary plant in Penang to a secondary facility in Guadalajara, minor hardware differences between test beds alter measured transmitter power and receiver sensitivity. A signal path showing 1.5 decibels of attenuation on a bench in Asia can easily show 2.8 decibels on the same setup in the Americas.
The resulting discrepancy drives false yield drops, triggers unnecessary component quarantines, and starts commercial disputes over who pays for rejected boards.
Dynamic Insertion Loss Mechanics
Signal attenuation across factory test beds scales sharply as operating frequencies move into microwave bands. Lower frequencies tolerate simple cable loss corrections during testing. Once operation crosses 5.8 gigahertz, micro-pitting on spring probe tips, tolerance stackups in blind-mate connectors, and shield wear in flexible coaxial jumpers introduce dynamic signal loss, turning every mechanical interface into an uncharacterized complex impedance mismatch.
Automated test equipment switches experience contact resistance degradation over thousands of operational cycles. Spring-loaded pogo pins pressing directly against printed circuit board test pads accumulate solder oxides and flux residues, driving contact resistance from 20 milliohms up to several ohms. Cable flexure ruins repeatability ~ rotating a semi-rigid coaxial jumper by fifteen degrees during manual board loading alters the insertion loss profile enough to throw an RF power calibration out of spec.
- Spring probe micro-pitting causes localized contact impedance spikes after five thousand mating cycles, driving signal degradation at gigahertz frequencies.
- Dielectric relaxation variation across laminate lots shifts transmission line performance by up to eight percent in humid ambient conditions.
- Coaxial cable shield braiding fatigue increases loss along interconnects subjected to repetitive manual fixture clamping.
- RF switch electromechanical wear changes contact surface resistance across matrix channels, producing erratic attenuation steps during test runs.

Substrate Glass Weave Impact
The micro-structure of a PCB laminate alters phase velocity and conductor loss along RF signal tracks. Standard woven glass fabrics introduce dielectric variations depending on whether a trace runs over a glass yarn bundle or an unreinforced resin pocket. High-density glass styles like 1080 feature smaller resin pockets than heavier weaves like 7628, offering tighter dielectric constant control across the panel.
High ambient humidity in factory environments compounds laminate dielectric loss. Epoxies absorb moisture when climate control systems fluctuate, raising the test substrate’s loss tangent. A fixture panel fabricated in Taiwan with local laminates exhibits distinct dielectric loss compared to a panel milled in Vietnam from a different material batch.
Precision connectors alone cannot fix this; without continuous environment logging, physical variations in the substrate stay buried inside yield figures.
Coaxial cable flexure cycles introduce localized phase shift and attenuation variance long before outer sheath degradation becomes visible to optical inspection.
Engineers at contract sites frequently attribute cross-line test discrepancies to normal batch-to-batch component variation rather than uncalibrated fixture attenuation.


Probe
Extracting true device-under-test behavior requires mathematically isolating test fixture parasitics. De-embedding techniques separate product performance from the board traces, coaxial adapters, and switching matrices between the DUT and the measurement instrument. Without precise reference plane shifting, test systems measure the combined performance of the radio and the fixture, making cross-site benchmarking useless.

De Embedding Methodologies Compared
Vector network analyzers use calibration matrices to shift the measurement reference plane directly to the semiconductor contacts. Traditional Short-Open-Load-Through calibration standardizes coaxial interfaces, but it cannot correct for non-standard planar transmission lines inside custom fixtures. Advanced de-embedding relies on calibration coupons made from the same substrate batch as the fixture to capture actual trace loss.
The IEEE 370 standard details algorithms for removing fixture effects using 2X Thru calibration structures. This approach mathematically splits a symmetric fixture coupon, generating two-port scattering parameters for both input and output halves. Once raw S-parameters reveal the impedance mismatch, the mathematical model subtracts the fixture attenuation profile from DUT measurement data in real time during production testing.
| Methodology | Calibration Standard Requirements | Residual Loss Uncertainty (24 GHz) | Execution Time per Bench | Factory Operator Skill Level |
|---|---|---|---|---|
| IEEE 370 2X Thru | Unpopulated coupon board | +/- 0.15 dB | 15 minutes | Intermediate Technician |
| SOLT (Short Open Load Thru) | Coaxial calibration kit | +/- 0.45 dB | 45 minutes | Advanced Test Engineer |
| TRL (Thru Reflect Line) | Custom substrate coupons | +/- 0.08 dB | 60 minutes | RF Specialist |
| 2-Port Data Shift Offset | Software file compensation | +/- 0.85 dB | 2 minutes | Line Operator |
Vector Network Analyzer Calibration Transfer
Instrument setups move between manufacturing plants using standardized Touchstone files. A master calibration file generated at the lead engineering site contains frequency-dependent S-parameter matrices covering the product’s full operating spectrum. Test software at secondary sites imports these S2P files to apply correction curves to measured power values.
- Connect the electronic calibration module directly to the primary vector network analyzer ports using torque-controlled wrenches.
- Execute a full two-port scattering parameter sweep across the designated product operating spectrum from 100 megahertz to 28 gigahertz.
- Measure the unpopulated fixture Thru coupon to generate the raw fixture S-parameter file in two-port touchstone format.
- Process the raw S-parameter file through an IEEE 370 de-embedding algorithm to extract the fixture attenuation matrix.
- Import the resulting correction matrix into the automated production test software running on the factory floor.
- Verify the corrected bench measurement using a characterized golden reference board before approving production testing.
IPC 1791 requirements dictate that vector network analyzer calibration files carry explicit environment records including ambient temperature, relative humidity, and cable serial numbers.
Standard quality agreement addendums under ISO 17025 mandate that uncalibrated test fixture attenuation data invalidates all passed RF yield records generated during that operational shift.


Spread
Modeling total attenuation tolerance across factory locations highlights how easily cumulative RF measurement errors compound. When individual signal path elements exhibit small manufacturing variations, the total attenuation spread can exceed the product’s pass/fail window. Quantifying this variance requires a detailed line-item loss budget for every component in the test chain.
Multi Site Attenuation Variance Calculation
Discrepancies in measured transmitter power usually stem from stacked tolerances across fixture channels. Take a 24 gigahertz millimeter-wave module tested across facilities in Penang, Shenzhen, and Guadalajara. Each plant uses identical fixture schematics, but local component sourcing, mechanical wear, and bench temperatures create measurable divergence.
Line loss accumulates across five primary elements: flexible jumper cables, electromechanical switches, blind-mate interconnect sockets, fixture traces, and thermal expansion offsets. Tolerance stackups dictate overall limits, as shown by how small local variations compound into major yield discrepancies across sites.
| Attenuator Element / Loss Contributor | Penang Line 1 (dB) | Shenzhen Line 4 (dB) | Guadalajara Line 2 (dB) | Max Variance across Sites (dB) |
|---|---|---|---|---|
| Coaxial Jumper Cables (1.5m, semi-rigid) | 0.25 | 0.60 | 0.85 | 0.60 |
| Electromechanical RF Matrix Switch | 0.40 | 0.75 | 0.50 | 0.35 |
| Blind-Mate Coaxial Socket & Pins | 0.15 | 0.30 | 0.45 | 0.30 |
| Fixture PCB Trace & Substrate Loss | 0.30 | 0.50 | 0.40 | 0.20 |
| Thermal Expansion Drift Offset (32C vs 20C) | 0.10 | 0.35 | 0.20 | 0.25 |
| Total System Attenuation Offset | 1.20 | 2.50 | 2.40 | 1.30 |
| Assumes 24.0 GHz CW test signal, 50-ohm nominal line impedance, IEEE 370 de-embedding unapplied. | ||||
The total attenuation spread between the Penang bench (1.20 dB) and the Shenzhen bench (2.50 dB) reaches 1.30 decibels. If a radio module carries an output power specification of +18.0 dBm with a tolerance of +/- 1.0 dB (a valid range of 17.0 dBm to 19.0 dBm), a unit actually producing 17.5 dBm passes in Penang (measuring 17.6 dBm after uncorrected fixture loss) but fails in Shenzhen (measuring 16.2 dBm). The product design meets spec, yet the plant rejects good boards and drives up unit costs due to uncompensated fixture loss.
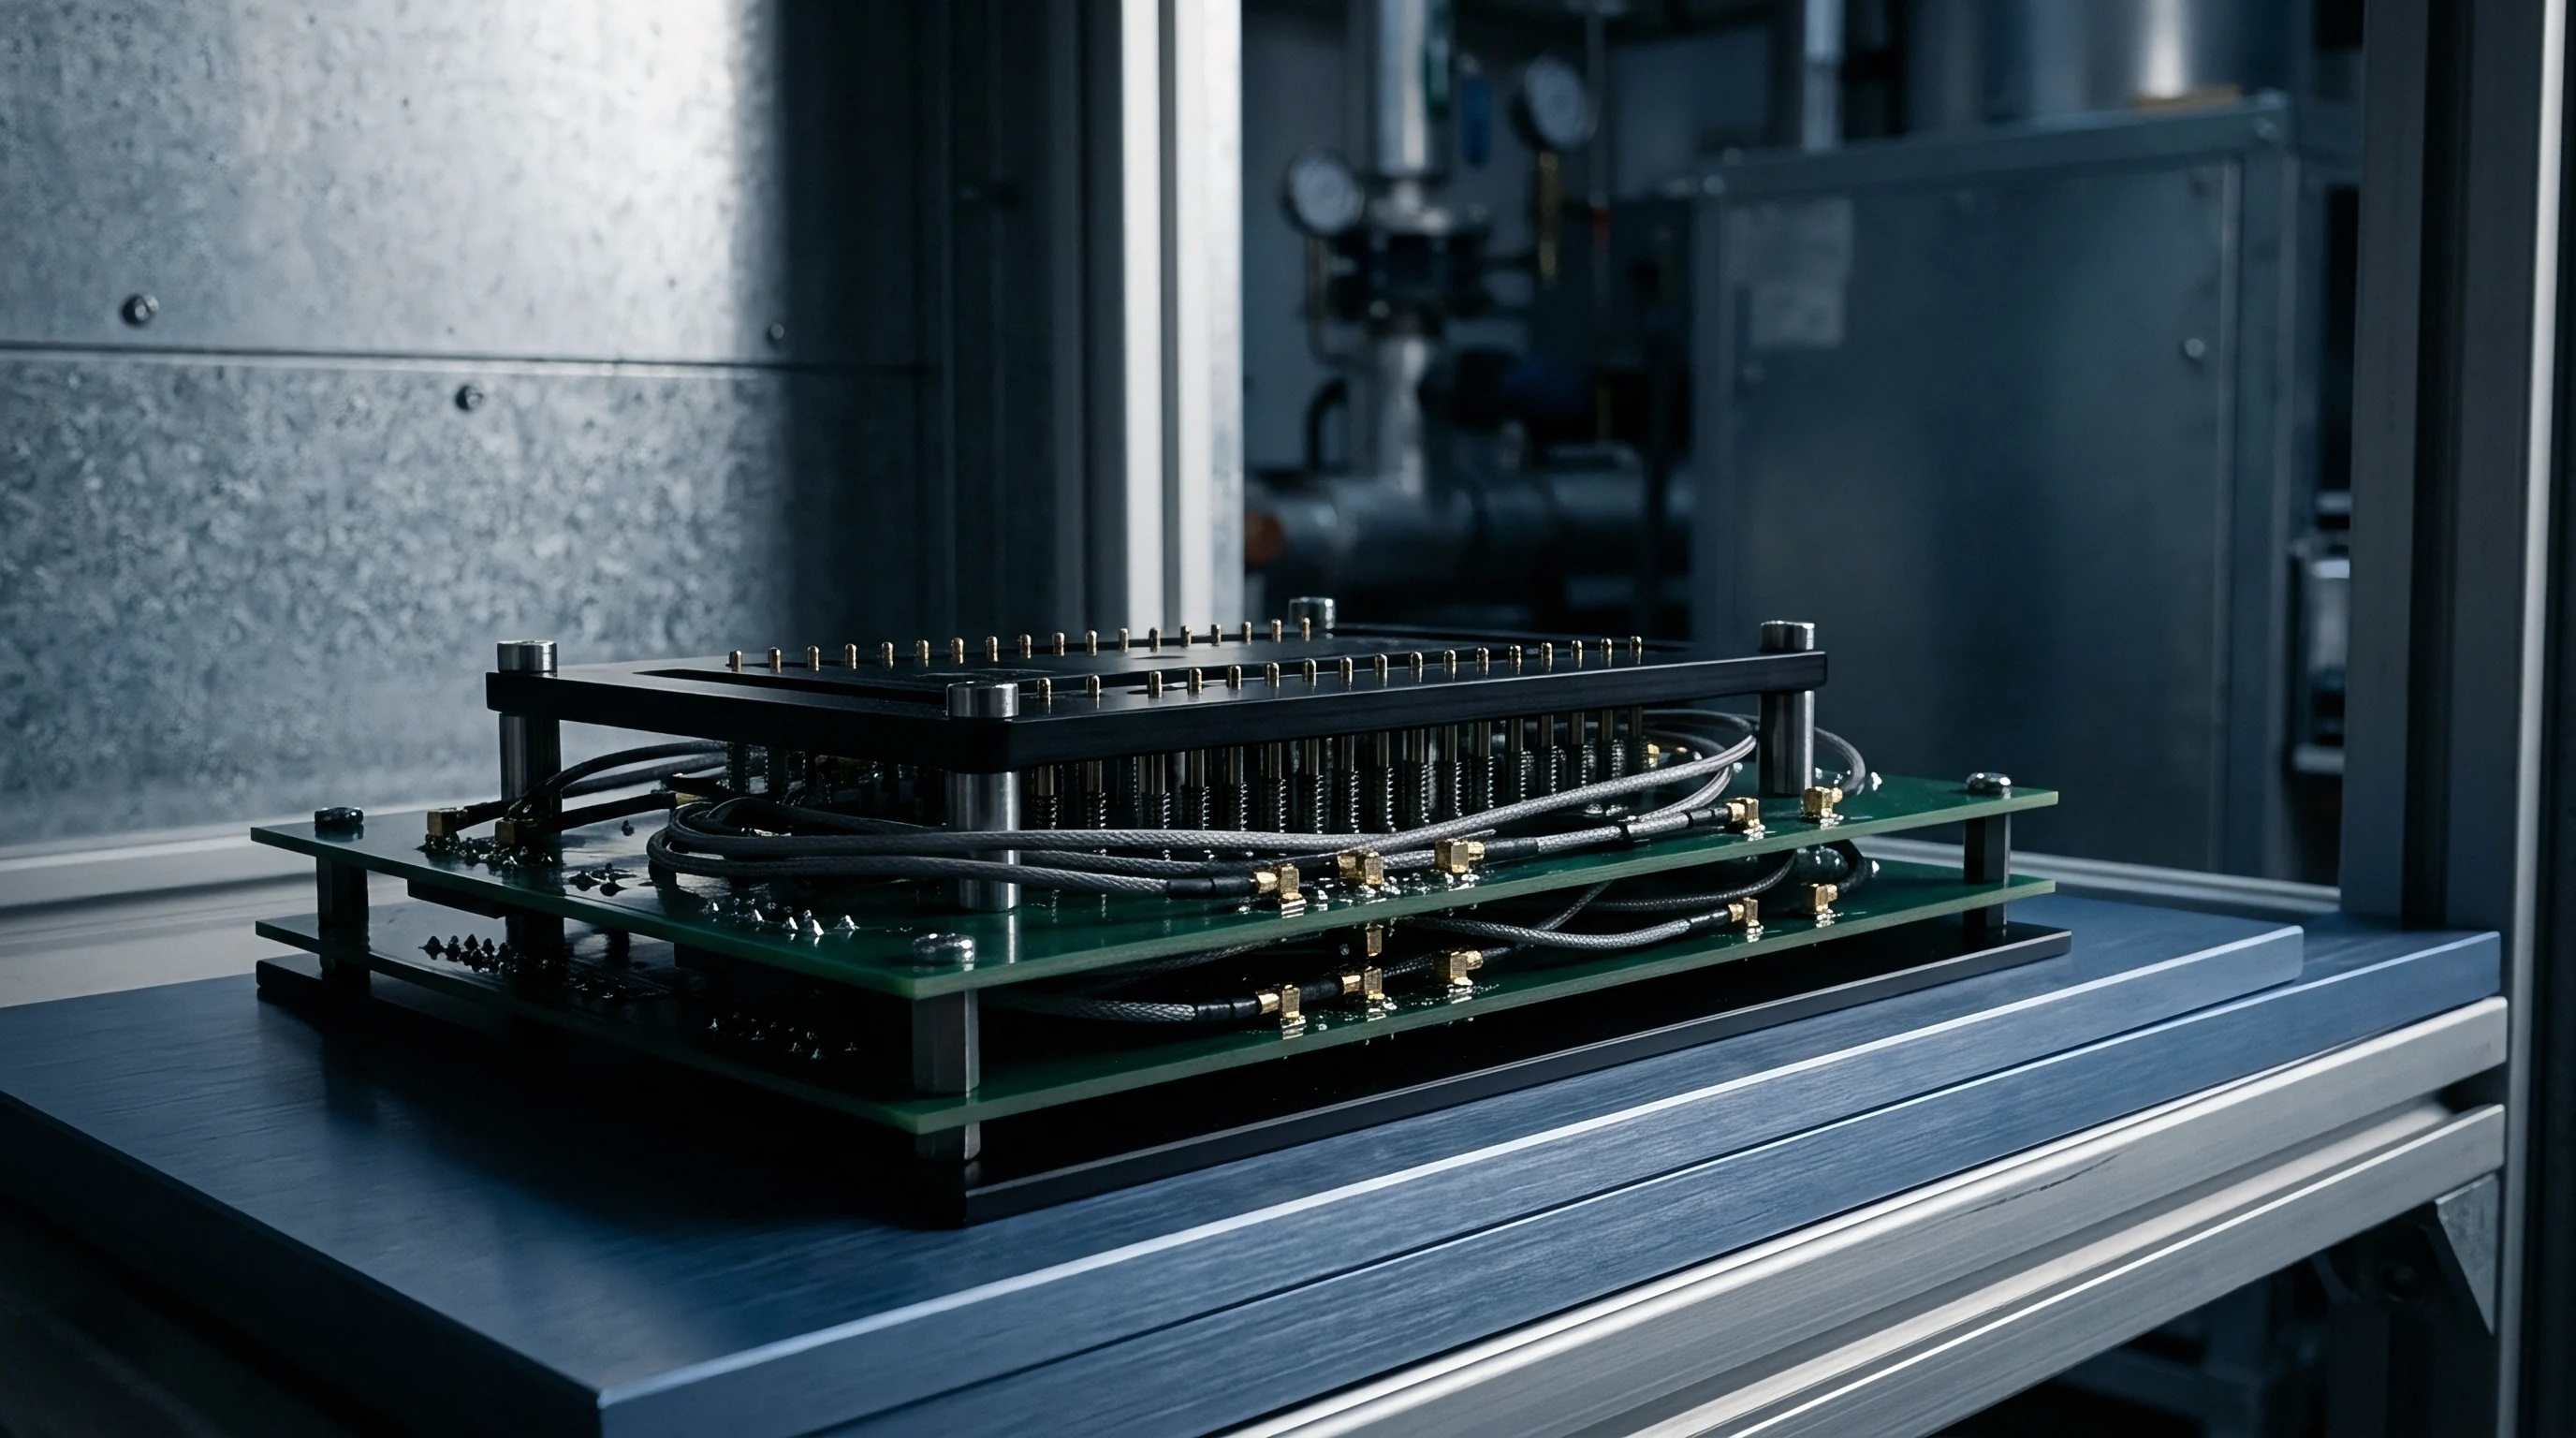
Thermal Shift Model at Microwave Frequencies
Temperature swings on the factory floor expand copper traces while altering substrate dielectric constants. Copper electrical resistivity rises by 0.393 percent per degree Celsius. On a floor without strict climate control where ambient temperatures range from 20 degrees Celsius at night to 35 degrees Celsius in the afternoon, uncompensated trace resistance shifts insertion loss by nearly six percent.
Dielectric loss tangent drift introduces even more thermal variance. Rogers 4350B laminates maintain relatively stable dielectric performance, but standard FR-4 grades show significant loss tangent increases above 30 degrees Celsius. Because thermal drift alters impedance, high-frequency fixtures operating in tropical plants without tight environmental controls need real-time temperature compensation built into the test executive code.
A two-decibel variance in fixture attenuation at 24 gigahertz shifts measured RF transmitter yield by fifteen percent across identical product batches.
Unreconciled fixture attenuation errors depress reported production yields, landing healthy RF sub-assemblies in scrap or quarantine bins.
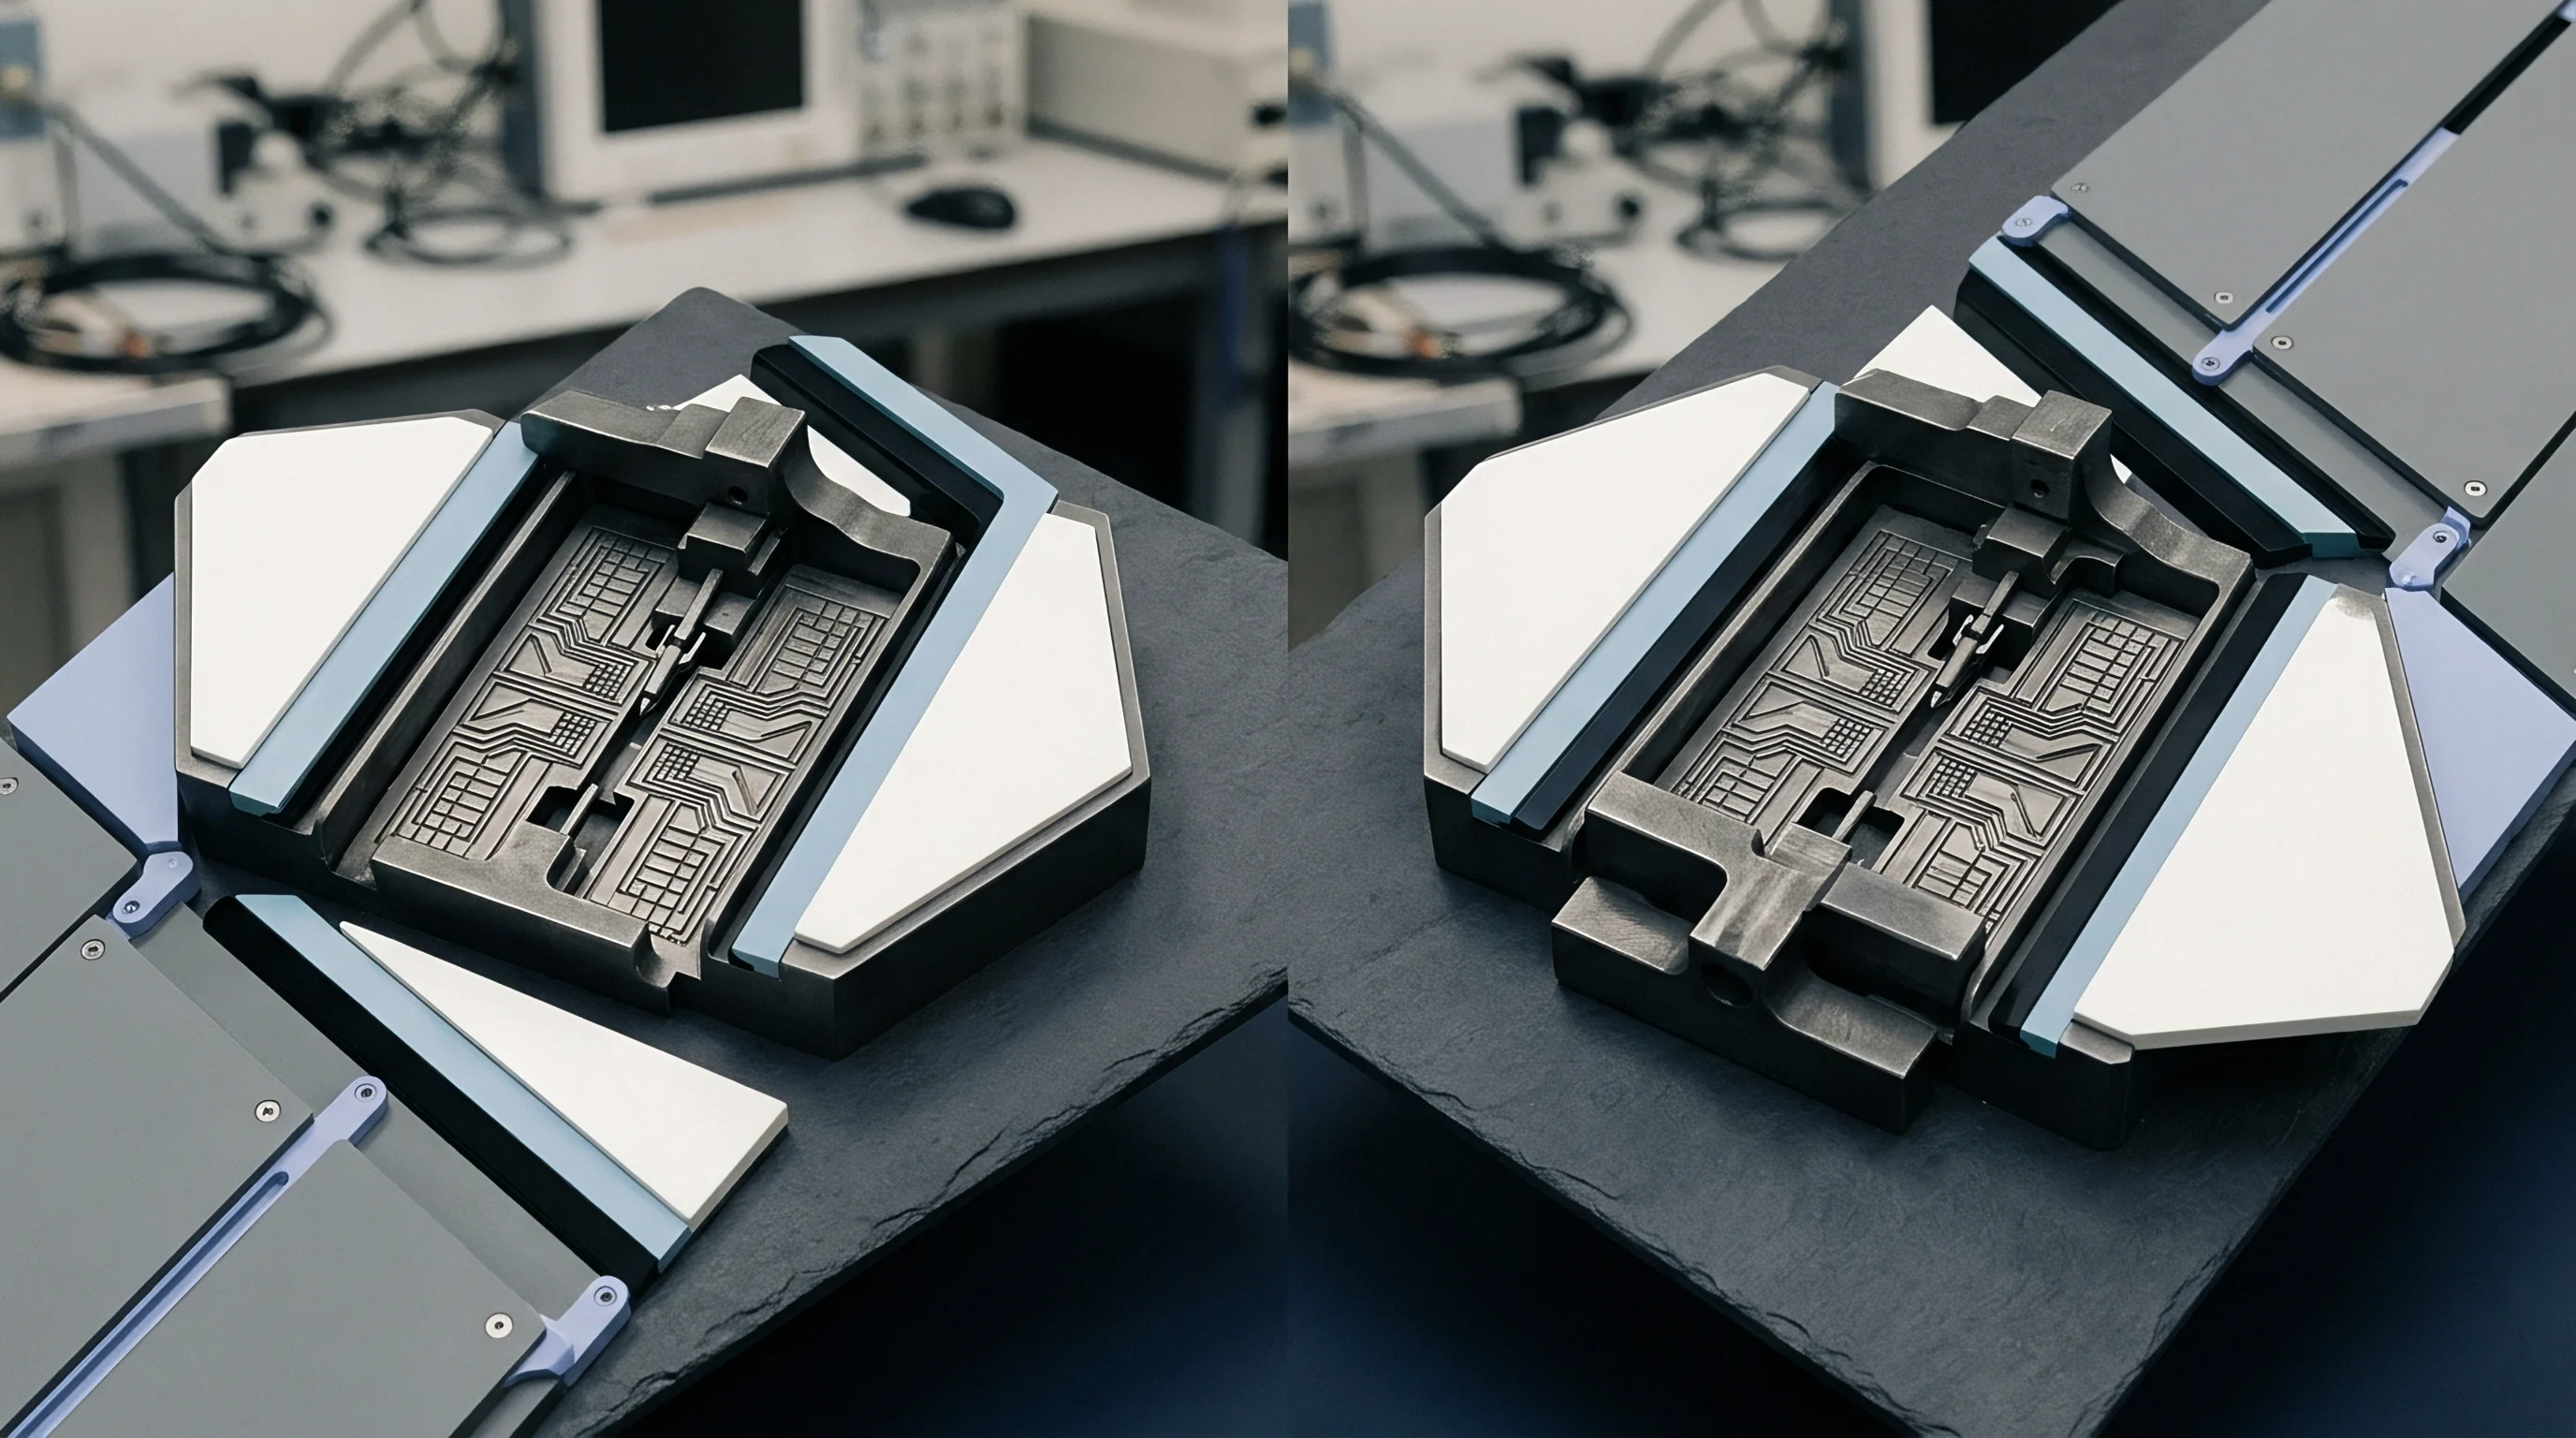

Handover
Transferring high-frequency product builds between manufacturing plants requires full duplication of both hardware specifications and calibration files. A complete transfer package goes well beyond fabrication drawings and assembly schematics ~ it must include every S-parameter dataset, mechanical clamping specification, and calibration routine needed to replicate the test system.
Golden Board Control Routines
Physical reference boards anchor cross-site test benchmarking. A set of characterized golden units undergoes laboratory verification at the design center before deployment to production sites. These boards carry certificates specifying exact transmitter power, receiver sensitivity, and harmonic emissions across all operating channels, though they do degrade over time.
Manufacturing sites reserve golden units for bench verification rather than high-volume testing. Every morning, or whenever a cable is replaced, operators run a sweep with the assigned golden board. If bench measurements drift more than 0.25 decibels from the certified baseline, test software locks the station until technicians complete a re-calibration.
- De-embedded S-parameter datasets stored in raw Touchstone S2P file format detailing complete two-port attenuation and return loss measurements across operating frequency bands.
- Gerber X2 artwork outputs containing copper trace dimensions, layer stackup tolerances, dielectric laminate specifications, and controlled impedance targets.
- Mechanical CAD clamp drawings defining pin compression depths, socket actuation force targets, and coaxial cable strain-relief routing geometry.
- Automated test software scripts incorporating explicit limit offsets, instrument driver revisions, and automated temperature correction coefficients.
- Calibration frequency schedules defining mandatory vector network analyzer re-calibration cycles, probe replacement intervals, and cable flexure inspection triggers.
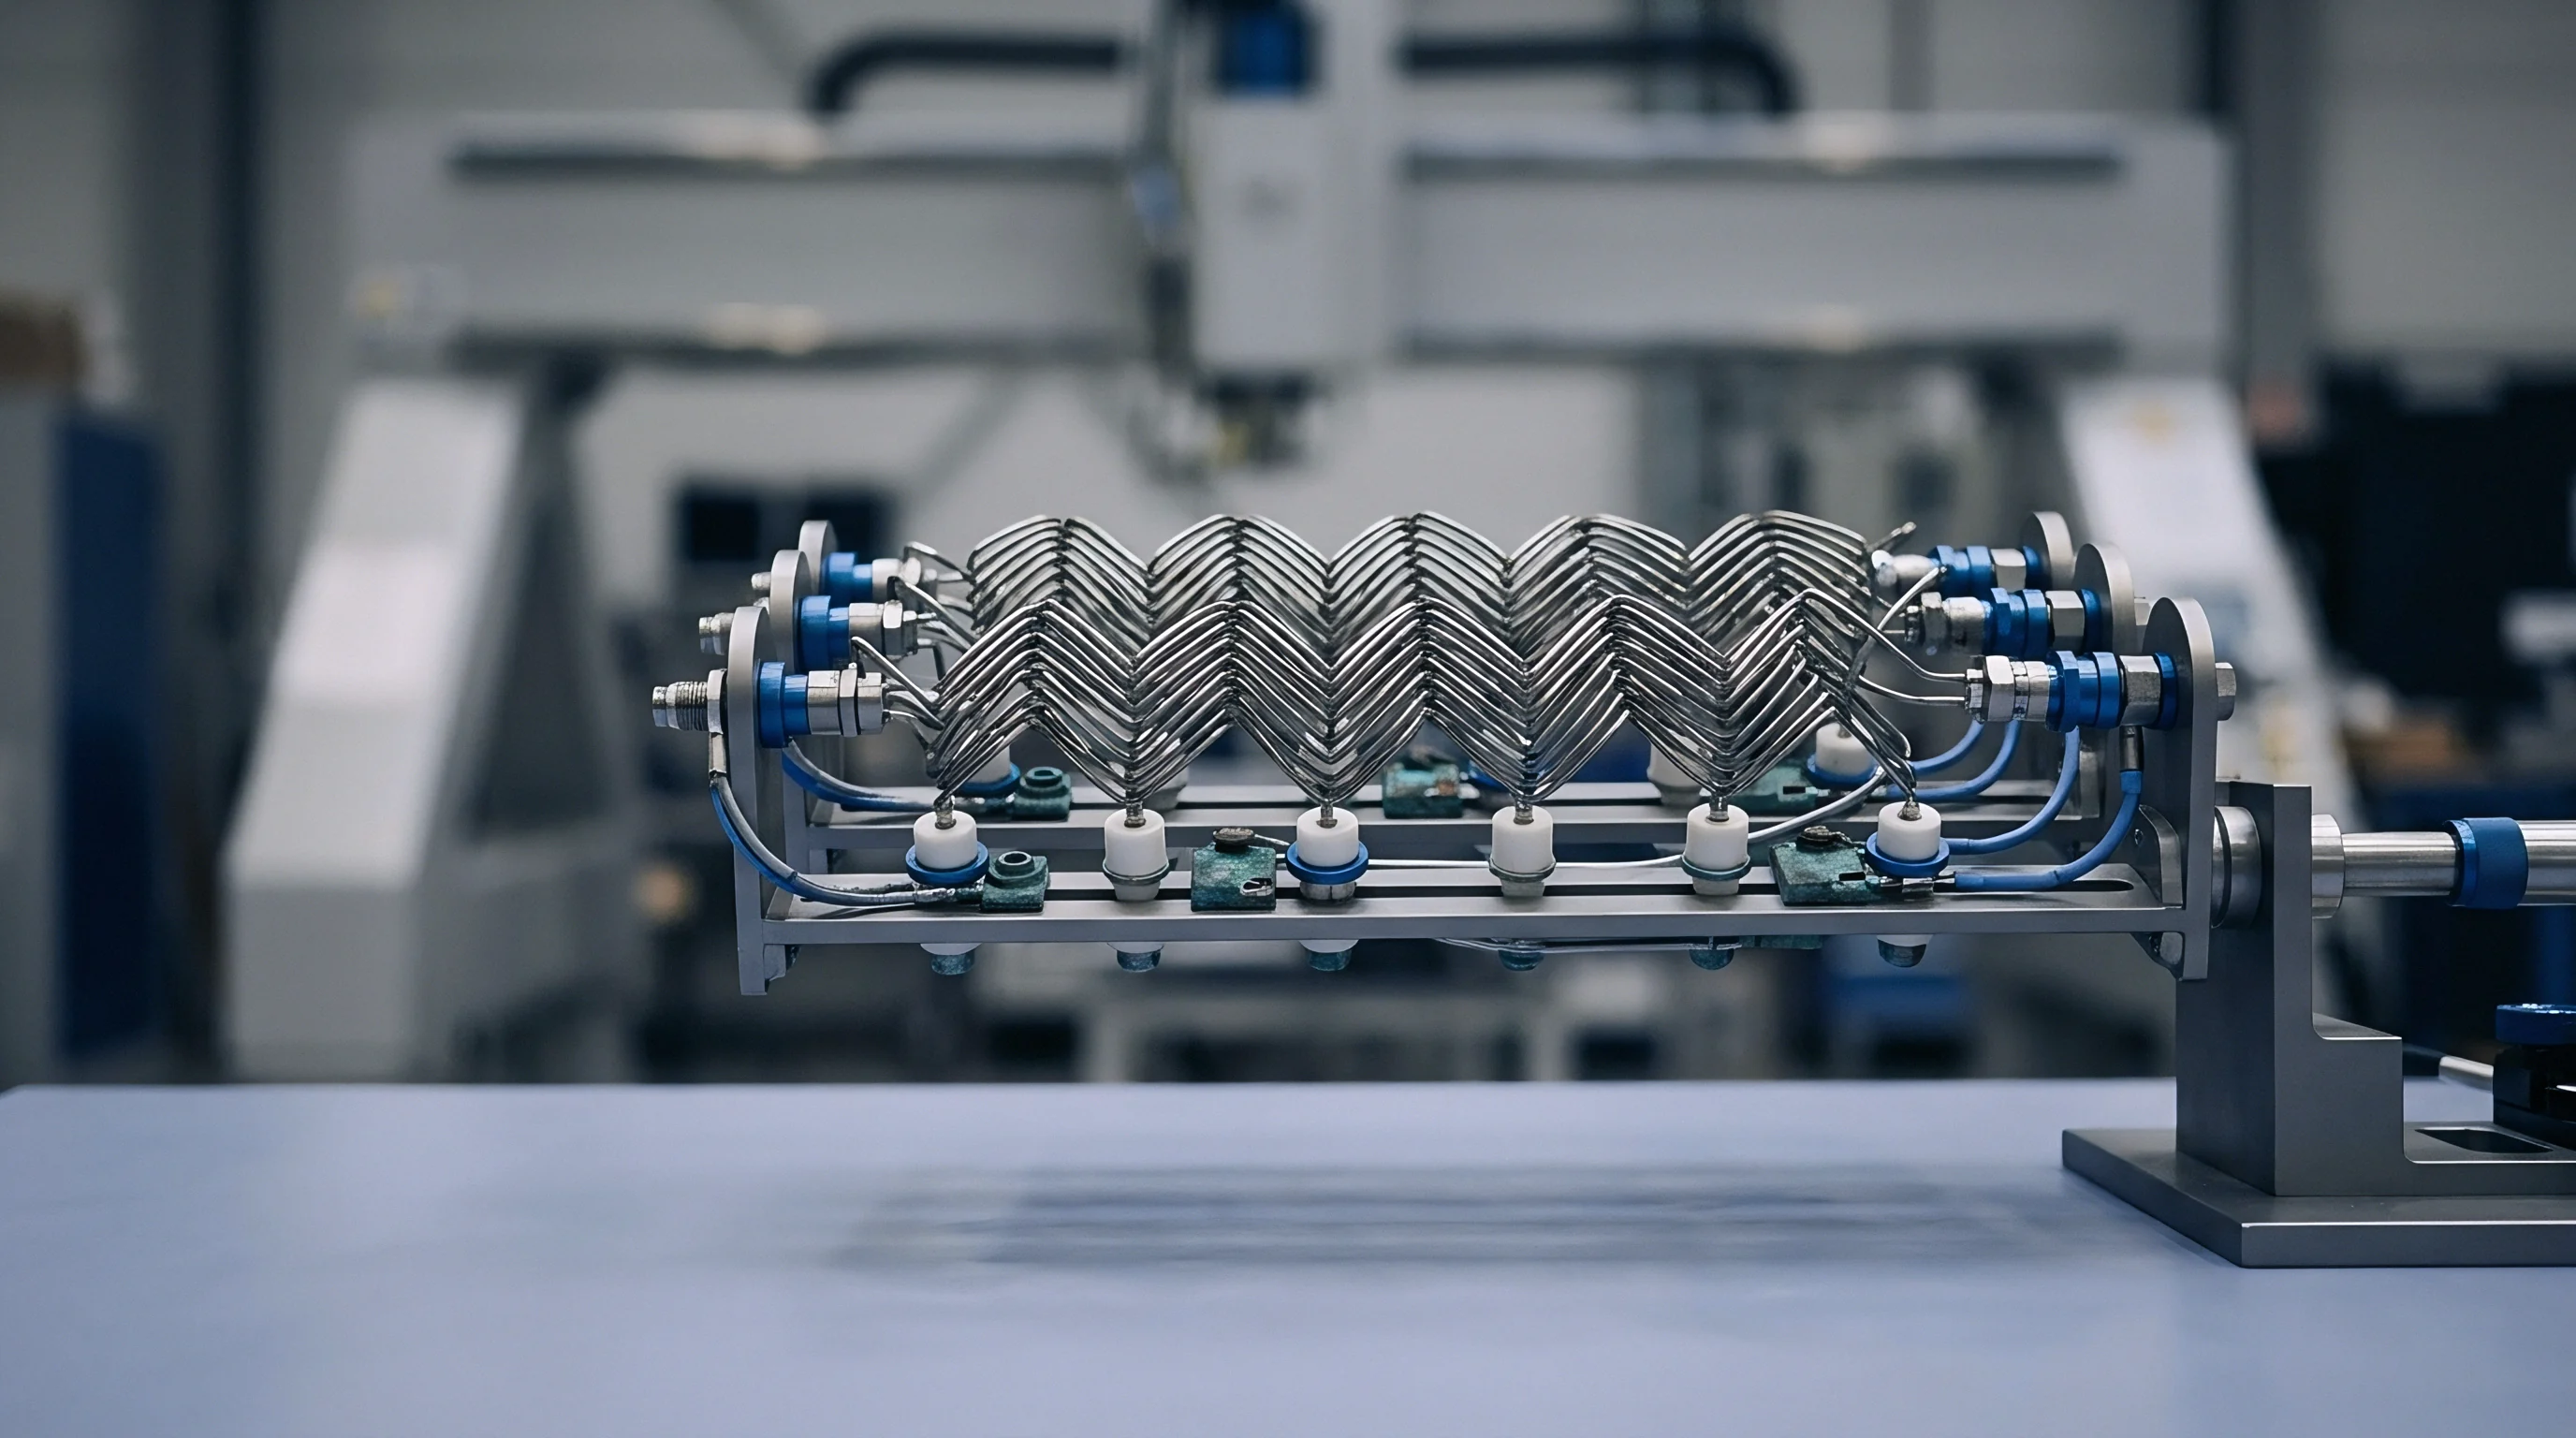
Replication Package Contents
Documentation packages must supply every schematic, drawing, and calibration script required to build twin test stations at secondary sites. Engineering teams sometimes omit minor mechanical hardware, assuming the local plant will source equivalent parts. But substituting an alternative RF switch brand or low-cost coaxial jumpers ruins test equivalence immediately.
Part change notifications must cover fixture components with the same rigor applied to the product bill of materials. When a facility replaces a worn electromechanical switch with a substitute, test engineering files a formal change request with updated IEEE 370 de-embedding matrices. Revision-controlled software repositories ensure each bench pulls the correct dataset automatically based on its hardware serial number.
Golden units reserved for cross-site calibration belong on reference benches rather than daily high-volume test lines.
Identical fixture hardware cannot produce matching yields unless the software compensation algorithms use identical de-embedding matrices.

Liability
Disputes over rejected production lots frequently come down to whether signal loss occurred inside the product or inside the test jig. When a secondary site reports an unexplained ten percent drop in RF yield, the OEM faces immediate financial exposure. Resolving these standoffs requires master service agreements with explicit verification procedures and cost allocation models for test-related scrap.
Commercial Yield Loss Allocation
Contractual terms determine who absorbs losses from false yield drops. If a facility runs production using uncalibrated fixtures or unauthorized component substitutions, liability for re-test labor, delayed shipments, and scrap rests entirely with the factory. Conversely, if yield drops stem from unannounced wafer lot variations, the product owner absorbs the impact.
- Fixture calibration status dictates whether false product failures trigger factory rework charges or OEM yield offset payments under master service terms.
- Golden unit verification logs establish whether measurement drift originated from test hardware wear or actual component batch degradation.
- Unapproved component substitutions in factory test fixtures transfer all financial liability for false yield losses directly to the contract manufacturer.
- Environmental tolerance breaches on the factory floor relieve product design teams from paying unearned re-test labor claims.
| Production Volume Tier | Fixture Variance (dB) | False Rejection Rate | Monthly Retest Labor Cost | Contracted Scrap Liability Owner |
|---|---|---|---|---|
| Low Volume (1k units/mo) | +/- 0.3 dB | 1.2 % | $1,800 | Original Equipment Manufacturer |
| Medium Volume (25k units/mo) | +/- 0.8 dB | 4.5 % | $28,500 | Shared Cost Split (50/50) |
| High Volume (250k units/mo) | +/- 1.5 dB | 12.8 % | $184,000 | Contract Manufacturer Full Absorption |

Non Recurring Engineering Amortization Mismatch
Upfront tooling investments for specialized RF fixtures require clear ownership boundaries to avoid delays when bringing up secondary sites. OEMs often pay non-recurring engineering charges assuming they own the physical hardware and software IP. Without explicit contract wording, contract manufacturers can claim ownership of proprietary calibration routines and Gerber files, effectively locking the customer into a single facility.
Master agreements should define test fixture deliverables as explicit engineering work products transferred upon payment. When moving to a dual-sourcing model, the design site transfers all CAD files, de-embedding algorithms, and mechanical tooling to the secondary facility without added licensing fees. Clear IP boundaries allow product owners to audit benches, replace worn fixtures, and re-establish baseline measurement equivalence without commercial friction.
How global contract manufacturers will standardize de-embedding liability as millimeter-wave frequencies push past seventy gigahertz remains an open commercial question.

Drift
Statistical process control identifies measurement decay across test lines long before final yield numbers drop. Waiting for end-of-shift reports to surface inter-site variance guarantees scrapped product and missed delivery schedules. Modern high-volume RF manufacturing relies on real-time telemetry streaming from network analyzers and power meters directly to central quality dashboards.
Continuous Statistical Monitoring across Facilities
Real-time yield data feeds central engineering databases to highlight localized attenuation trends across lines. By plotting moving averages of measured transmitter power and receiver noise figure across thousands of units, statistical algorithms detect subtle fixture wear before pass/fail limits are breached, even as contact resistance varies across component lots.
A steady drop of 0.05 decibels per hundred test cycles indicates progressive spring probe contamination or coaxial degradation. Centralized monitoring flags the specific channel for maintenance before the line starts falsely rejecting boards. Automatically adjusting measurement offsets based on golden unit telemetry maintains parity across worldwide facilities.
Could Environmental Control Tightening Eliminate Inter Site Discrepancies?
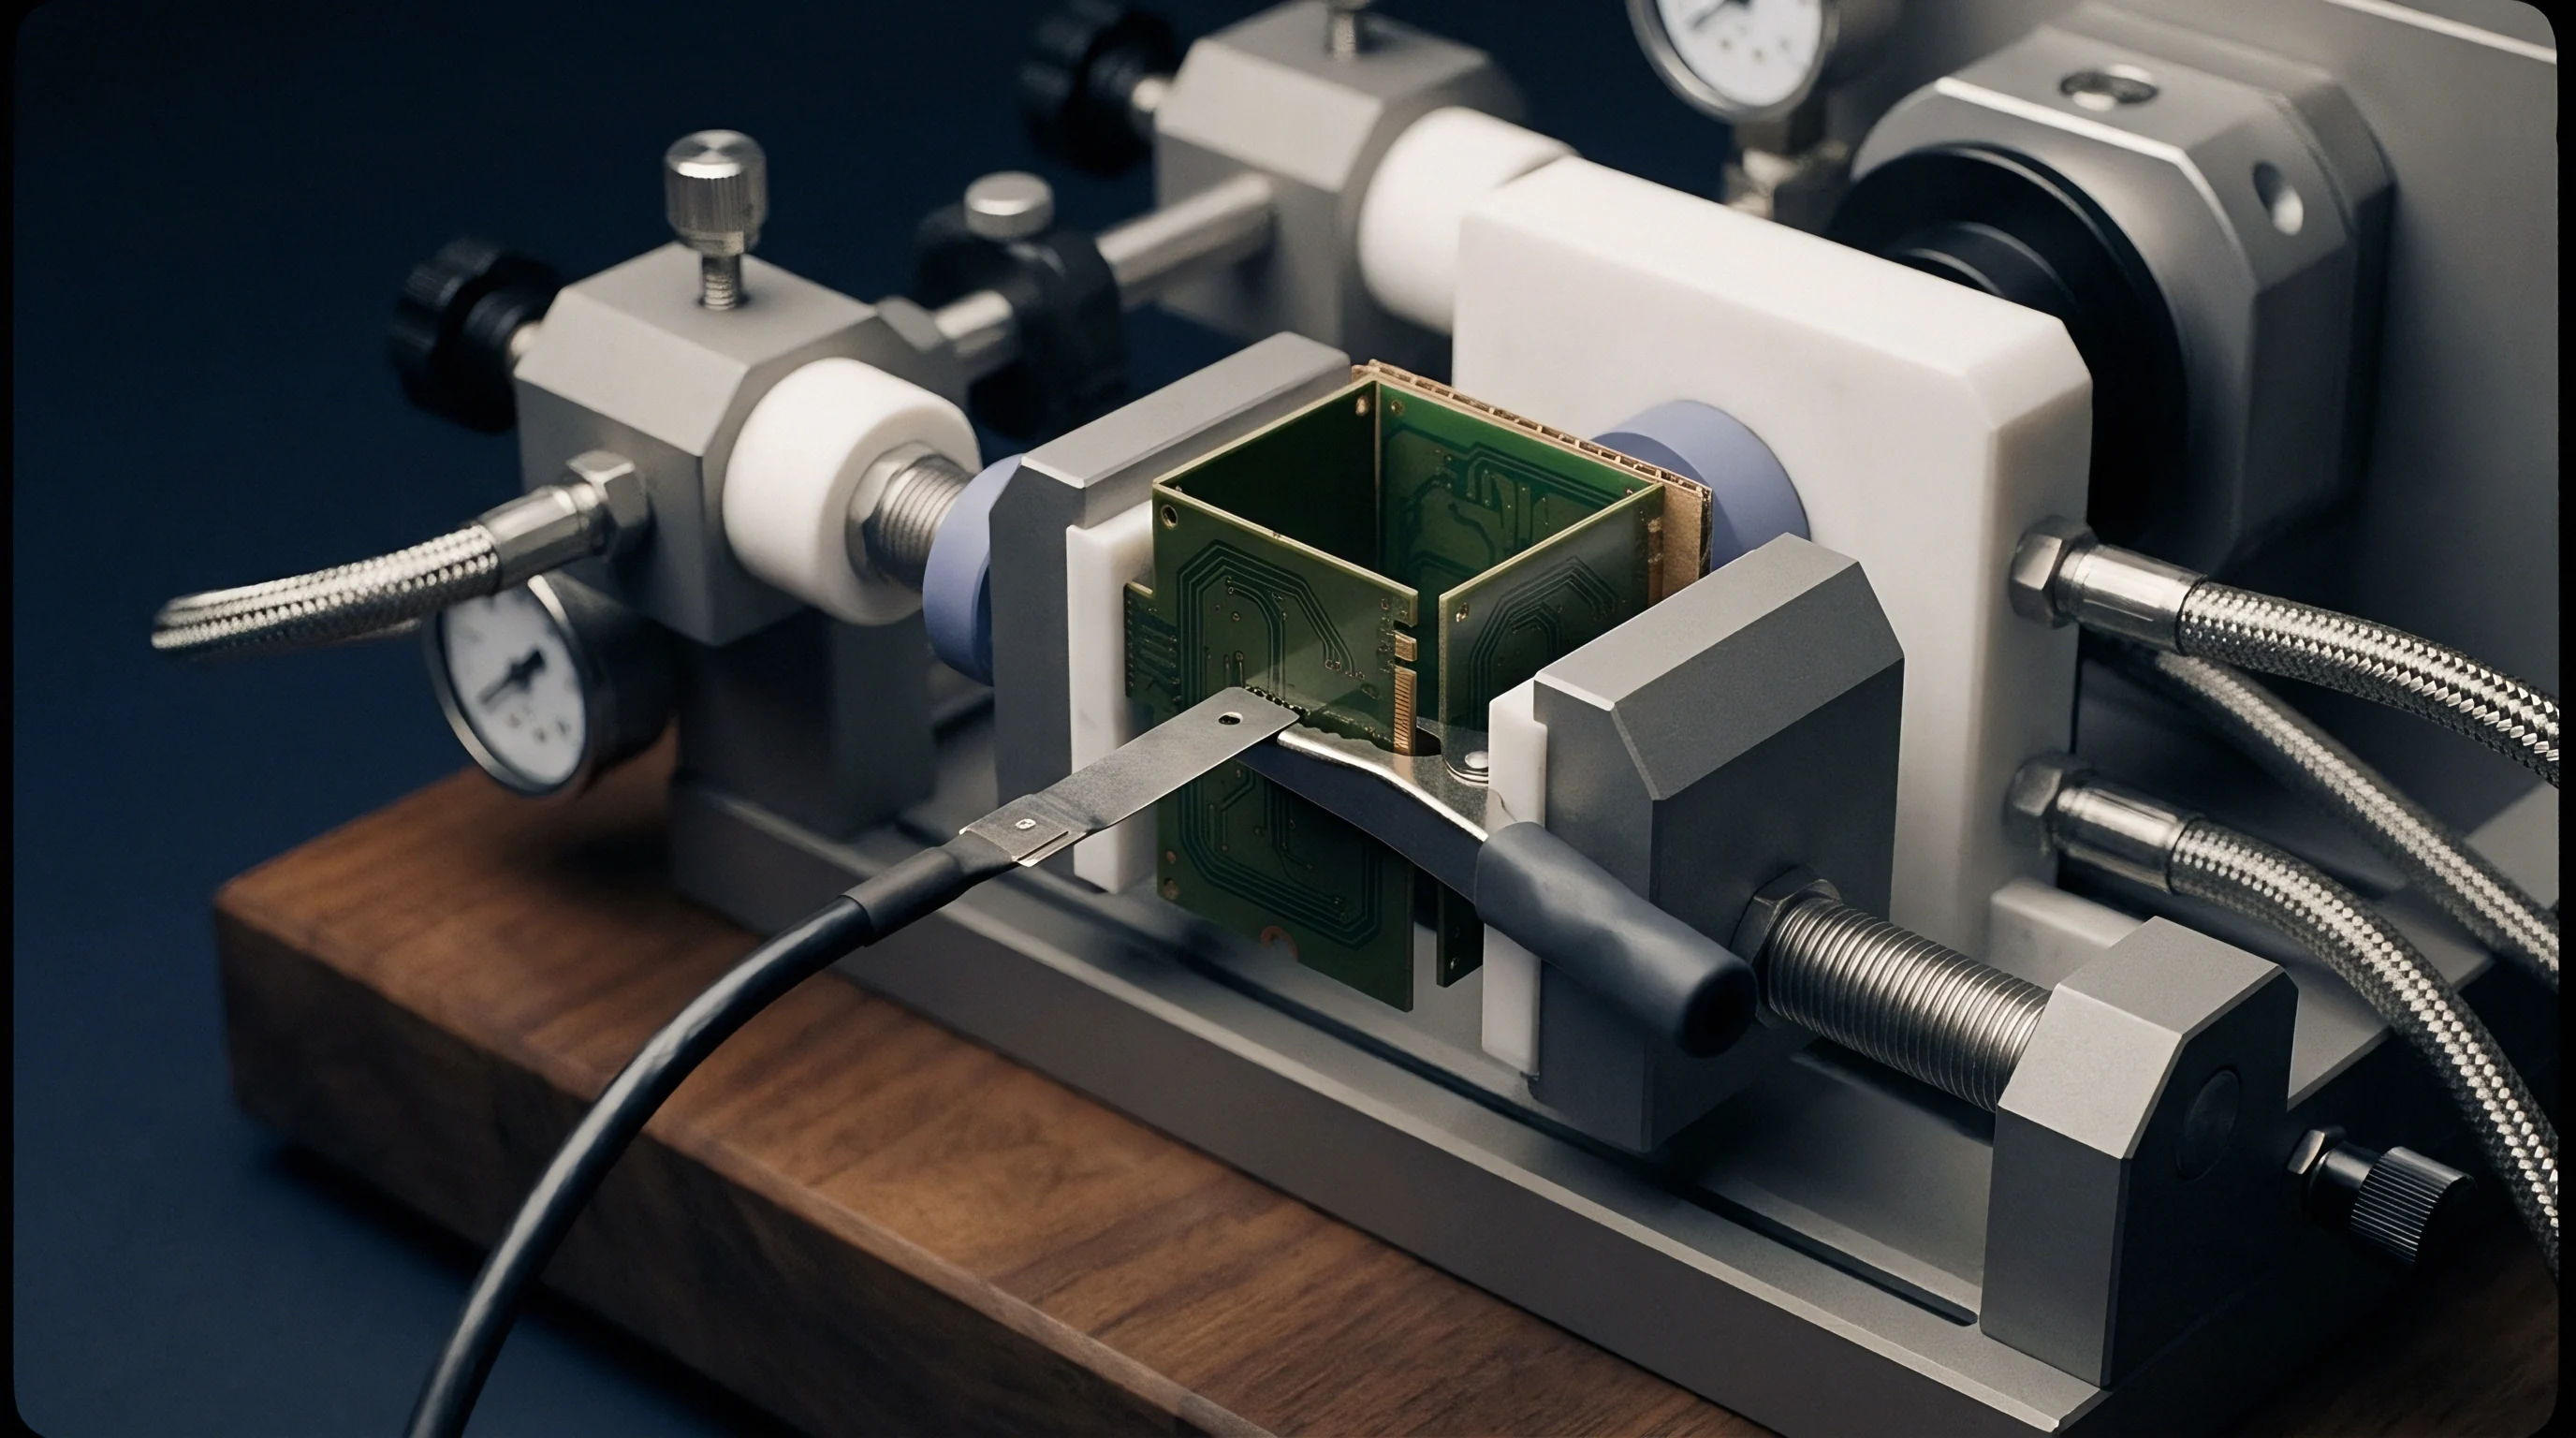
Enclosing high-frequency test stations inside climate-controlled cabinets reduces ambient thermal and humidity shifts. Micro-climate enclosures around sensitive RF test benches maintain ambient temperature within +/- 0.5 degrees Celsius regardless of factory floor conditions. While capital expenditure increases by several thousand dollars per bench, eliminating thermal attenuation drift yields immediate returns by preventing false rejections.
Deploying automated compensation alongside continuous statistical monitoring ensures RF measurements remain consistent across international manufacturing facilities.