Traceable Photometric Standards Transfer for High-Volume Assembly Line Endstops
Lock photometric line endstops to national standards using temperature-stabilized kinematic transfer pucks, documented mismatch factors, and audited custody.

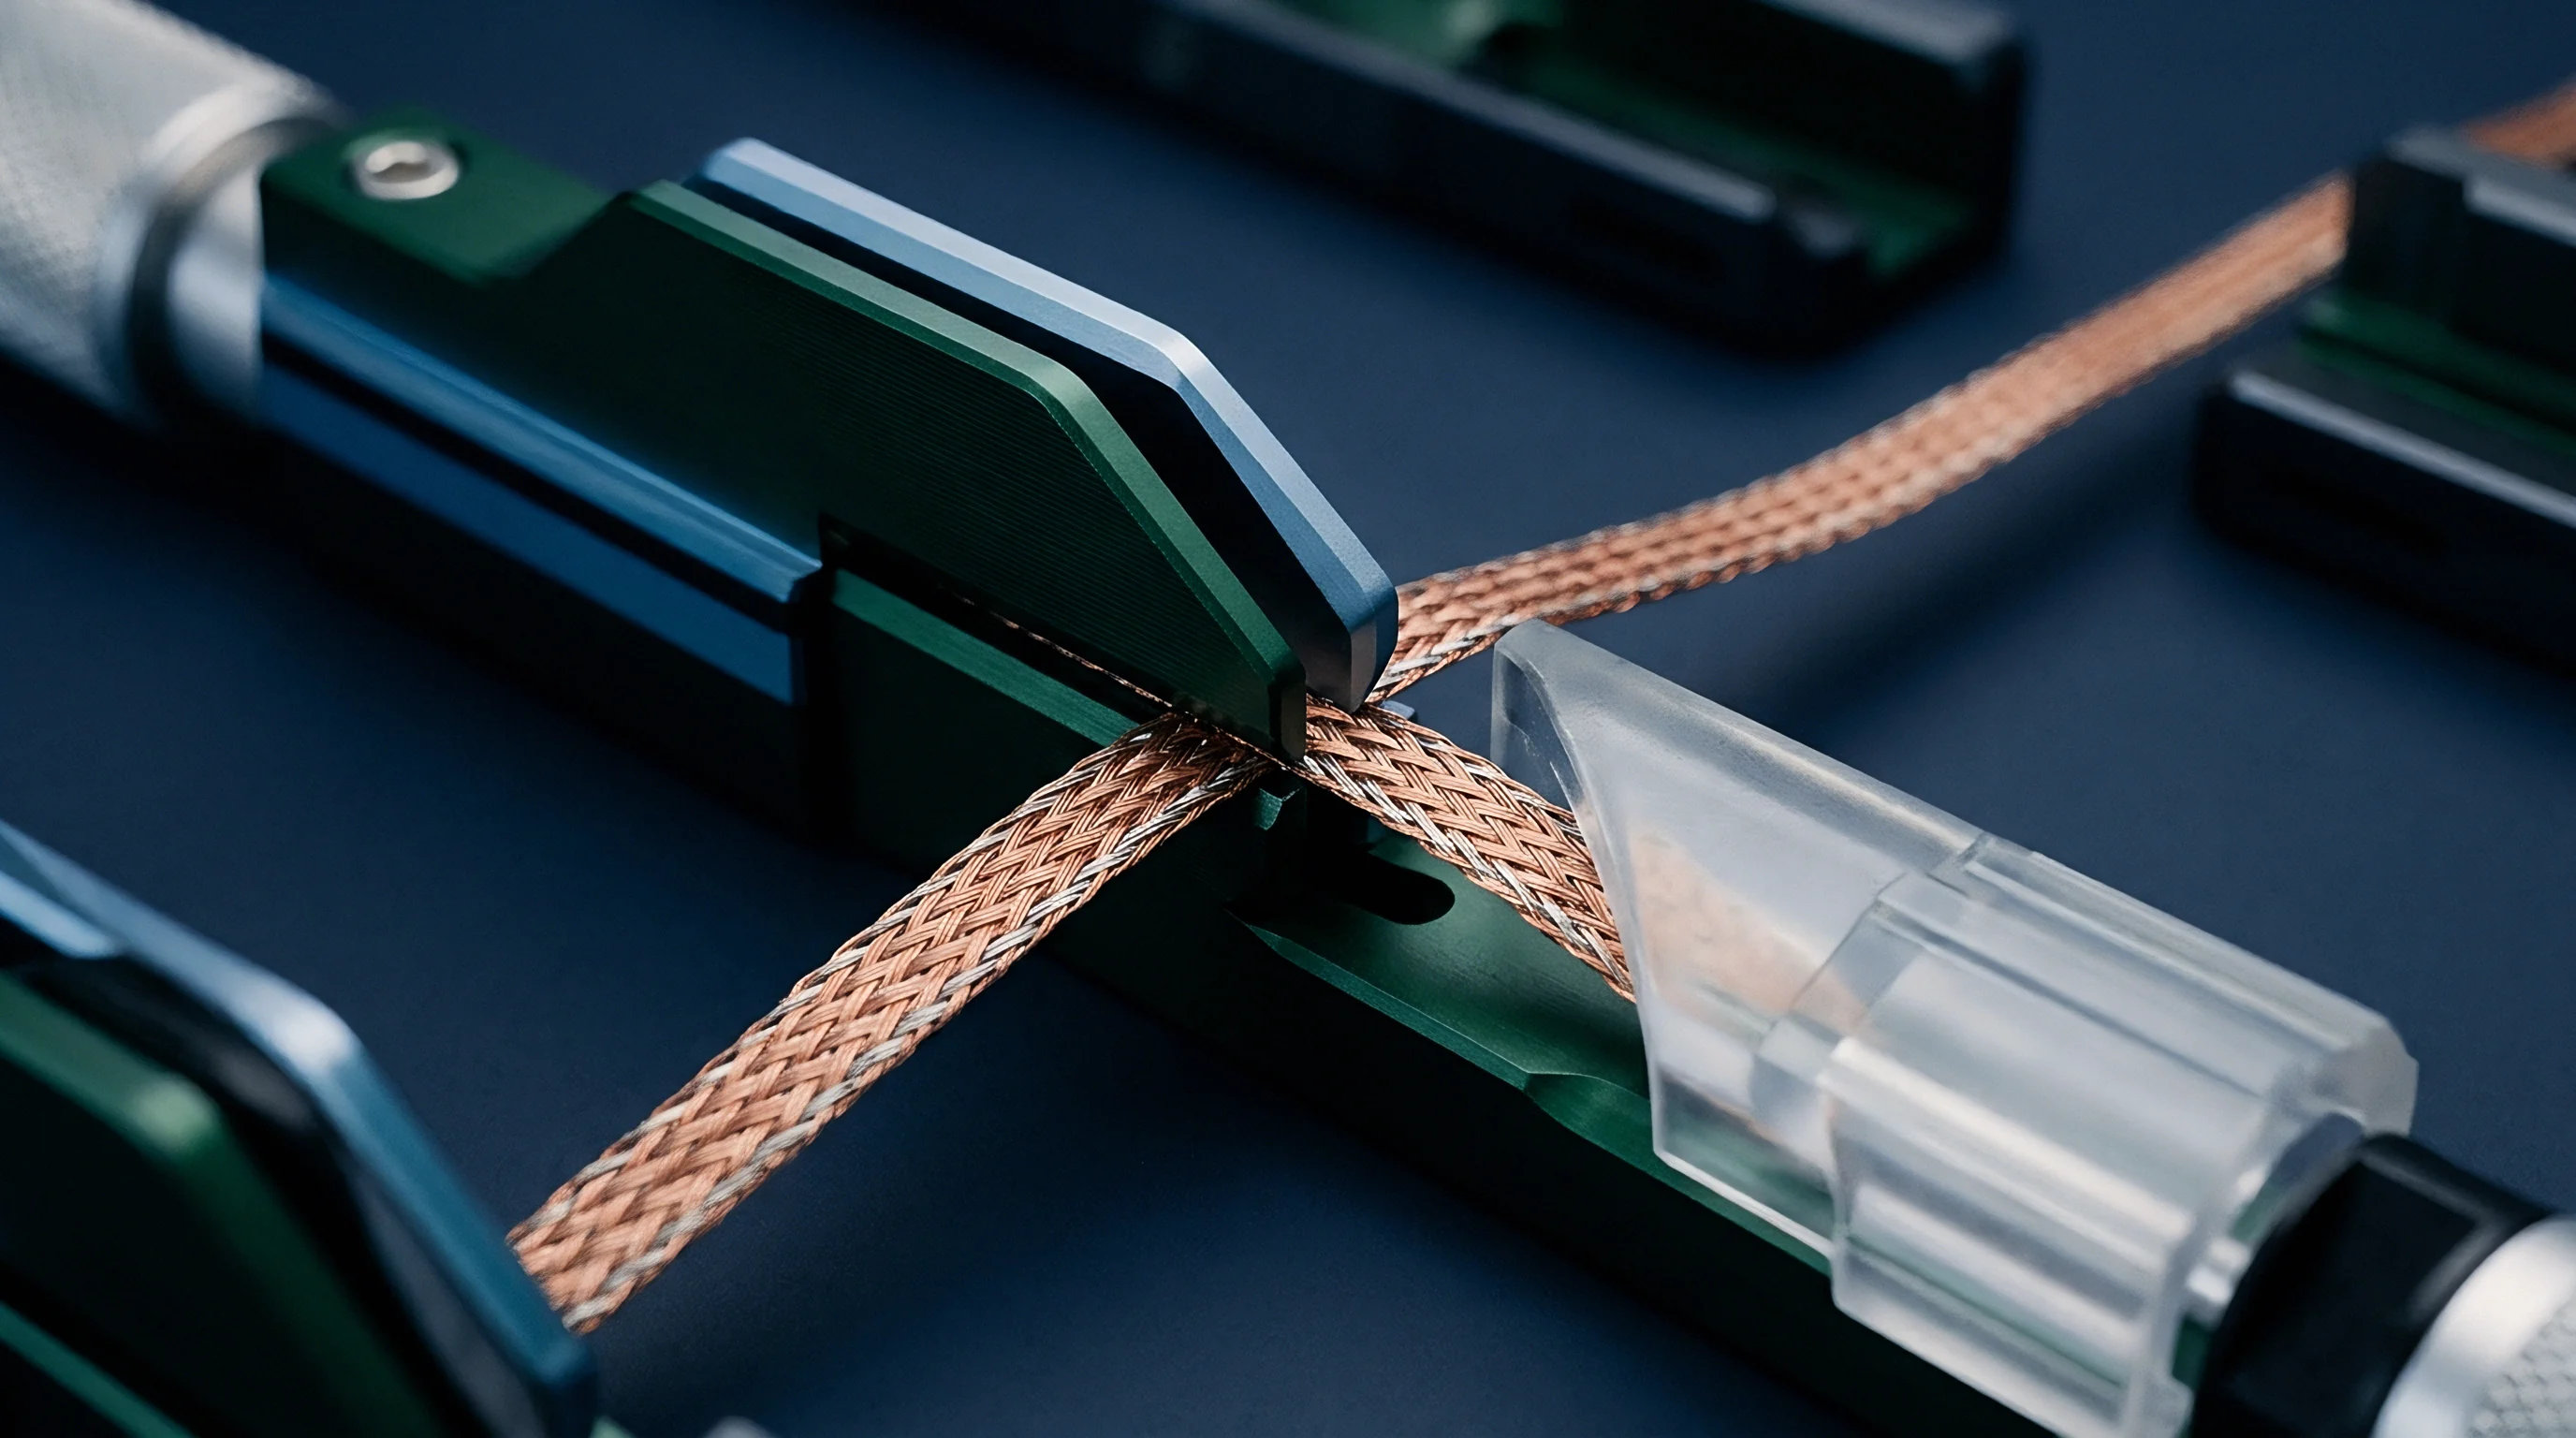
Puck
Moving an absolute optical calibration from a metrology lab onto a high-speed assembly line requires a portable reference standard. When end-of-line verification stations run on cycle times under three seconds, test sensors contend with airborne dust, thermal swings, and constant mechanical wear. The transfer artifact links the primary lab standard directly to the working verification head mounted in the line endstop nest.
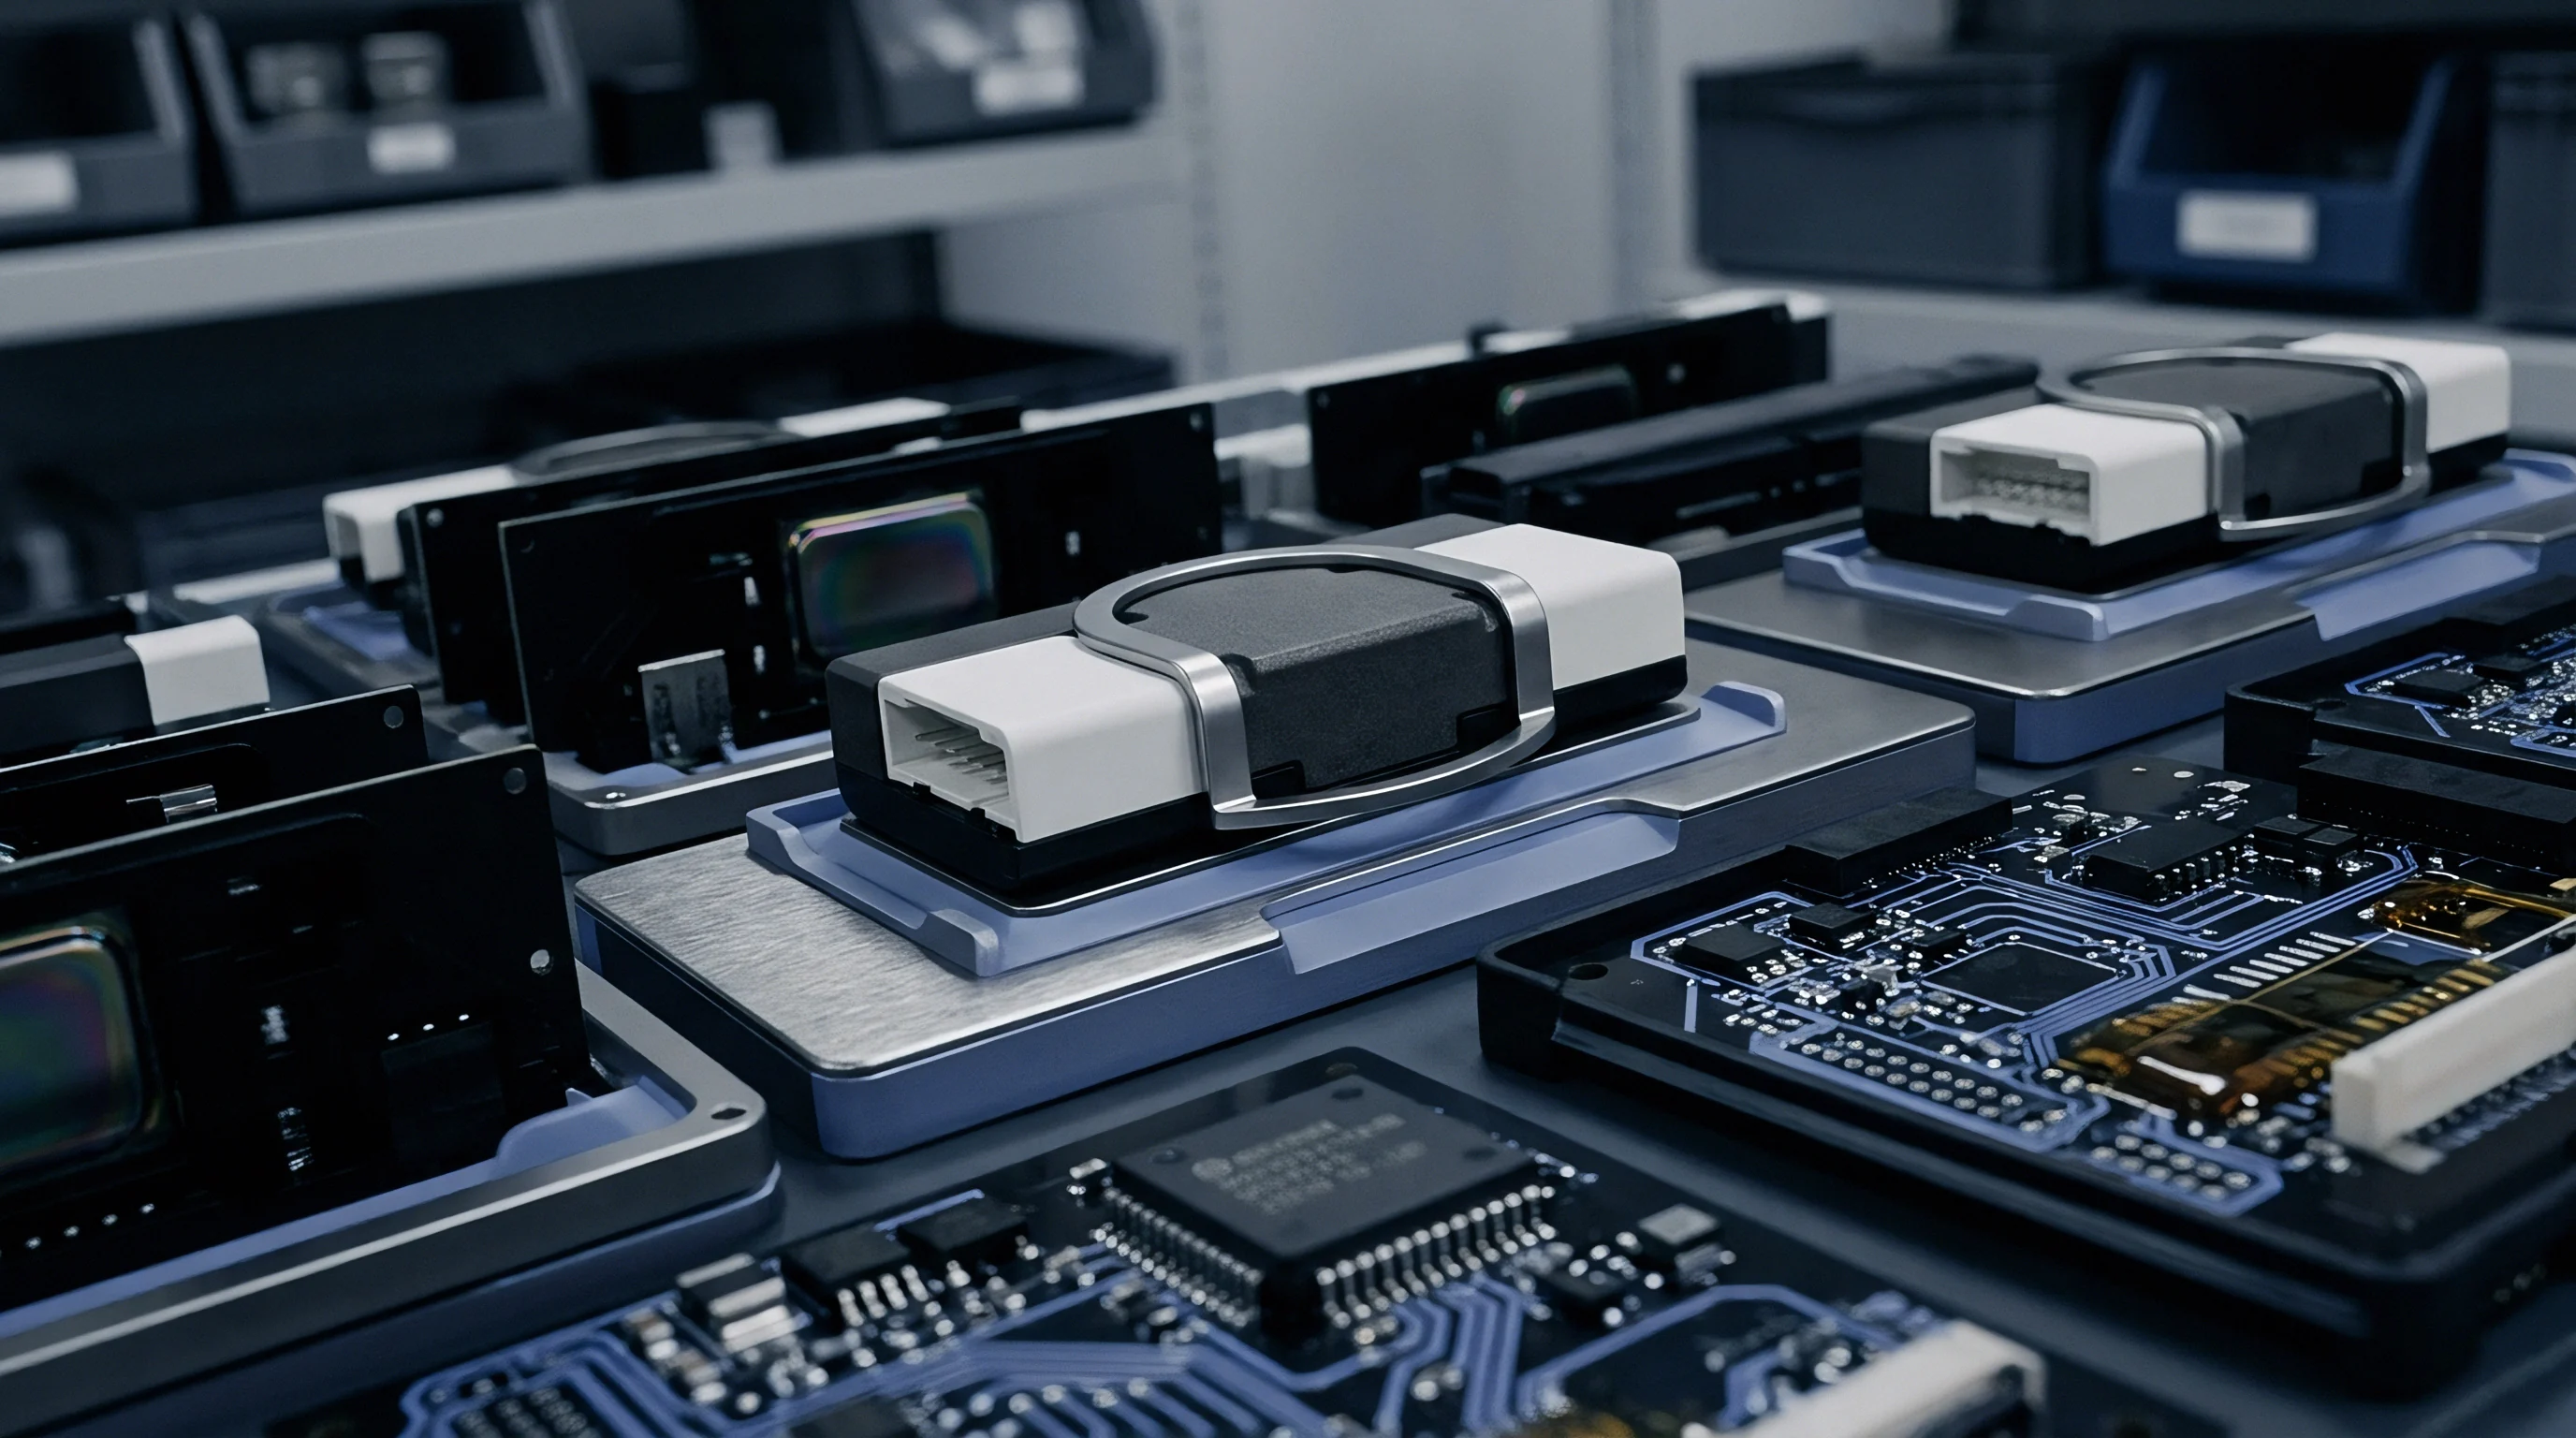
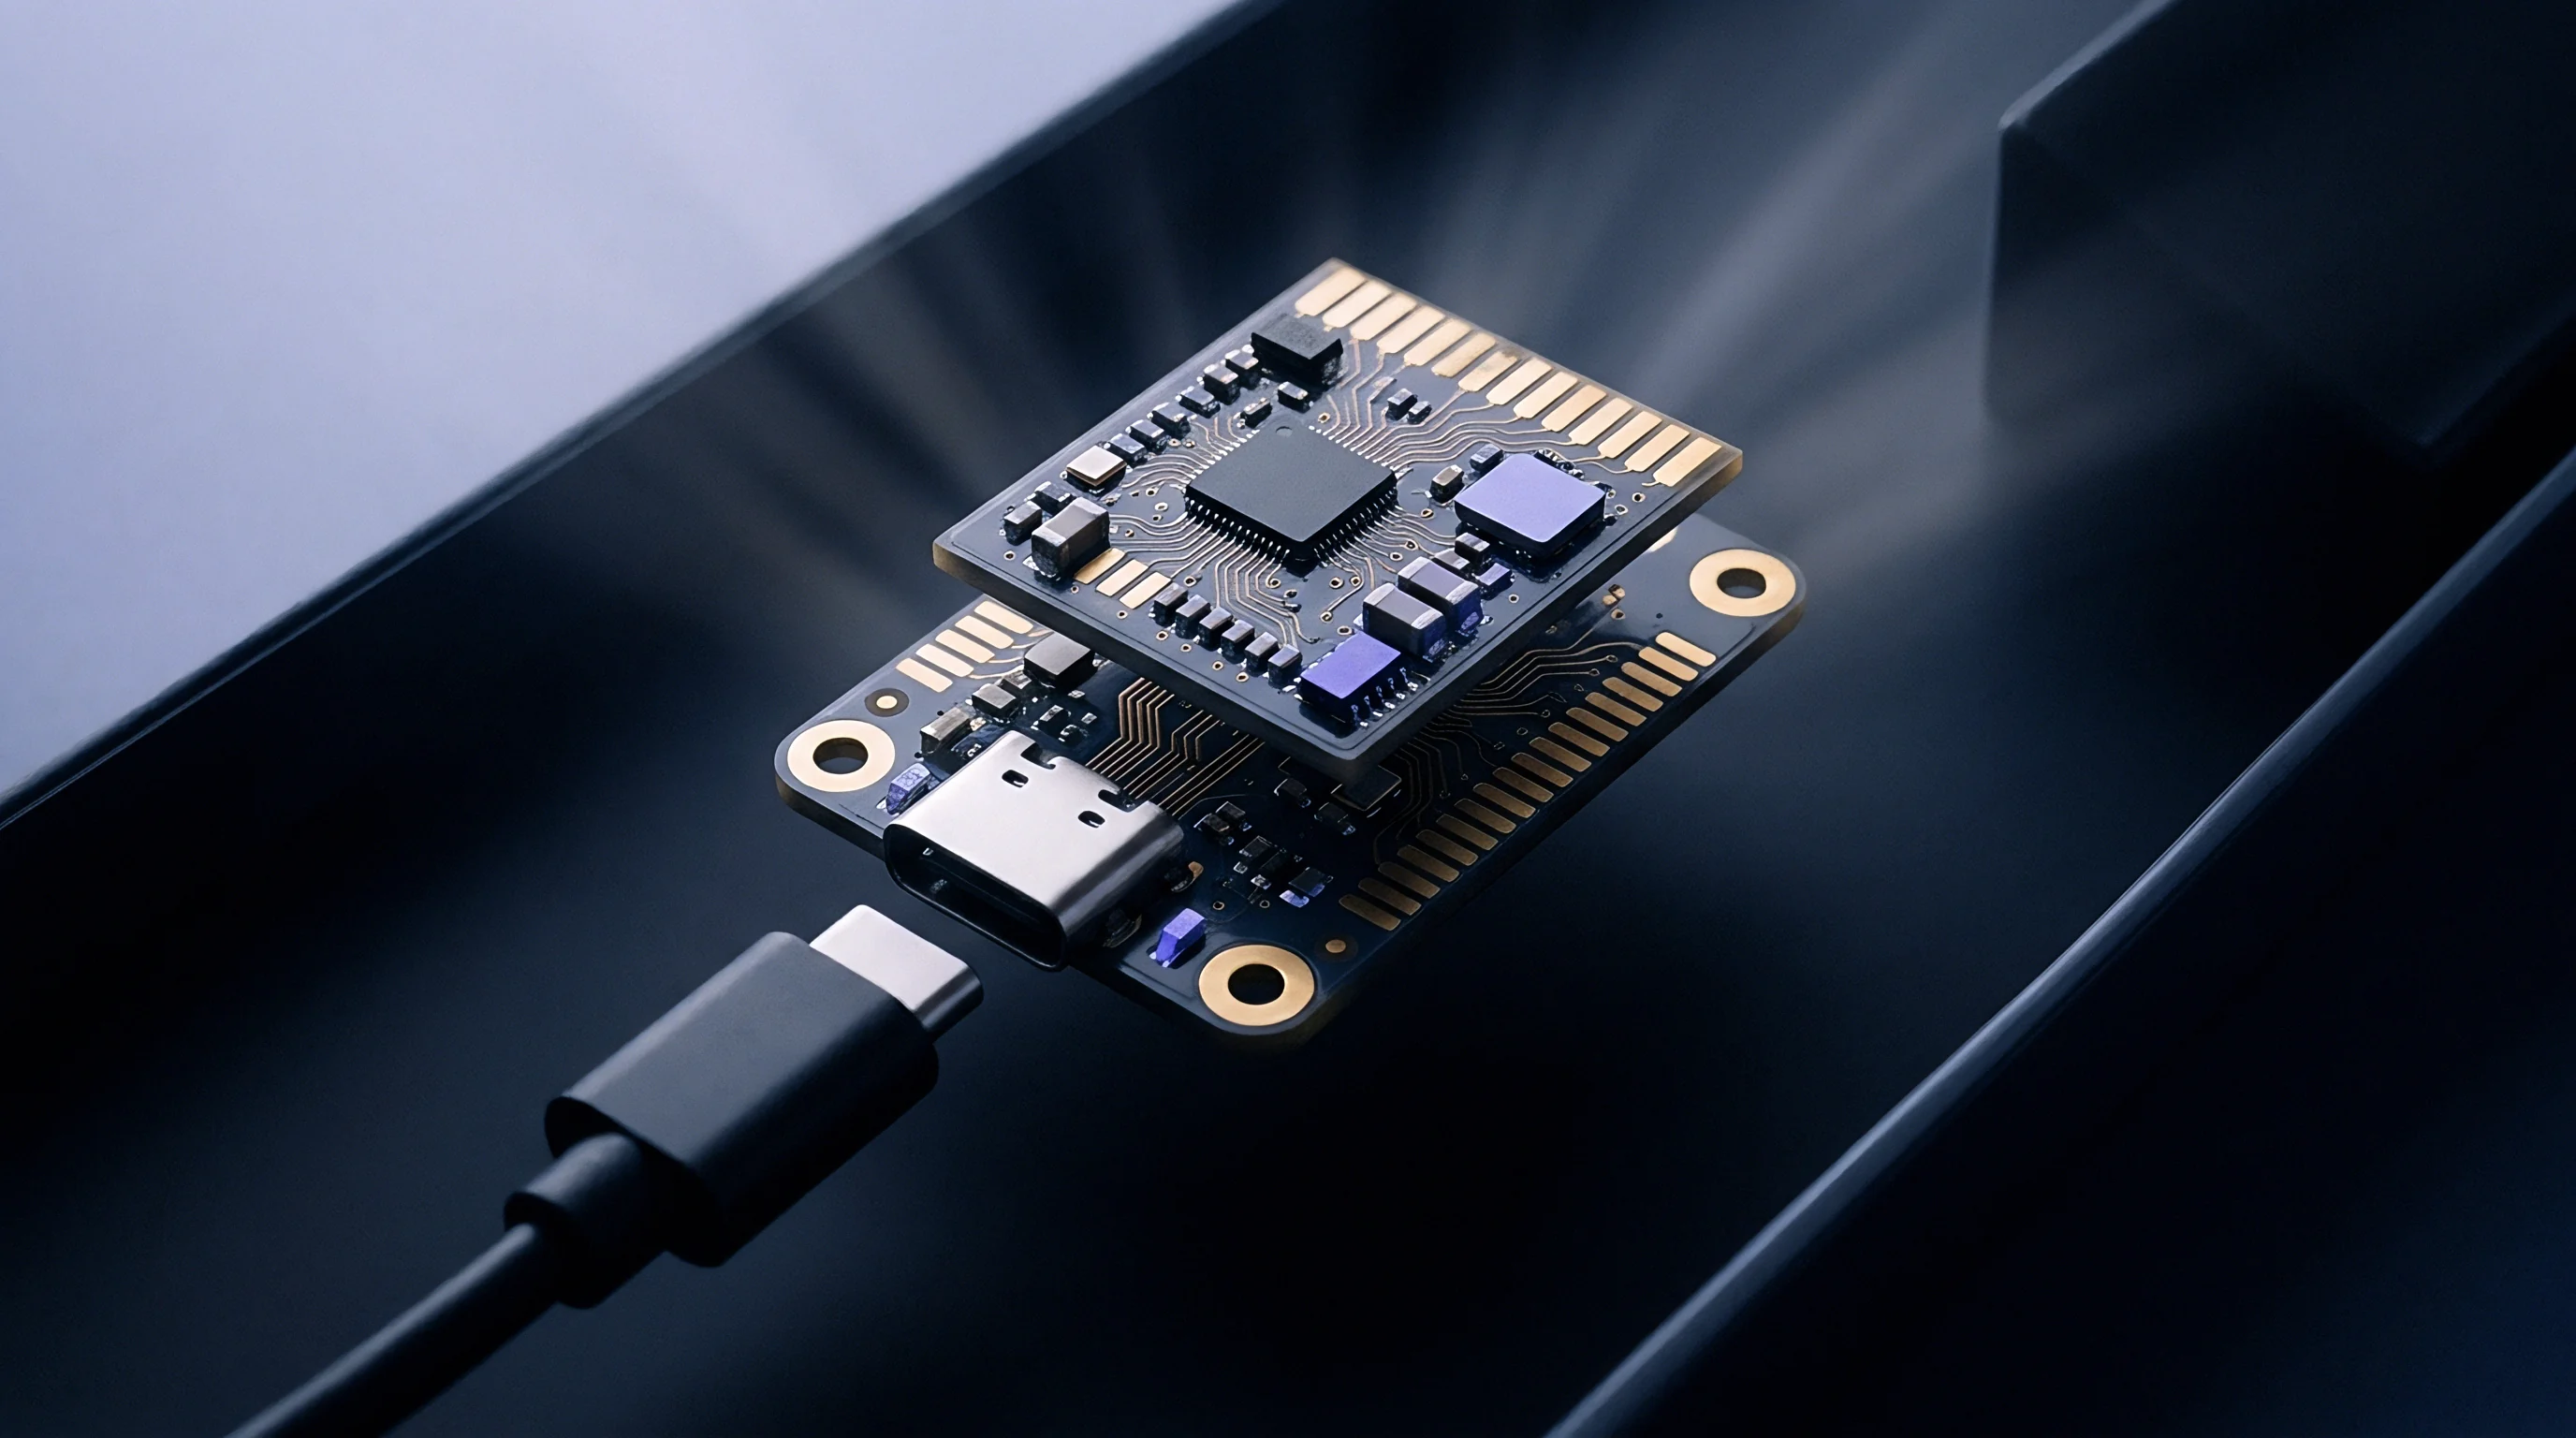
The transfer fixture locks straight into the test head’s mechanical dock. Housed inside is a hermetically sealed silicon photodiode paired with an integrated thermoelectric cooler, an ultra-thin neutral density attenuator, and a precision pinhole aperture. On-board memory holds the full spectral responsivity table, temperature compensation coefficients, calibration date, and serialization.
Once seated in the endstop, spring-loaded pogo pins meet the contact pads so the test rack can pull calibration constants directly from the device, cutting out manual entry on the floor.
A temperature rise of three degrees Celsius at the detector package shifts near-infrared responsivity by 0.6 percent.
Plants running automated optical lines rely on standard transfer assemblies to audit test heads between shifts. Each package relies on dedicated subassemblies built for repeatability and wear resistance:
- Hermetic detector core mounts a quartz-windowed silicon photodiode on a multi-stage Peltier substrate to stabilize active junction temperature at twenty-five degrees Celsius.
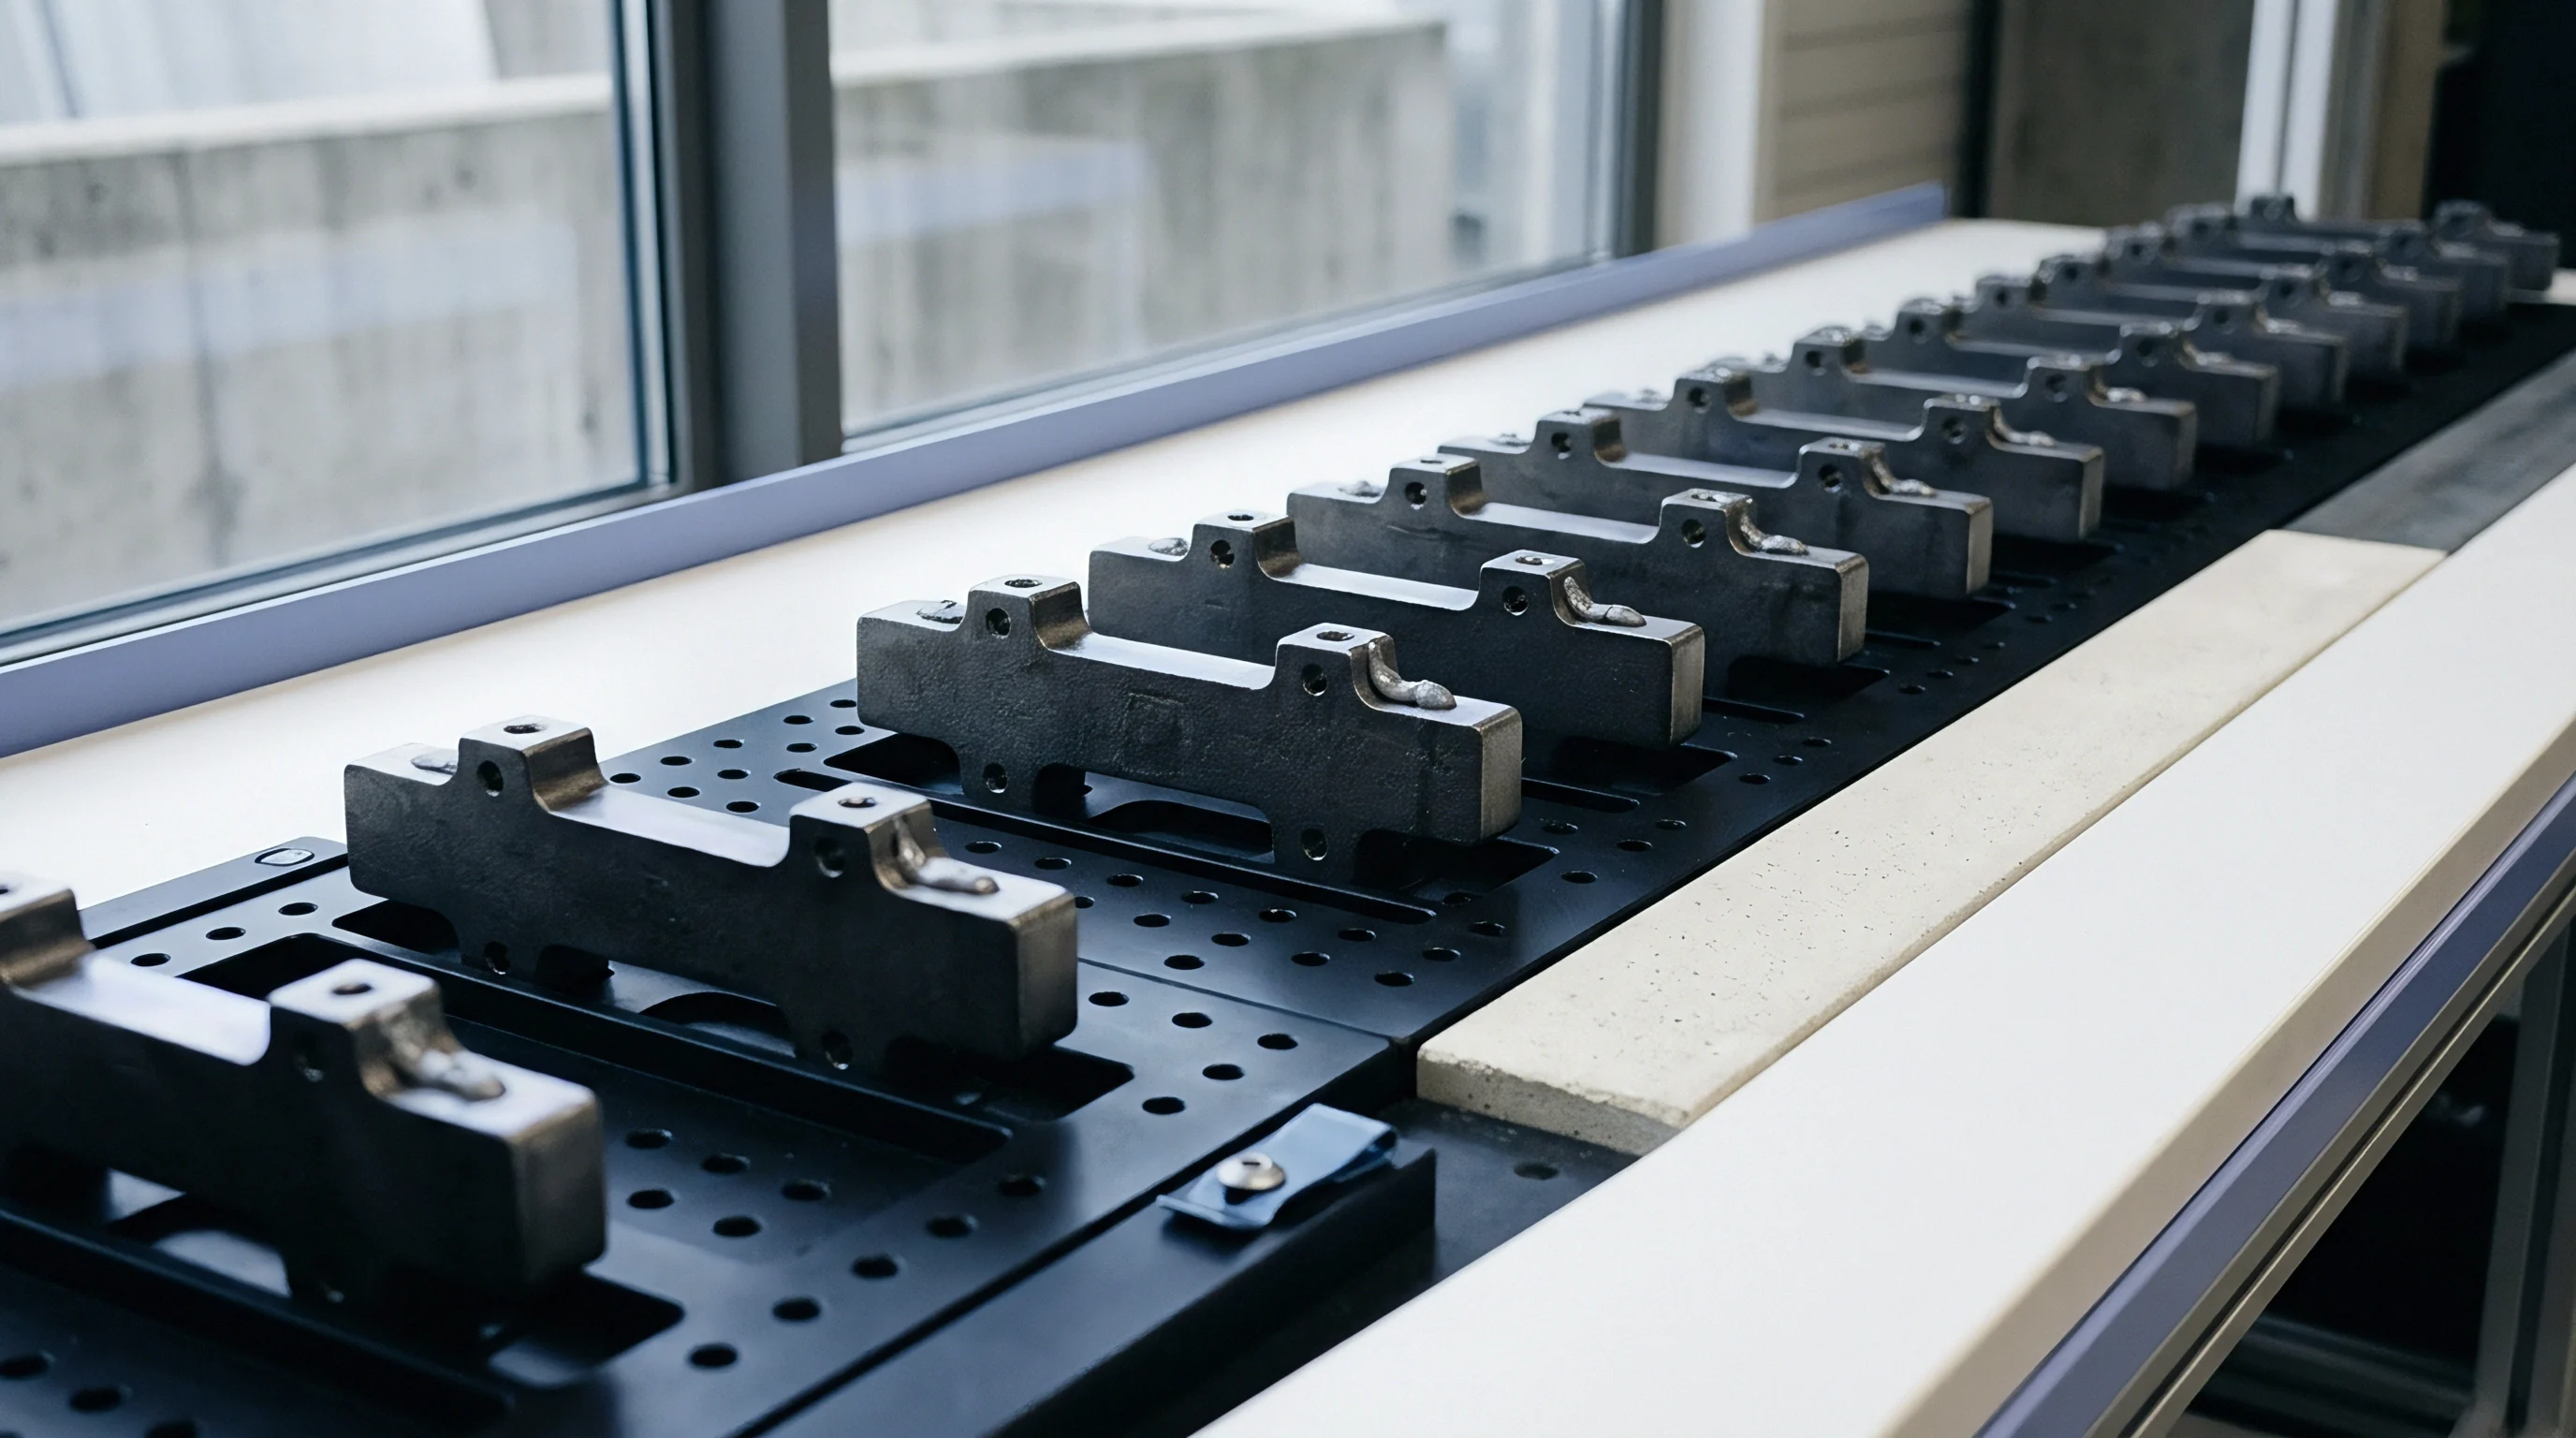
- Precision mechanical collar provides three kinematic locating spheres that mate directly with matching vee-grooves on the line endstop fixture.
- Hardened optical diffuser integrates sintered polytetrafluoroethylene to minimize spatial non-uniformity across varying incident beam profiles.
- Non-volatile calibration memory retains the absolute spectral irradiance responsivity array alongside the calibration laboratory environmental log.
Reference devices go back to accredited metrology institutes for recalibration on fixed calendar intervals. Off the line, transfer fixtures stay stored in nitrogen-purged desiccator boxes; even minor surface contamination on the entrance optic skews transmission and quietly corrupts measurements across thousands of finished units.
Metrological traceability breaks down the moment an unverified transfer tool is introduced to the cell.
Geometry
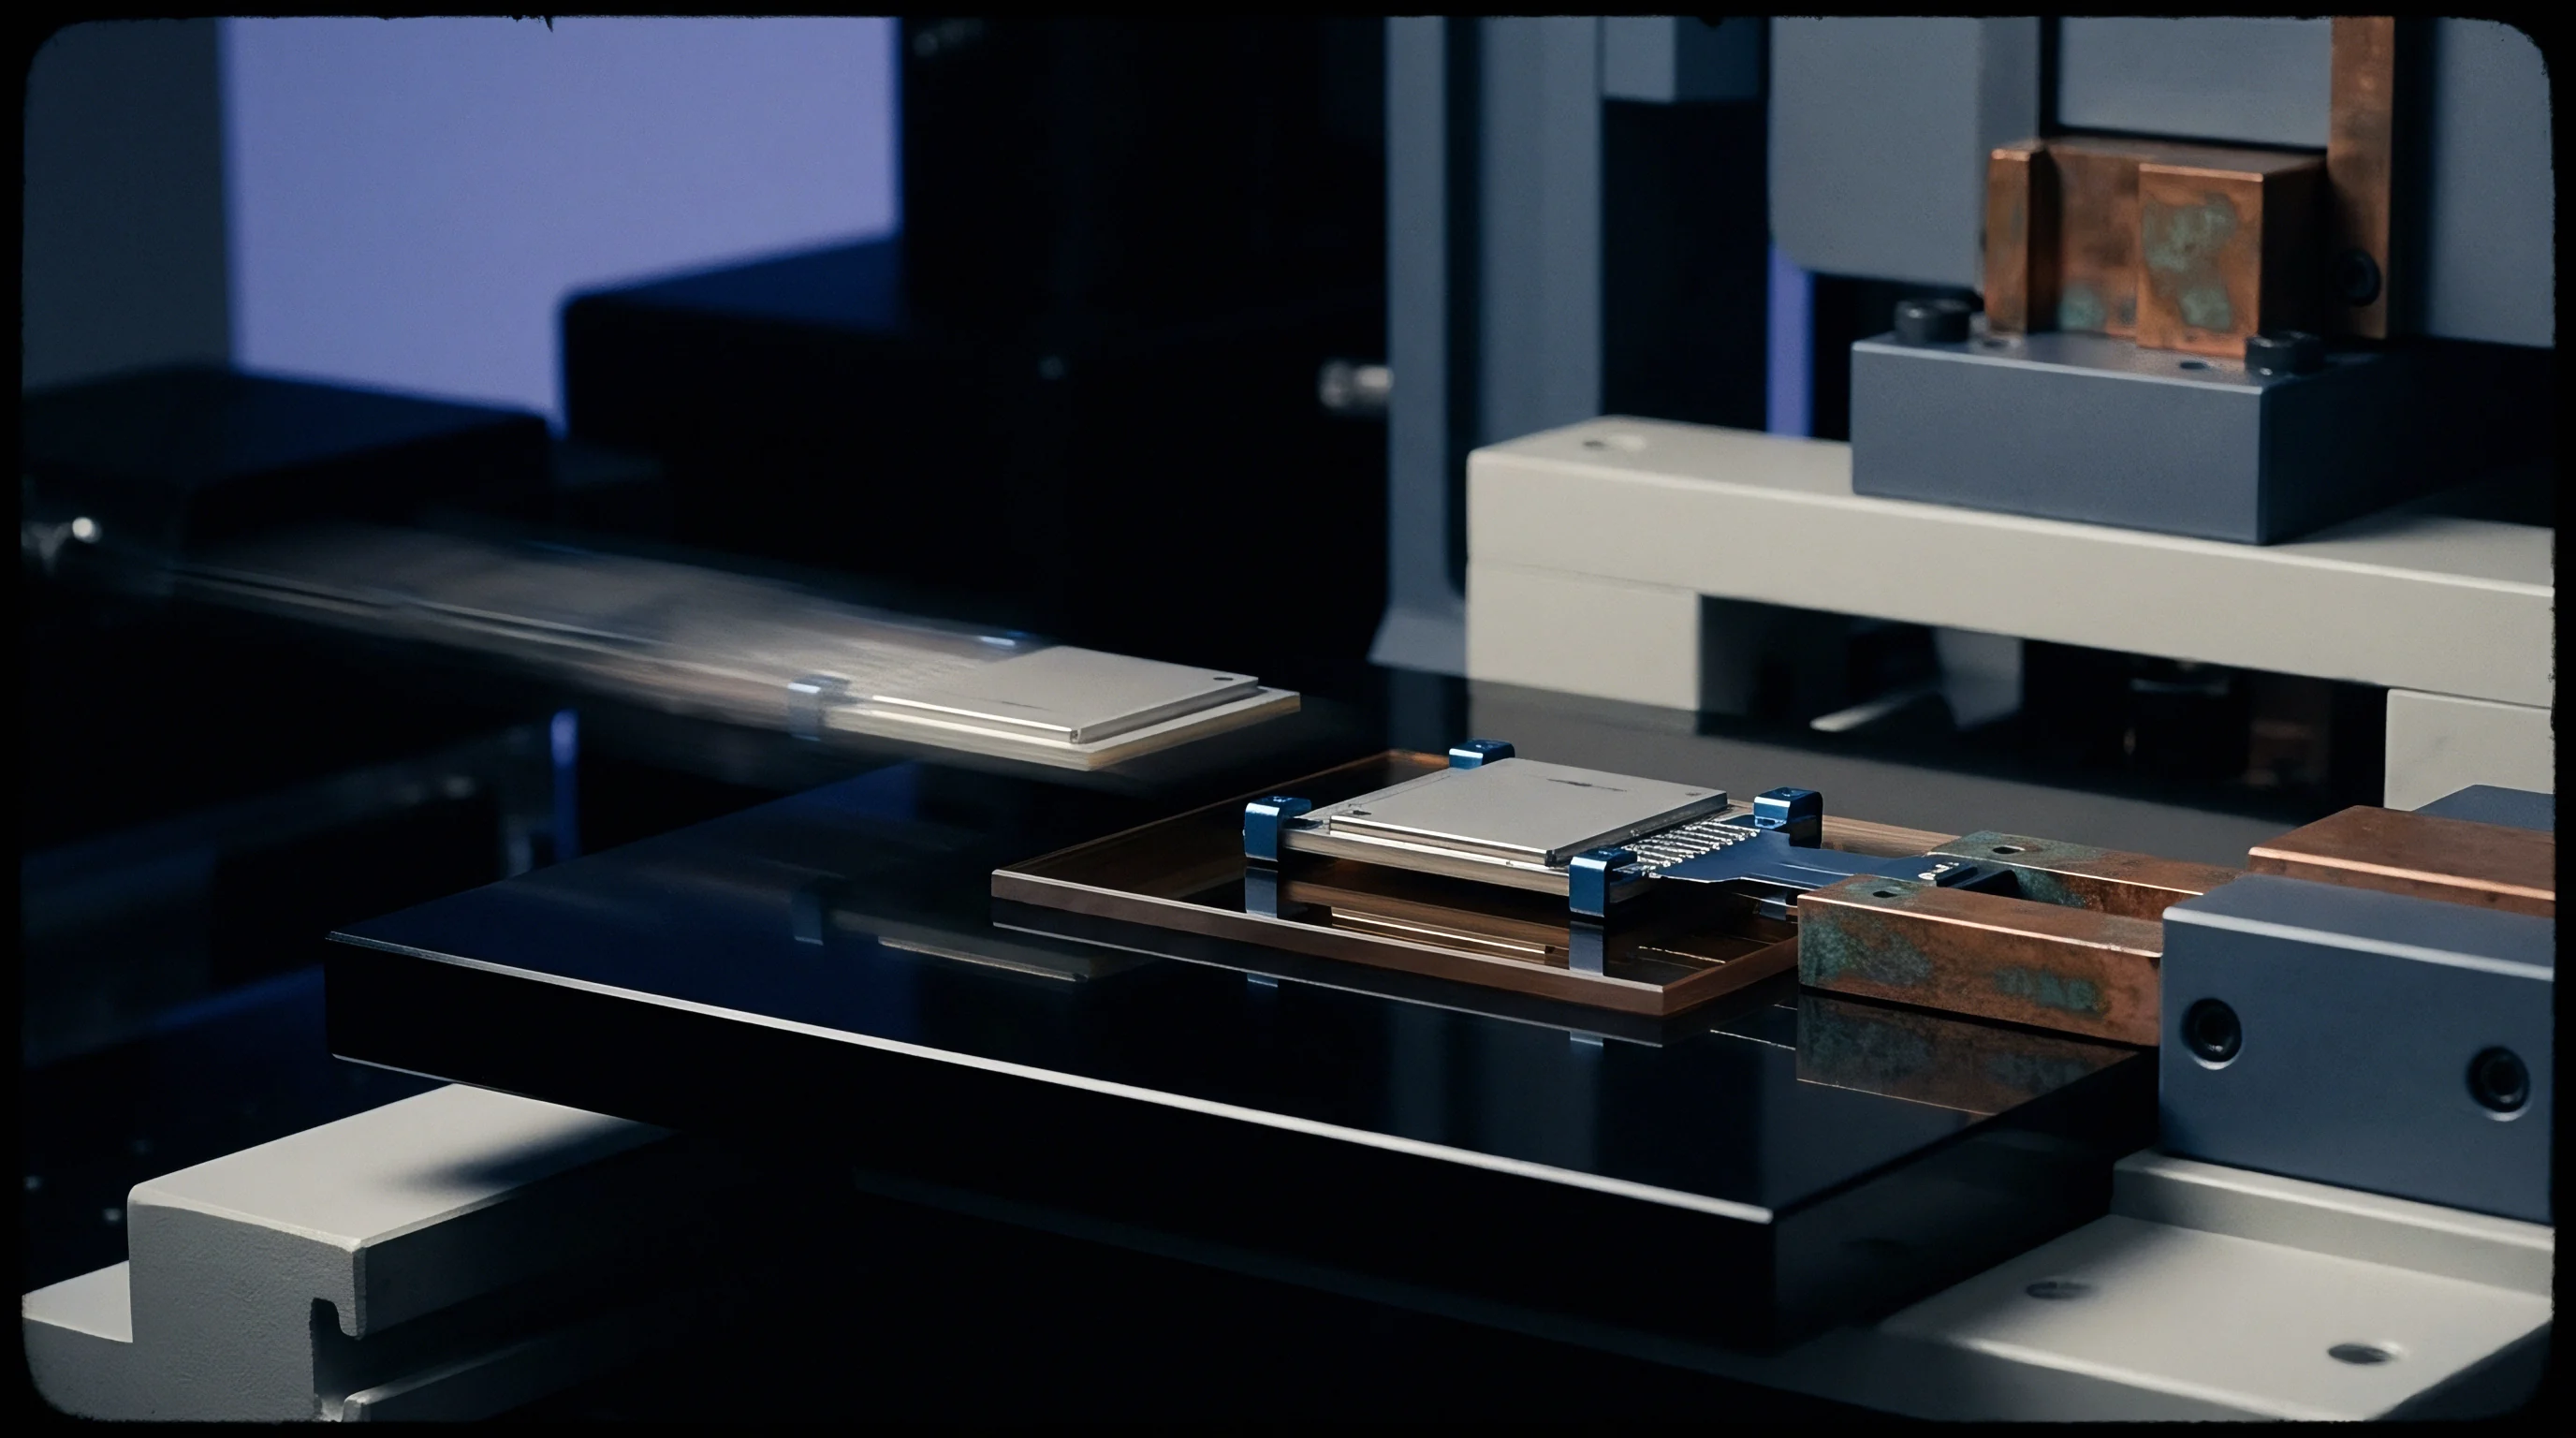
Photometric repeatability in an automated cell comes down to spatial alignment. If a robotic end-effector seats a device under test into an endstop receiver even slightly off-angle, the collected luminous flux shifts. To hold position, precision nests rely on hardened ceramic locating pins and diamond-machined datum faces, while optical receivers use cosine-corrected heads or integrating spheres to soften sensitivity to angular tilt.

Mechanical Registration Tolerances across Test Heads
Kinematic mounts constrain all six degrees of mechanical freedom across three distinct contact points. Yet even tight machining tolerances yield to contact wear and debris accumulation over long production runs. A shift of fifty micrometers normal to the optical axis noticeably alters illuminance profiles across bare photodiode active areas.
Integrating spheres help by diffusing incoming light before it reaches the sensor, but at the cost of severe throughput loss. Cell design ultimately hinges on trading optical signal-to-noise ratio against mechanical tolerance margins.
| Receiver Optical Configuration | Angular Tilt Margin | Linear Offset Margin | Optical Power Attenuation | Measurement Variance |
|---|---|---|---|---|
| Bare Silicon Photodiode | 0.25 deg | 25 um | 0.0 dB | 3.8 percent |
| Ground Glass Diffuser Cap | 1.50 deg | 100 um | 12.4 dB | 1.2 percent |
| Sintered PTFE Cosine Head | 3.00 deg | 250 um | 18.1 dB | 0.4 percent |
| Miniature Integrating Sphere | 5.00 deg | 500 um | 24.6 dB | 0.1 percent |
Internal reflections inside the chamber easily corrupt photometric readings. Raw or anodized aluminum fixtures throw considerable stray light under bright factory bay lighting. Using black polyoxymethylene nests alongside optical black coatings absorbs scatter and keeps the local test environment controlled.
Precision mechanical registration prevents optical misalignment from corrupting absolute photometric readings.
Wear on locating surfaces creates systematic optical drift from one shift to the next, eroding repeatable alignment between the transfer standard and the test receiver:
- Abrasive particulate collection packs metal swarf into locator bushings, shifting the transfer standard optical center by tens of micrometers.
- Guide pin galling scores mechanical mating surfaces through dry metal-to-metal contact during repetitive automated dockings.
- Thermal nest expansion displaces receiver datums relative to robotic grippers when ambient line temperatures rise during peak afternoon operations.
- Pneumatic clamping fatigue bleeds off clamping pressure across long duty cycles, leaving parts vulnerable to vibration during high-speed readout.
Software offsets can compensate for numerical variance in the data stream, but they do not resolve underlying mechanical misalignments without physical hardware adjustment.

Flux
Differences in spectral emission between calibration sources and production devices introduce substantial uncertainty. Calibration laboratories reference transfer artifacts against standard illuminants, typically incandescent tungsten lamps operating at 2856 Kelvin. Production lines, by contrast, measure narrow-band solid-state emitters, phosphor-converted white light-emitting diodes, or vertical-cavity surface-emitting lasers.
Correcting for the difference between calibration conditions and device output requires a calculated spectral mismatch factor.

Do Spectral Mismatches Compound across Transfer Levels?
Deriving the mismatch correction factor demands accurate relative spectral responsivity curves alongside emission spectra for both source and device. If an endstop sensor measures an emitter with a spectral profile different from the transfer source, uncorrected errors exceed ten percent. The calculation must account for four distinct distributions: the calibration lamp emission, the device under test profile, the responsivity of the transfer standard, and the responsivity of the line photometer.
Spectroradiometers bypass this mismatch math by reading absolute spectral distributions directly. But high-throughput lines avoid them due to long integration times and fragile mechanical shutters. Filtered photodiode arrays capture readings in milliseconds instead, shifting the burden of mismatch compensation directly onto the cell controller’s mathematical routines.
| Uncertainty Contributor | Probability Distribution | Standard Uncertainty | Degrees of Freedom |
|---|---|---|---|
| NMI Primary Lamp Traceability | Normal | 0.45 percent | 50 |
| Transfer Artifact Responsivity Drift | Rectangular | 0.30 percent | Infinite |
| Spectral Mismatch Correction Factor | Rectangular | 0.65 percent | Infinite |
| Temperature Coefficient Residual | Normal | 0.20 percent | 30 |
| Spatial Non-Uniformity on Line Nest | Rectangular | 0.40 percent | Infinite |
| Electronic Readout Nonlinearity | Normal | 0.15 percent | 20 |
| Expanded uncertainty equates to 1.84 percent at a 95 percent confidence interval with coverage factor k equal to 2.0. | |||
Sustained exposure to short-wavelength radiation gradually degrades optical filters. In dielectric bandpass coatings, compromised edge seals allow moisture ingress, producing humidity-induced spectral shifts in standard factory air.
A verified spectral responsivity curve anchors every valid optical transfer calculation.
Silicon photodiodes saturate nonlinearly under high radiant flux. The test head amplifier relies on calibrated transimpedance gain stages to hold a linear voltage output across four decades of optical power. If saturation occurs near the top of a detector’s range, it skews photometric values without triggering an explicit fault or alarm.
Whether broadband LED secondary transfer standards can replace traditional tungsten ribbon lamps without increasing expanded line-side uncertainty remains an unsettled question in industrial metrology.


Cadence
Sensor responsivity degrades predictably over operational exposure hours. Outgassing from cell components forms thin chemical deposits on silicon surfaces, while high-energy photon flux alters internal junction characteristics over time. Managing this drift requires a rigorous rotation schedule that cascades verification down from primary transfer tools to working line sensors, verifying test heads without halting line progress.
Is in Situ Photometric Recalibration Feasible under Production Heat?
Thermal management largely dictates photometric repeatability on high-throughput equipment. Endstop assemblies pack stepper motors, pneumatic valves, and power supplies into a shared chassis, pumping heat directly into the fixture. Operating photodiode arrays sit in microclimates that swing between twenty and forty-five degrees Celsius, where silicon responsivity near the band edge shifts by several tenths of a percent per degree Celsius.
In situ calibration routines execute internal baseline corrections using thermoelectric feedback before running production batches.
| Sensor Architecture | Drift Rate per 1000 Hours | Thermal Sensitivity | Verification Interval | Replacement Cycle |
|---|---|---|---|---|
| Uncooled Silicon Photodiode | 0.80 percent | 0.20 percent per deg C | 7 days | 12 months |
| Thermoelectric-Cooled Si Pin Diode | 0.15 percent | 0.02 percent per deg C | 30 days | 24 months |
| Filtered Tristimulus Sensor Array | 1.20 percent | 0.35 percent per deg C | 3 days | 6 months |
| Array Spectroradiometer Head | 0.50 percent | 0.08 percent per deg C | 14 days | 18 months |
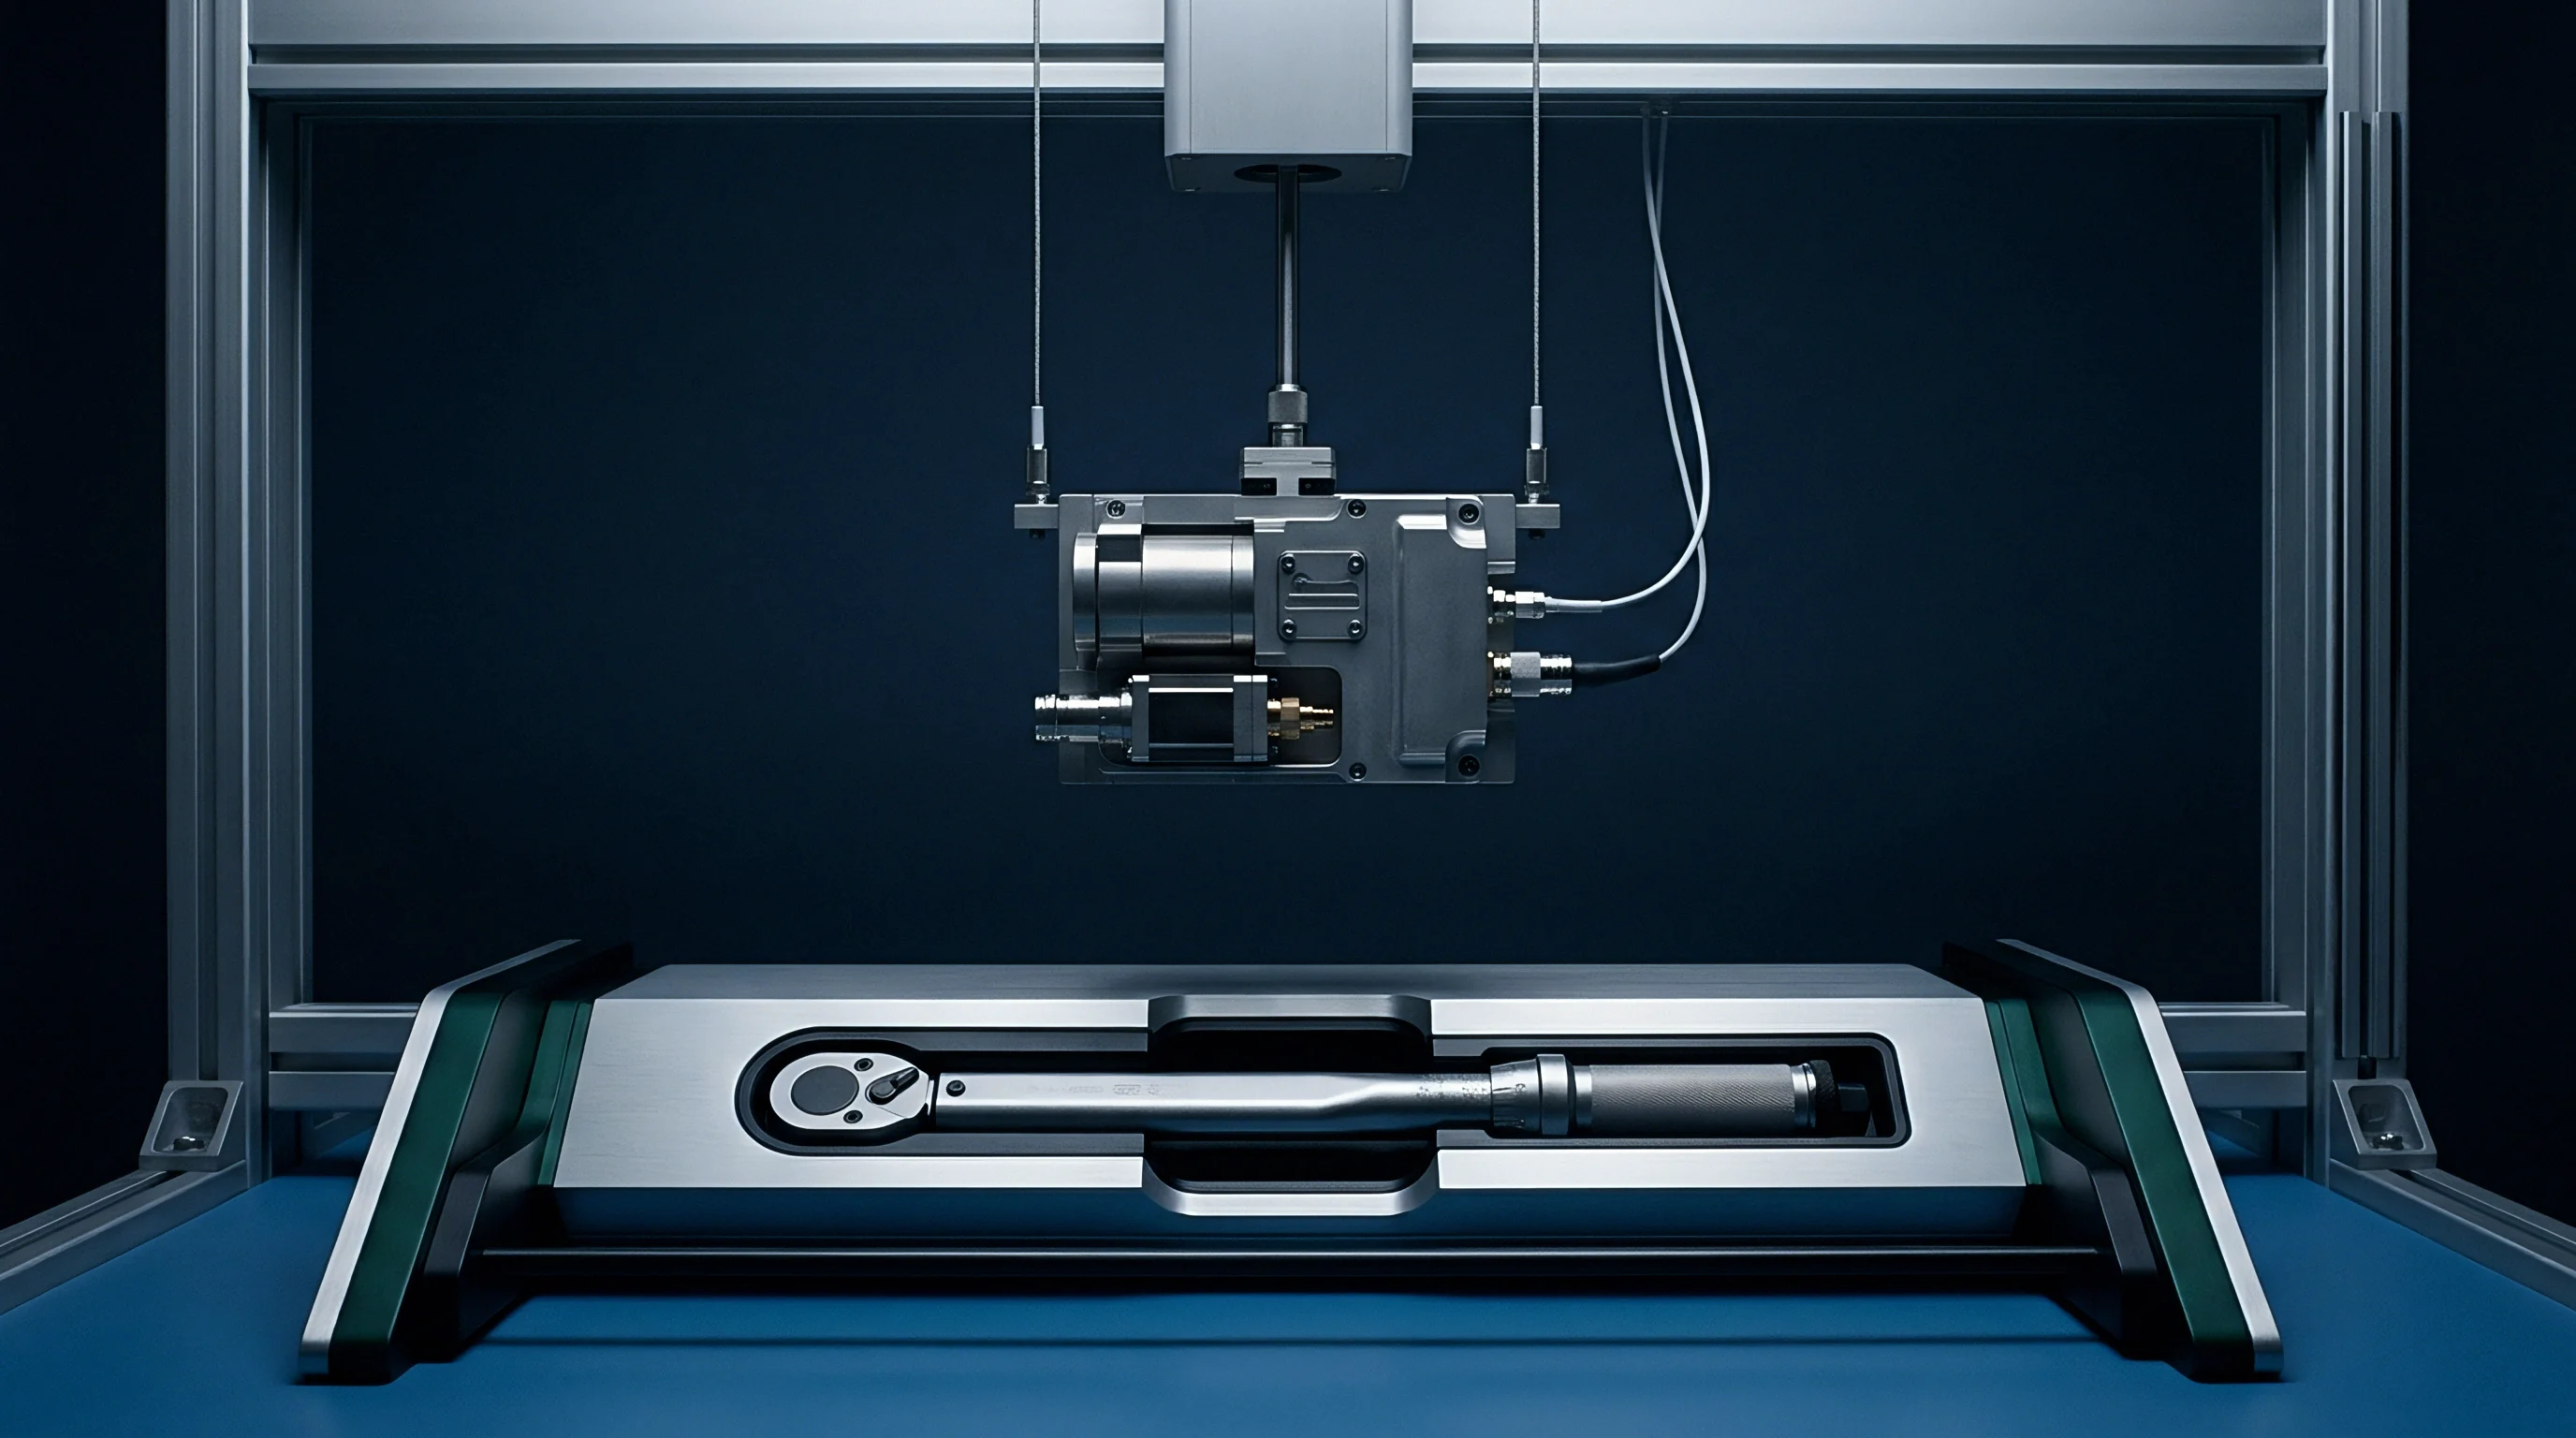
Transferring calibration across multiple line fixtures follows a strict routine to guard against mechanical shock and optical contamination:
- Allow the transfer artifact thirty minutes in the production cell to reach thermal equilibrium before docking.
- Connect the diagnostic interface to verify on-board EEPROM checksums, operating temperature, and internal transimpedance amplifier reference voltages.
- Seat the transfer puck into the line endstop fixture, engaging mechanical kinematic datums and electronic contact pins.
- Run an automated illumination sequence across five discrete power points, logging raw detector currents alongside fixture temperature.
- Calculate the test head deviation against stored artifact calibration constants and update local lookup tables if deviation remains within tolerance limits.
If measured deviation exceeds three percent, the verification sequence aborts and the cell controller stops the line immediately. Bypassing that interlock risks false-rejection spikes or passing out-of-spec optical assemblies into finished shipments.
Custody
Measurement traceability depends on an unbroken chain of comparisons reaching back to international standards. When optical testing runs at an overseas contract manufacturing site, contractual definitions govern calibration records, artifact ownership, and measurement validation. Turnkey contracts frequently obscure calibration details, leaving the brand owner vulnerable to measurement drift and unverified line modifications.
Semi-custom arrangements establish clear boundaries for equipment ownership, software source files, and calibration audit procedures.
Responsibility Allocation across Manufacturing Arrangements
Contractual scope outlines which party provides primary transfer standards, maintains accredited laboratory certifications, and writes verification scripts. Ambiguity in these responsibilities leads to contested warranty claims when field failures point toward out-of-spec optical emission. The statement of work must designate specific file formats for calibration logs, mandate minimum recalibration frequencies, and grant audit rights to the equipment purchaser.
| Integration Level | Transfer Standard Ownership | Calibration Script Control | Traceability Dossier Custody | Downtime Responsibility |
|---|---|---|---|---|
| Turnkey Contract Assembly | EMS Factory Floor | Proprietary EMS Engine | EMS Internal Archive | Contract Manufacturer |
| Semi-Custom Engineered Cell | Joint Sourcing Pool | Shared Source Repository | Co-Signed Cloud Ledger | Negotiated Split |
| Reference Design Transfer | OEM Brand Owner | OEM Source Delivery | OEM Central Quality Team | OEM Brand Owner |
| White-Label Build-to-Print | Tier-1 Equipment Vendor | Precompiled Vendor Binary | Factory Floor Certificate | Equipment Vendor |
Auditing optical test heads requires direct access to raw ADC counts and unprocessed voltage readings. Proprietary firmware frequently conceals drift by applying dynamic gain smoothing without logging adjustments. Transparent calibration regimes export raw sensor data alongside corrected values to maintain an unbroken audit trail.
A contract clause that fails to define raw calibration data formats leaves test station drift unverifiable.
Disputes over optical yield losses emerge when two independent test lines disagree on identical product batches. When gold units age without recalibration, factories adjust pass/fail bands informally to maintain line throughput. This informal tolerance widening shifts manufacturing variance directly into the customer supply chain.
Clause 7.6 of ISO 9001 dictates that measuring equipment must be calibrated against traceable measurement standards at specified intervals, and when no such standards exist, the basis used for calibration must be recorded as documented information.