Phase Resolution Limits in Multi Band Array Hotspot Overlap Measurement during Simultaneous SAR Qualification
Phase resolution limits in fast vector probe arrays dictate spatial overlap accuracy during simultaneous SAR testing, bounding power backoff and link budget.

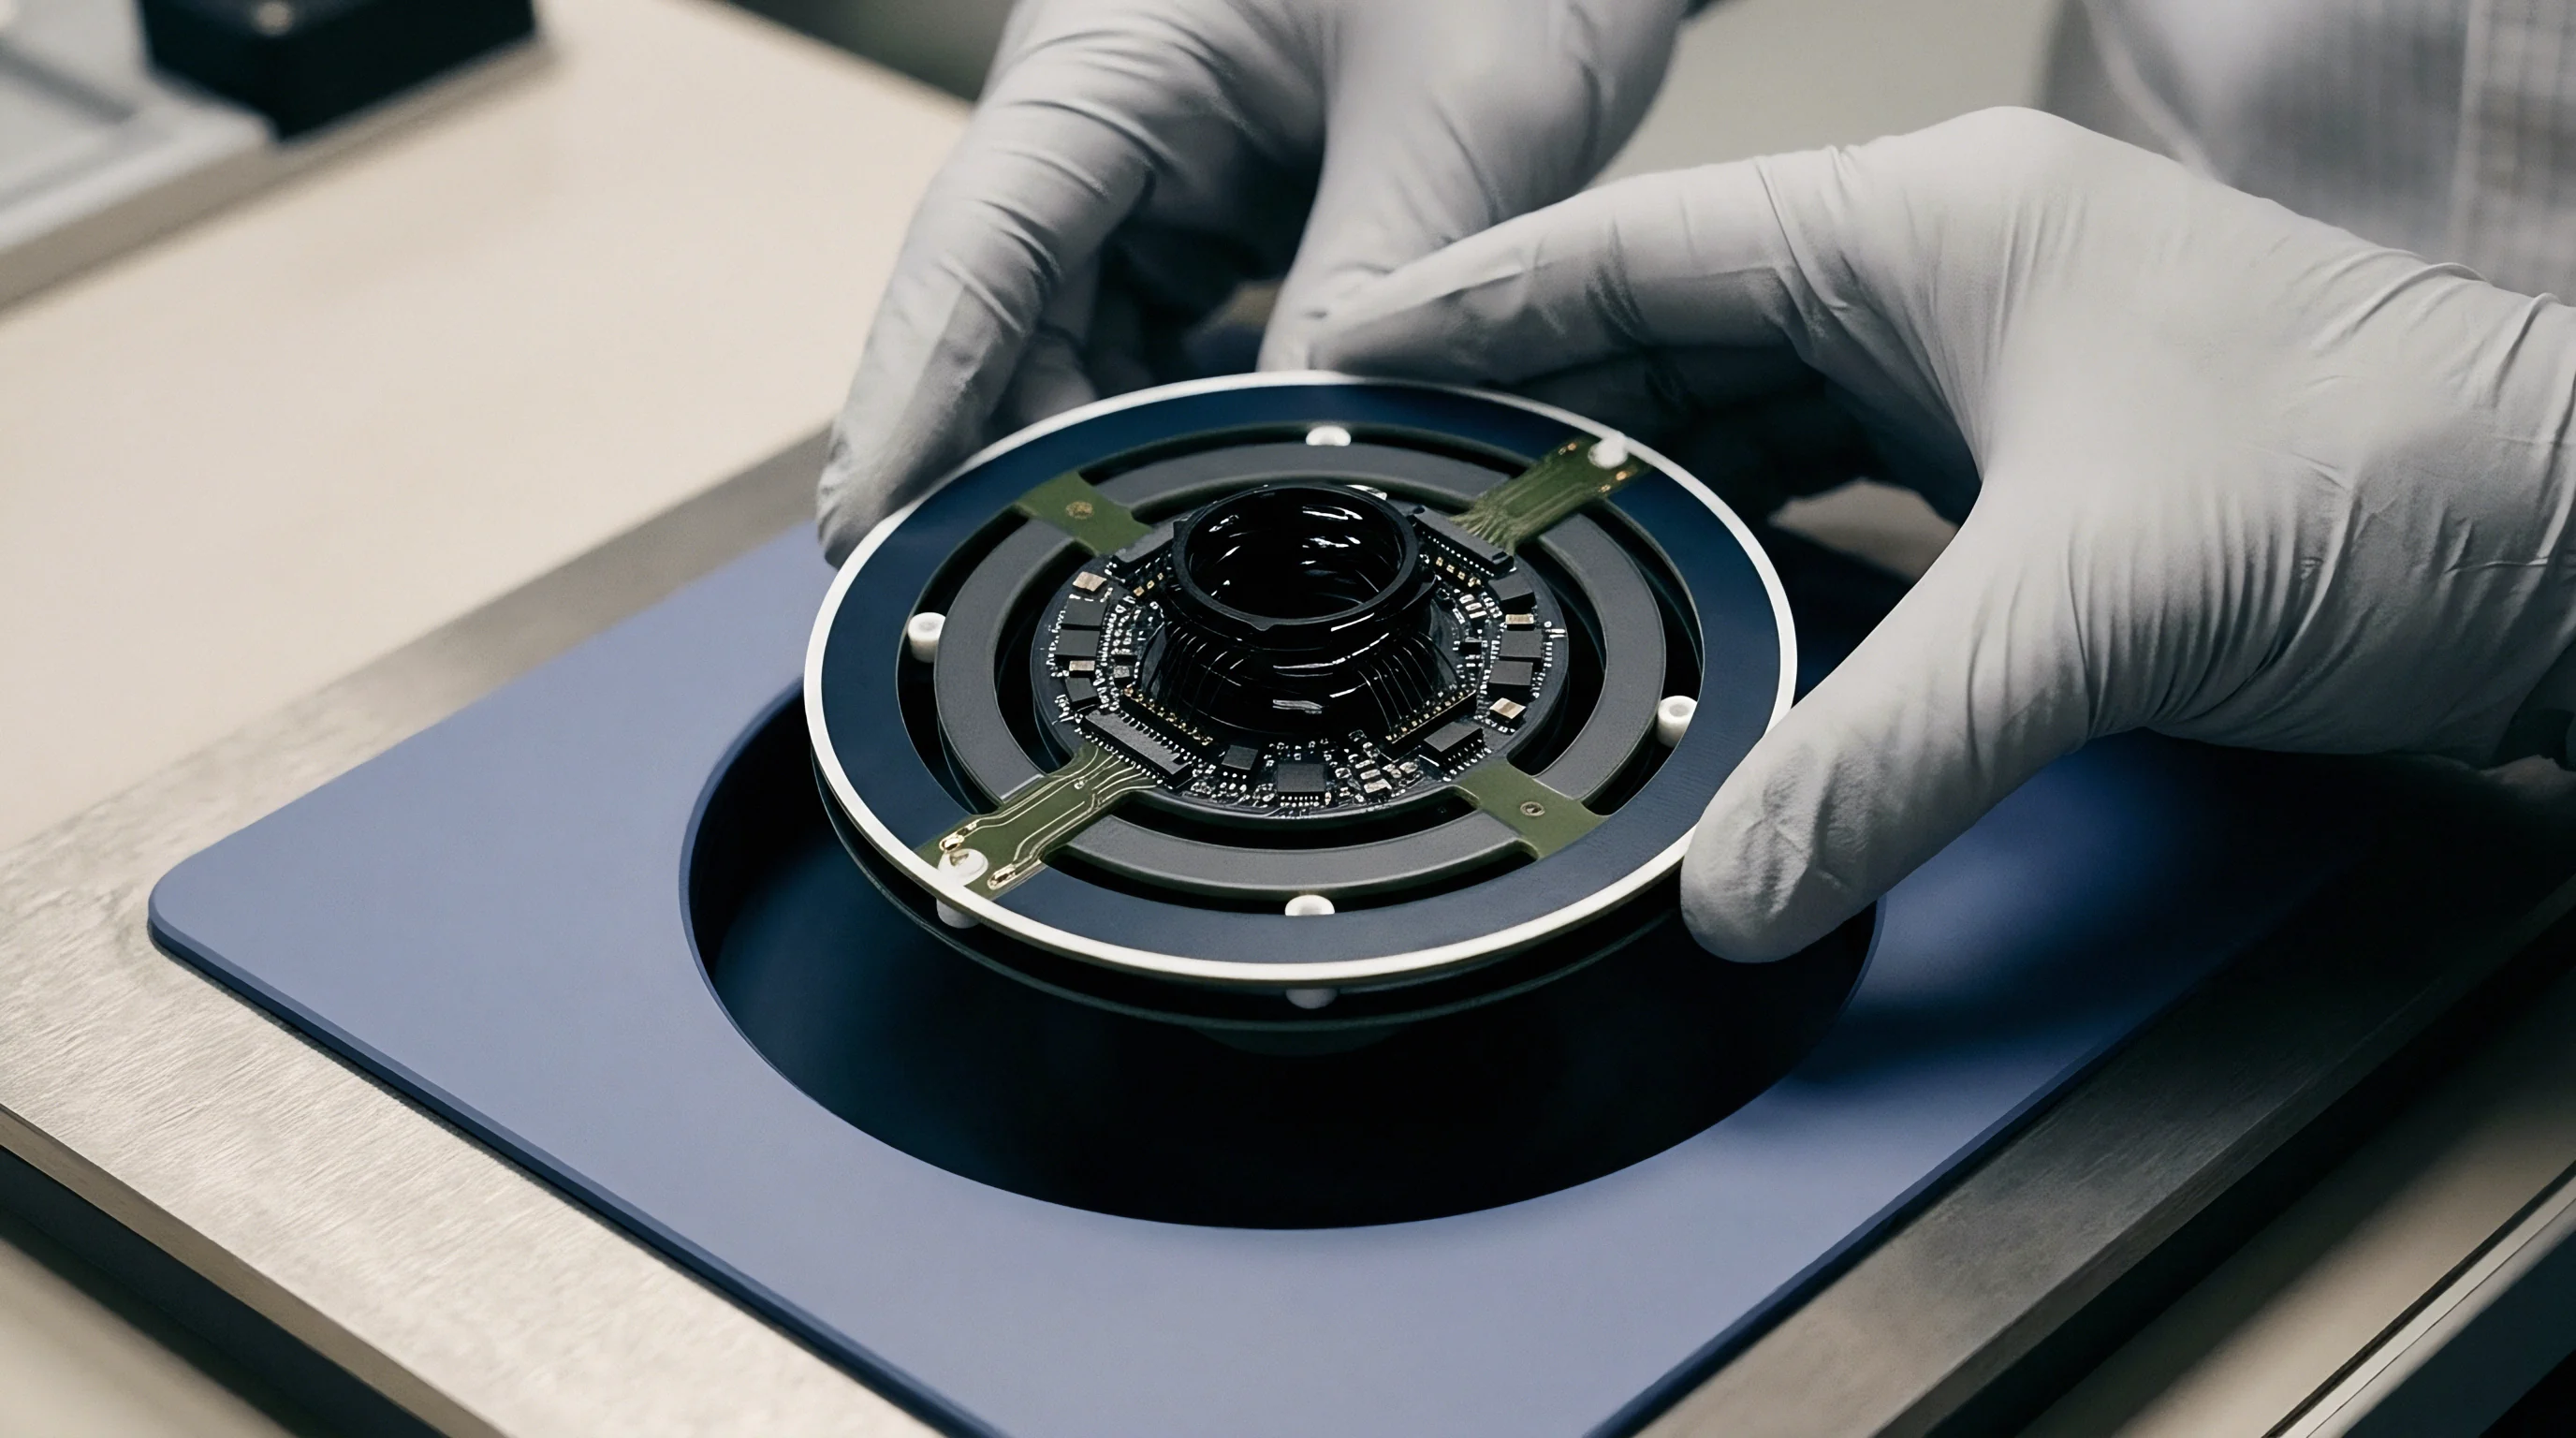
Overlap
Transmitting simultaneously across cellular radios, Wi-Fi 6E/7 chipsets, and Bluetooth modules creates complex spatial field distributions inside tissue phantoms. When tightly packaged antennas radiate at the same time, exposure testing moves past single-carrier Specific Absorption Rate evaluation to multi-band qualification. Regulatory standards cap localized exposure at 1.6 W/kg per 1 gram of tissue under Federal Communications Commission rules and 2.0 W/kg per 10 grams under IEC/IEEE 62209-1528 specifications.
Demonstrating compliance requires measuring combined exposure where individual radiation patterns overlap.
Dielectric tissue loading alters antenna feed currents, distorting free-space beam projections and concentrating peak field densities near chassis edges. When transceivers operate in separate bands ~ such as a 5G NR mid-band array at 3.5 GHz transmitting beside a 5.8 GHz Wi-Fi terminal ~ their absorption distributions form distinct volumetric peaks. Hotspot overlap occurs when these local absorption maxima land near or directly on top of each other inside the phantom medium.
Vector spatial reconstruction resolves field cancelation that scalar peak addition systematically obscures.
Traditional methods handle simultaneous exposure by adding up individual peak values, regardless of physical separation. Summing peak spatial SAR guarantees compliance by assuming every peak coincides in both location and phase. When antenna modules are physically separated, this assumption severely overestimates exposure.
Oversized conservative margins then penalize device performance, forcing firmware to cut transmit power prematurely and degrading both uplink link budgets and data rates in commercial deployments.
Modern qualification pathways use the SAR-to-Peak Location Separation Ratio (SPLSR) or full volumetric field summation derived from vector measurements. The separation ratio permits treating transmissions independently when the distance between primary peaks divided by their individual peak values exceeds regulatory thresholds. When separation falls below those thresholds, labs perform point-by-point vector summation across the localized field distributions.
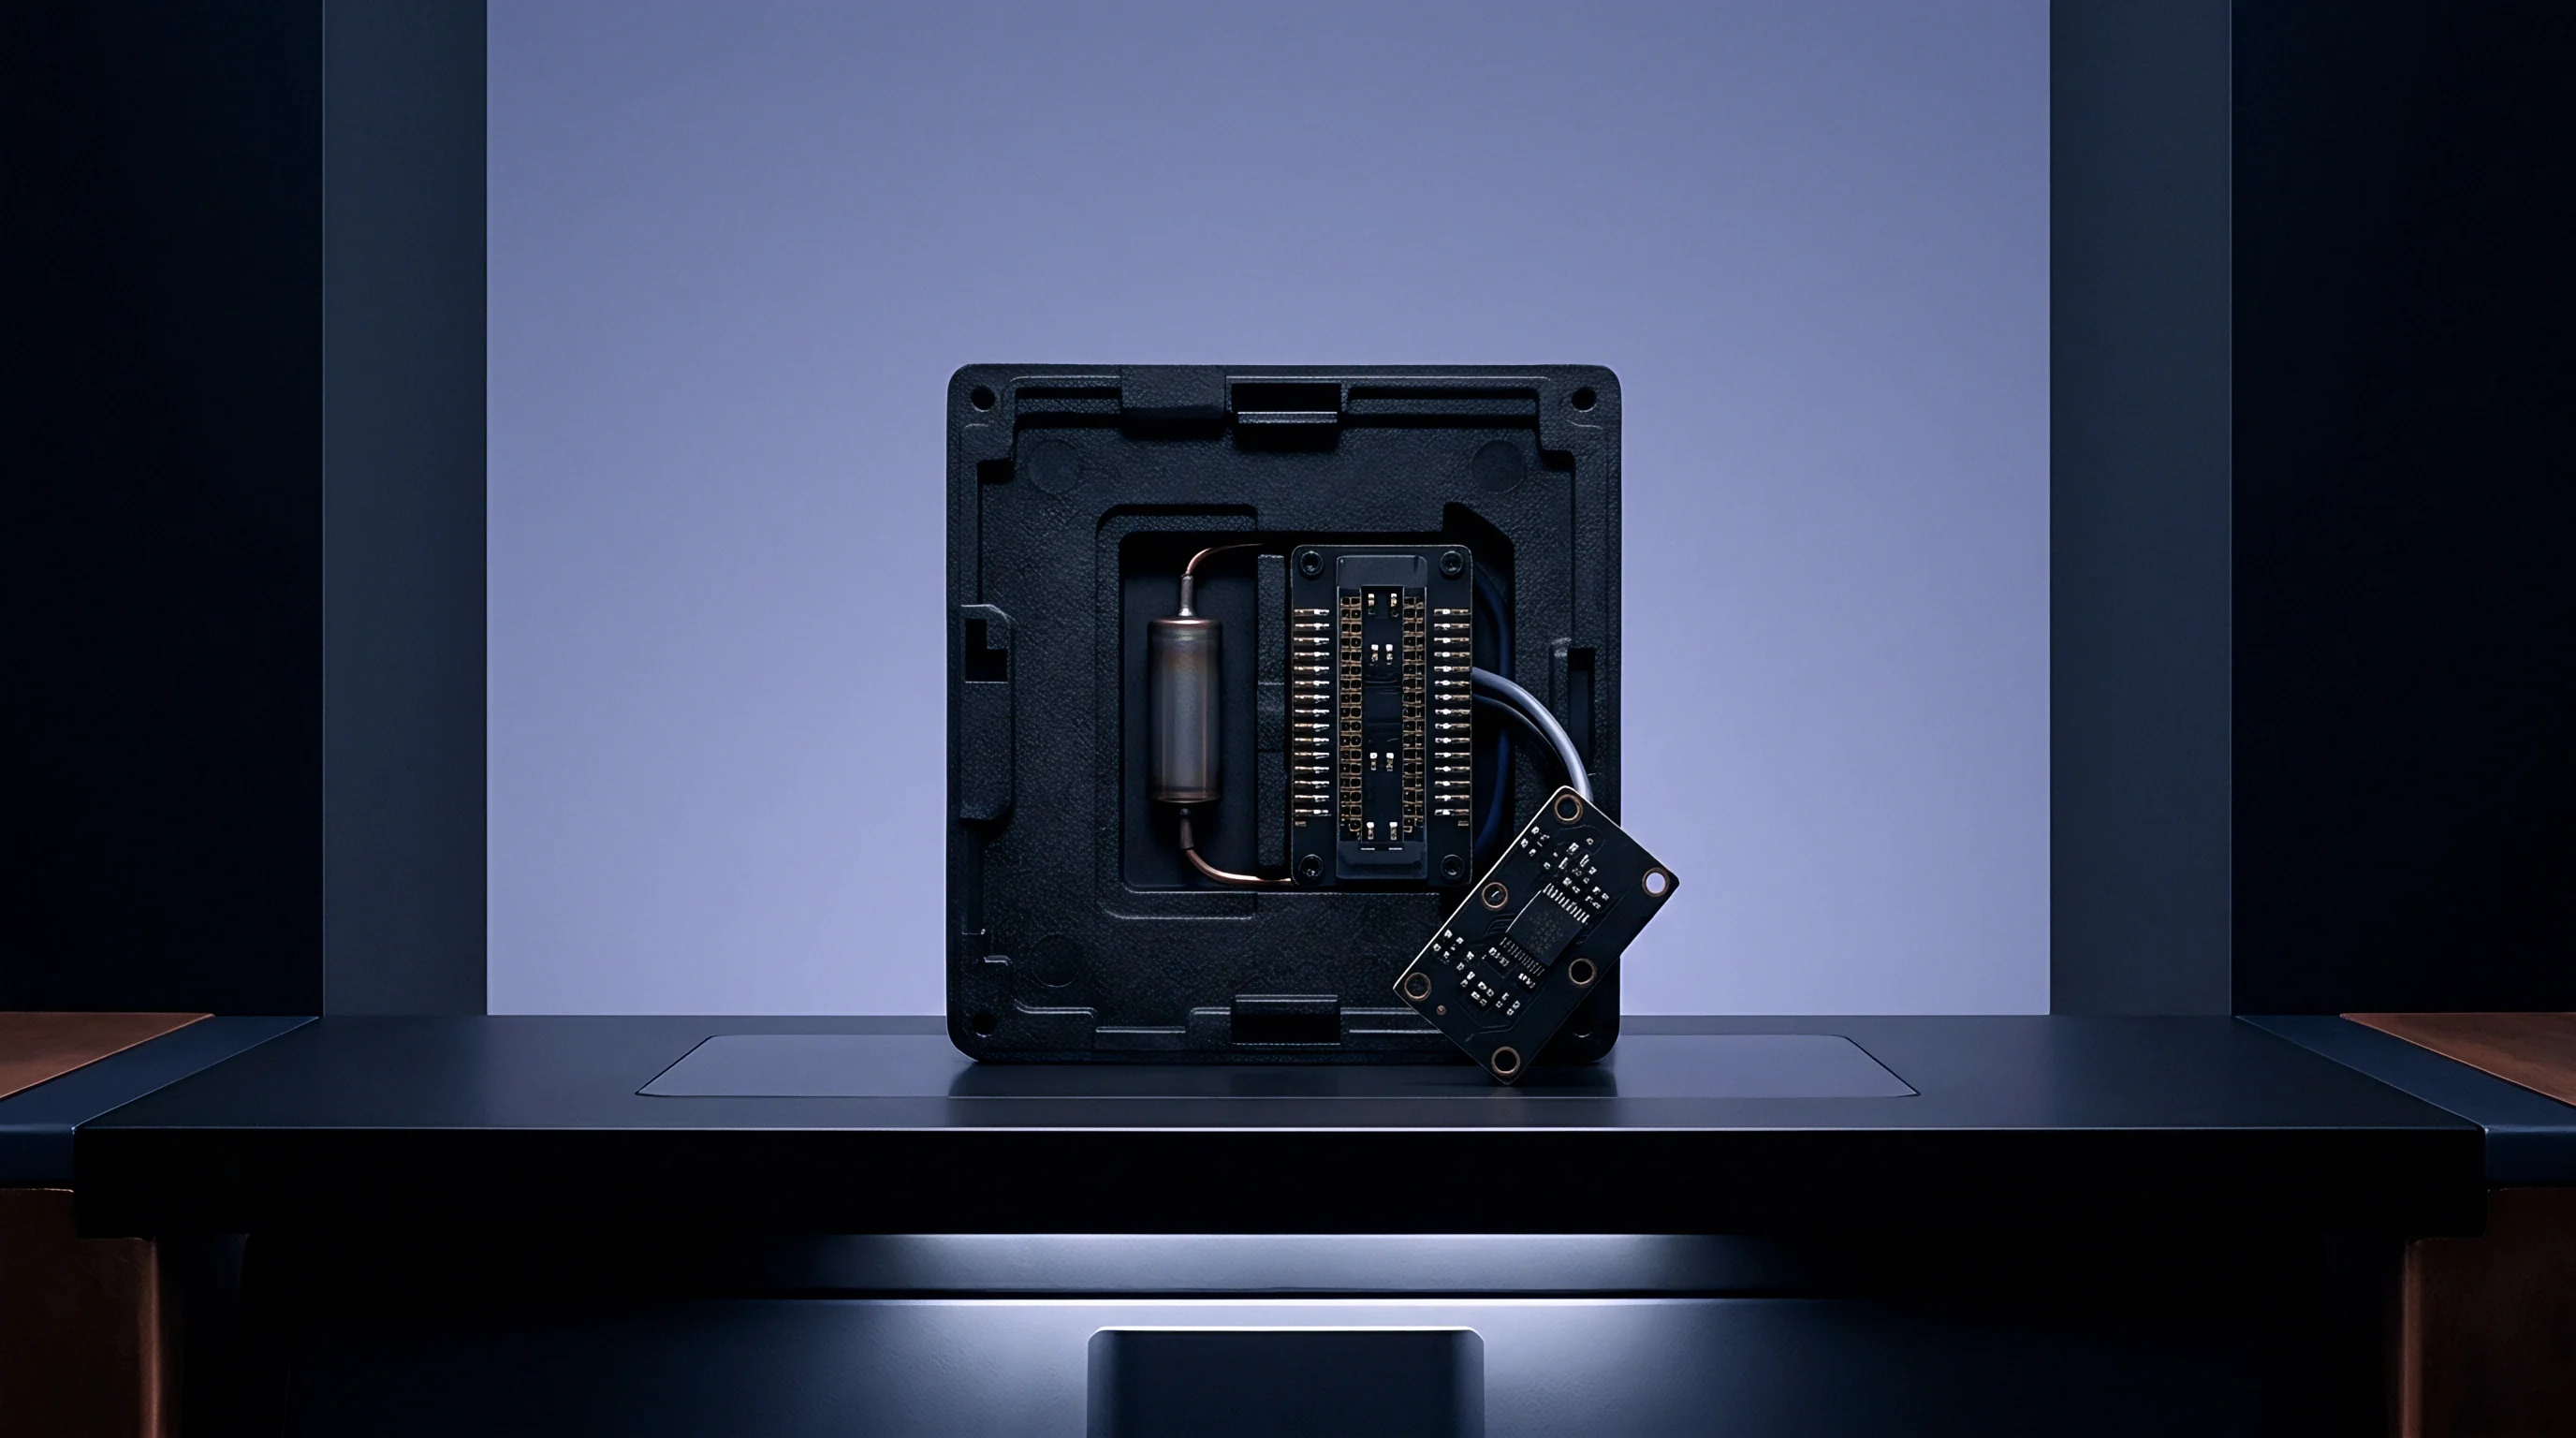
Spatial Summation Mechanics across Concurrent Radio Transmitters
Direct spatial summation requires measuring electric field vectors throughout the phantom volume for each active radio configuration. Point-by-point summation preserves each transmitter’s spatial profile, identifying real volumetric overlap without artificially combining separated energy peaks. Field behavior inside the biological phantom follows Maxwellian wave propagation through a lossy dielectric material defined by frequency-dependent relative permittivity and conductivity values.
At biological tissue interfaces, where field cancellation requires phase coherence, the total localized specific absorption rate at coordinate vector r depends upon the superposition of individual electric field vectors:
SAR(r) = (sigma / (2 rho)) |E_total(r)|^2
Here, sigma is liquid conductivity in Siemens per meter, rho is liquid mass density in kilograms per cubic meter, and E_total is the combined vector electric field. When transmitters operate at different carrier frequencies, phase coherence washes out over time-averaged integration periods, turning total exposure into a simple scalar sum of the individual time-averaged SAR distributions. Dual-band arrays or multi-carrier transmissions sharing coherent local oscillators or overlapping channel assignments retain phase dependencies, making phase resolution the deciding factor in establishing constructive or destructive interference patterns.
Incorrect phase resolution during field scans generates artificial interference lobes or miscalculates destructive interference nodes within the spatial reconstruction volume. Underestimating local SAR leads to failed compliance filings during regulatory market surveillance audits, risking mandatory retail recalls, import bans, and revoked certificates across target commercial territories.


Grid
Array-based fast scanners capture volumetric field data using fixed matrices of encapsulated electric-field sensors placed beneath a thin phantom shell. These multi-probe arrays replace single-probe mechanical gantries, cutting evaluation times from hours to fractions of a second. Where mechanical systems translate a single calibrated dipole probe through high-viscosity liquid to read magnitudes sequentially along an interpolated grid, fixed vector arrays deploy hundreds of miniaturized sensors across a planar or conformal surface to read complex voltages across multiple receiving channels simultaneously.
Discrete sensor arrangements establish physical bounds on spatial resolution. A vector probe array must sample the complex field along a boundary surface closely enough to reconstruct the volumetric field throughout the phantom volume without spatial aliasing. That sampling interval dictates the highest spatial frequency component the system can capture accurately before reconstruction algorithms calculate spatial-average absorption metrics.
Discrete sensor arrays lose field curvature data when spatial pitch exceeds half the dielectric wavelength.
Wavelength contraction inside tissue-equivalent liquid tightens these sampling constraints. The relative permittivity of standard tissue-simulating liquid drops from 55 at 750 MHz down to approximately 35 at 6 GHz. This high dielectric constant shortens the effective electromagnetic wavelength inside the phantom relative to free space by a factor proportional to the square root of permittivity.
At 5.85 GHz, with a liquid relative permittivity of 35.3, the wavelength inside tissue contracts to approximately 8.6 millimeters, compared to 51.2 millimeters in air.
Nyquist sampling criteria require a sensor pitch no greater than half the dielectric wavelength to capture high-order evanescent modes and steep field gradients near the phantom interface. Physical fabrication limits and sensor coupling, however, keep vector sensors from being spaced closer than 5 to 8 millimeters apart. Higher-frequency fields consequently suffer from spatial undersampling, introducing phase retrieval ambiguities and interpolation errors into localized peak determinations.

Electromagnetic Constraints in Dielectric Simulating Liquids
Physical sensor dimensions limit spatial sampling density. Packing probe elements in close physical proximity induces severe mutual coupling between adjacent dipole leads, altering the local field distribution and distorting the calibration matrix. Modern multi-probe arrays balance sensor decoupling and spatial density using multiplexed printed circuit boards and integrated resistive lines that suppress parasitic RF reflections along the data acquisition path.
Phase extraction in multi-probe systems depends on relative complex transfer functions established during lab calibration routines. When a multi-band device excites the phantom, rapid phase rotation across the contracted dielectric wavelength magnifies any small mechanical sensor displacement or phase drift within the receiver architecture.
| Frequency Band (MHz) | Permittivity (epsilon) | Conductivity (S/m) | Tissue Wavelength (mm) | Nyquist Pitch (mm) | Standard Array Pitch (mm) |
|---|---|---|---|---|---|
| 750 | 55.5 | 0.89 | 53.7 | 26.8 | 12.5 |
| 1800 | 40.0 | 1.40 | 26.3 | 13.1 | 10.0 |
| 2450 | 39.2 | 1.80 | 19.5 | 9.7 | 8.0 |
| 3500 | 37.9 | 2.91 | 13.9 | 6.9 | 6.5 |
| 5200 | 36.0 | 4.66 | 9.6 | 4.8 | 5.0 |
| 5850 | 35.3 | 5.27 | 8.6 | 4.3 | 5.0 |
Scanning platforms encounter distinct physical sources of measurement variance when capturing complex multi-band distributions:
- Spatial discretization errors stem from array grid dimensions exceeding the local Nyquist limit, introducing spatial aliasing that smooths steep absorption peaks.
- Mutual sensor coupling distorts baseline calibration values when adjacent probe elements reradiate localized reactive near fields within the phantom shell.
- Channel phase skew develops from temperature variations and cable flexure across high-speed parallel analog-to-digital converter signal pathways.
- Dynamic range compression masks low-level phase relationships in peripheral array locations where field strengths drop more than 20 dB below peak values.
Proprietary spatial expansion algorithms aim to eliminate undersampling anomalies across millimeter-wave and upper mid-band frequencies, treating residual interpolation divergence as a negligible calibration offset.
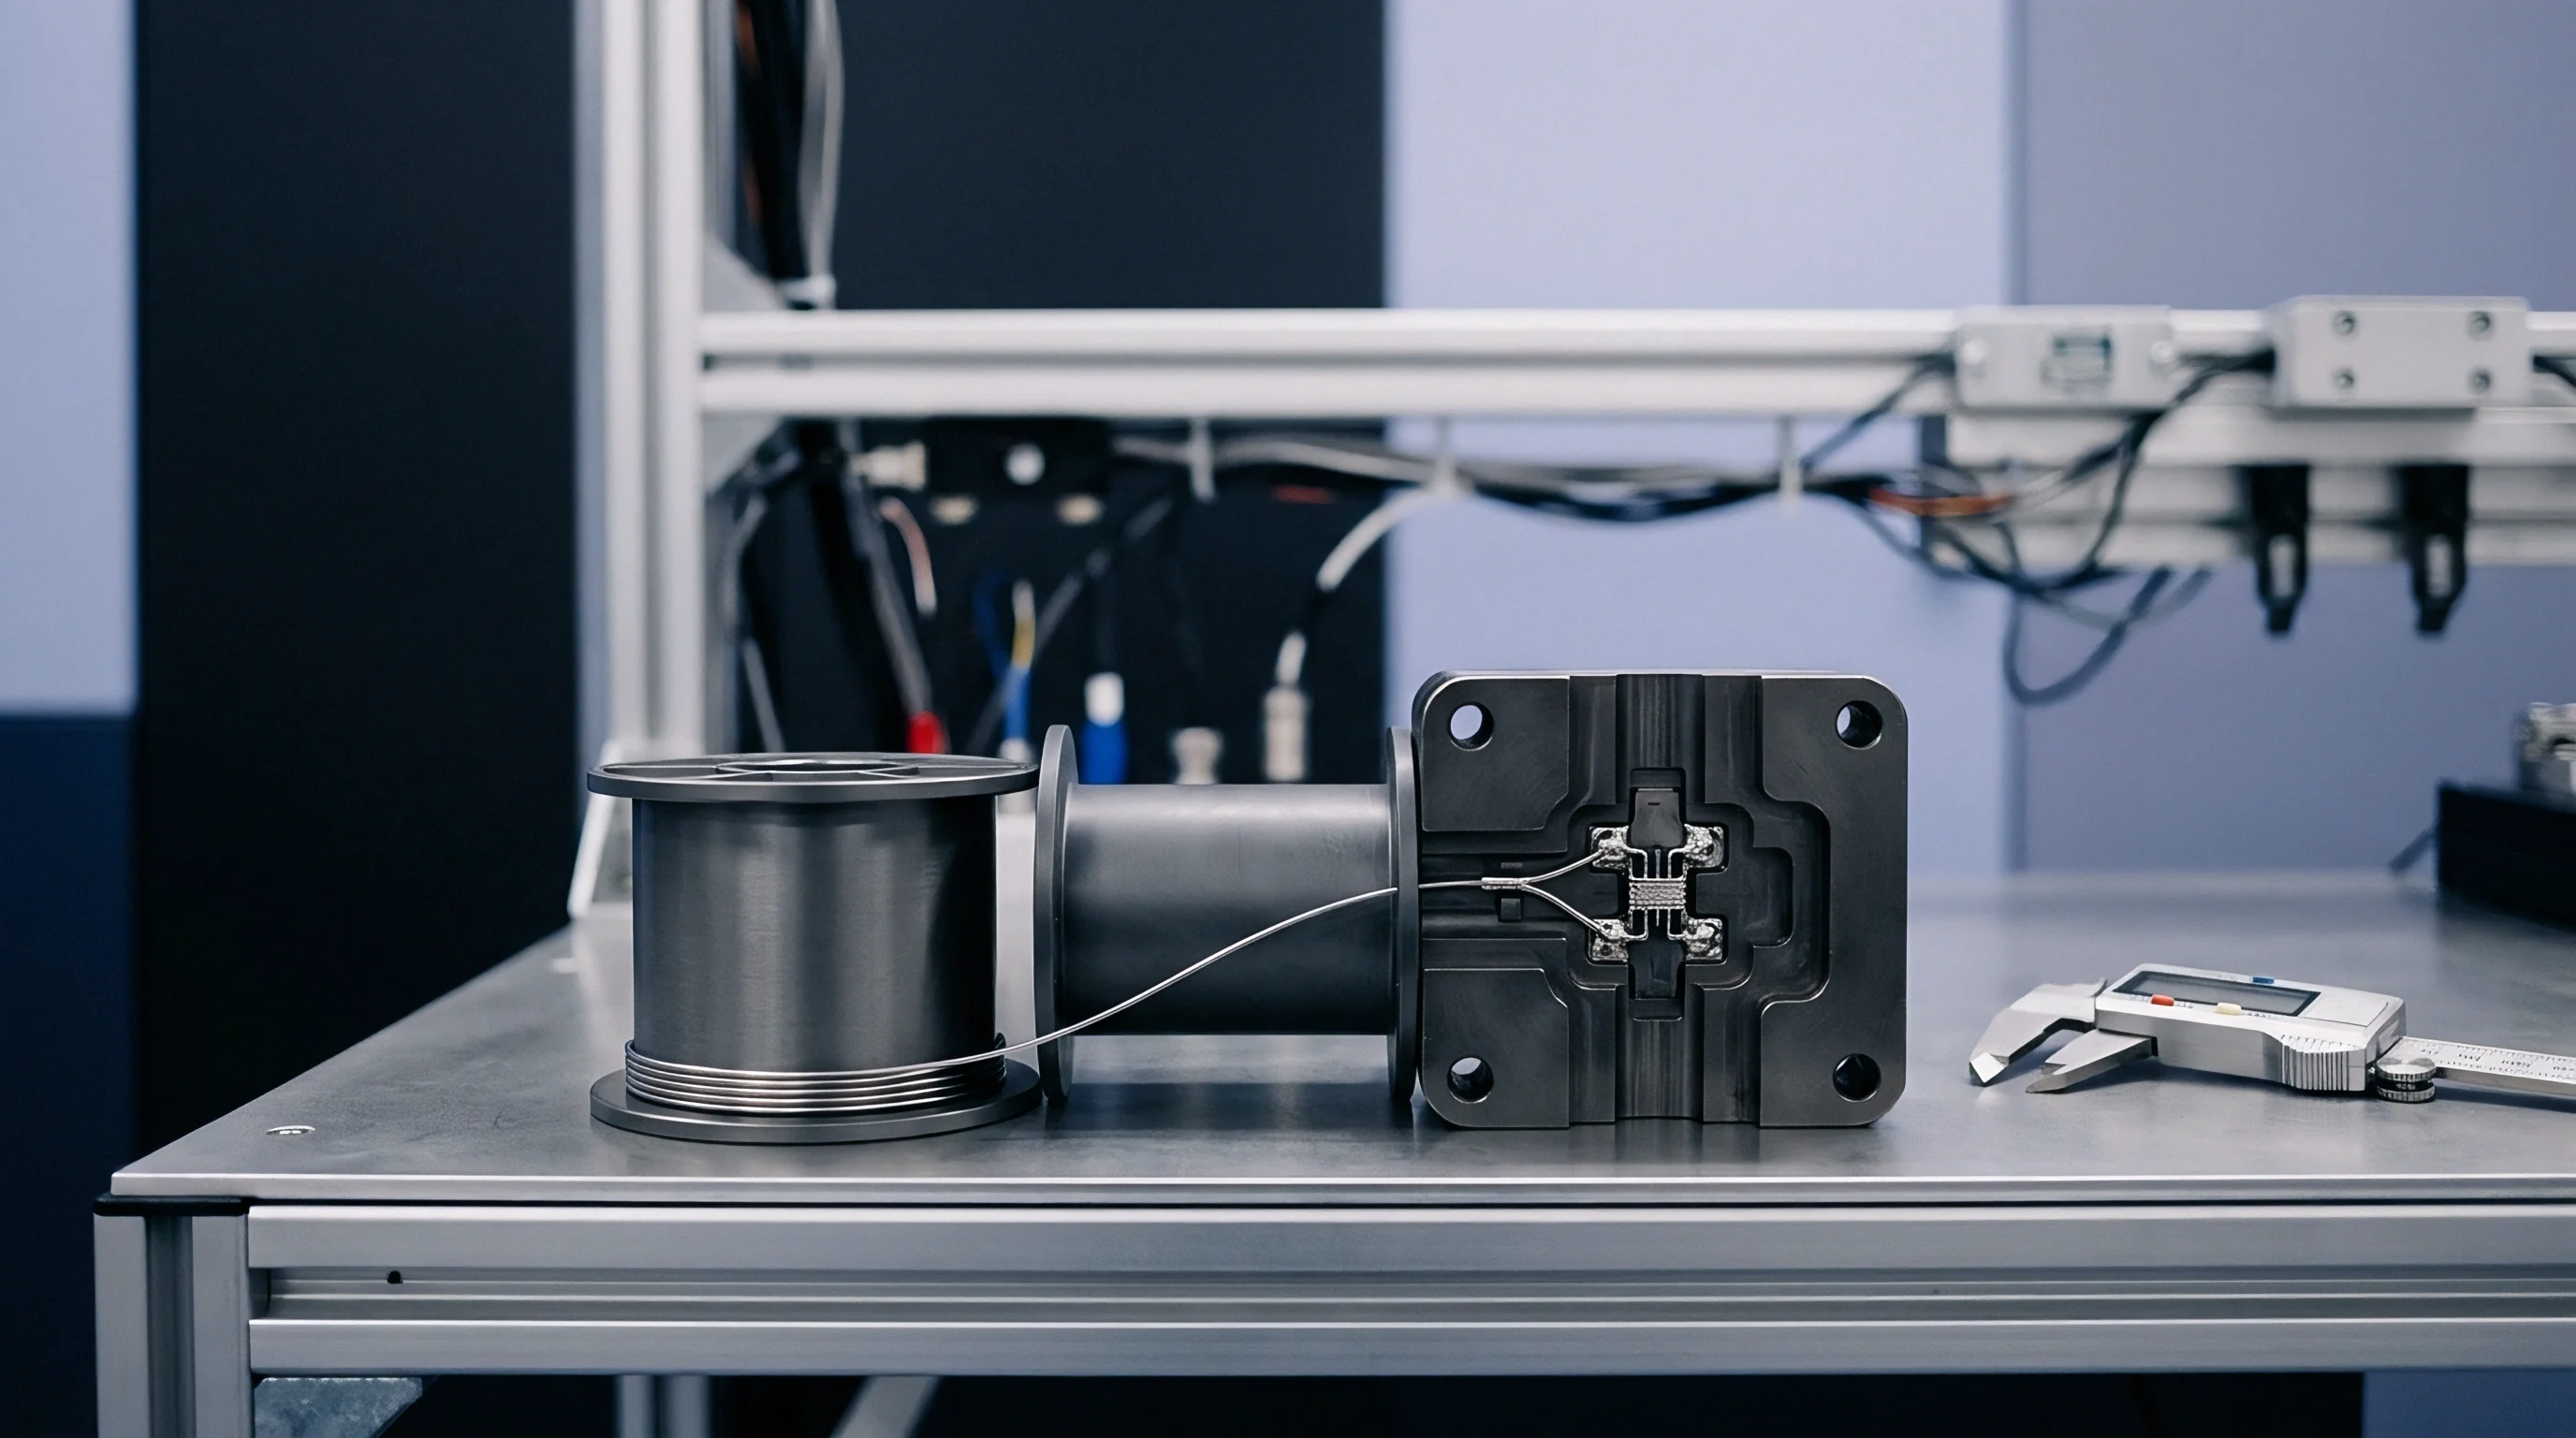
Reconstruction
Reconstructing volumetric fields from discrete two-dimensional boundary data relies on inverse electromagnetic problem solving. Because multi-probe systems capture fields along a fixed boundary surface, mathematical reconstruction engines compute the three-dimensional Helmholtz wave equation backward into the phantom volume. These algorithms employ equivalent source methods, spherical wave expansions, or plane wave spectrum transformations to model localized current distributions and map absorption profiles at arbitrary depth planes.
Computing spatial derivatives of the electric field requires clean phase and amplitude boundaries. Inverse solvers display severe ill-posedness, where small phase uncertainties on the measurement boundary grow exponentially during backward spatial propagation. Without strict regularization constraints, phase errors convert into high-frequency spatial noise, creating synthetic localized hotspots that never existed on the physical device under test.
When phase errors artificially inflate reconstructed absorption values, firmware engineers must increase dynamic power backoff parameters in factory calibration tables. A 1.5 dB artificial elevation in reported 1-gram SAR forces a 1.5 dB reduction in maximum conducted transmit power. In rural cellular bands or dense urban Wi-Fi scenarios, that power penalty directly shrinks cell-edge coverage radius, degrades uplink throughput, and drains end-user battery life through persistent packet retransmissions.

Equivalent Current Sources and Phase Retrieval Algorithms
Equivalent source reconstruction models the antenna and phantom interface as an array of virtual magnetic and electric dipoles situated on an enclosing surface. The algorithm computes the complex excitation coefficients of these fictitious sources to match tangential field values measured by the physical probe matrix. Once solved, the engine propagates the fields forward through the known lossy tissue medium to calculate energy dissipation across every voxel in the spatial grid.
Phase retrieval algorithms often hit convergence limits when two transmitters operate at closely spaced frequencies within overlapping physical regions. If coarse probe resolution prevents uniquely resolving phase coherence between antenna elements, the reconstruction engine defaults to conservative phase-alignment assumptions.
A three-degree phase uncertainty at 5.85 GHz introduces a 0.42 W/kg variance in peak spatial reconstruction within lossy media.
Execution of simultaneous transmission qualification follows a rigorous sequence to ensure spatial accuracy:
- Baseline single-channel calibration establishes probe array amplitude and phase correction offsets using reference precision dipoles inside tissue fluid.
- Conformal surface scanning records the two-dimensional complex voltage matrix across all active receiver channels with the device radiating at maximum power.
- Inverse boundary propagation translates tangential electric field data through the phantom shell thickness using regularized wave spectrum inversion.
- Spatial voxel interpolation calculates the raw three-dimensional SAR matrix across a uniform 1-millimeter grid throughout the target absorption volume.
- Averaging volume integration applies standardized mathematical cube routines to extract spatial peak 1-gram and 10-gram mass-averaged absorption figures.
- Overlap matrix computation correlates the spatial coordinates of separate radio hotspots to assess whether simultaneous exposure limits demand power throttling.
The operational dispute remains whether fast array phase retrieval holds sufficient mathematical stability across complex multi-antenna configurations, or whether physical separation verification mandates reverting to traditional gantry-based single-probe measurements when peak margins drop below five percent.

Phantom
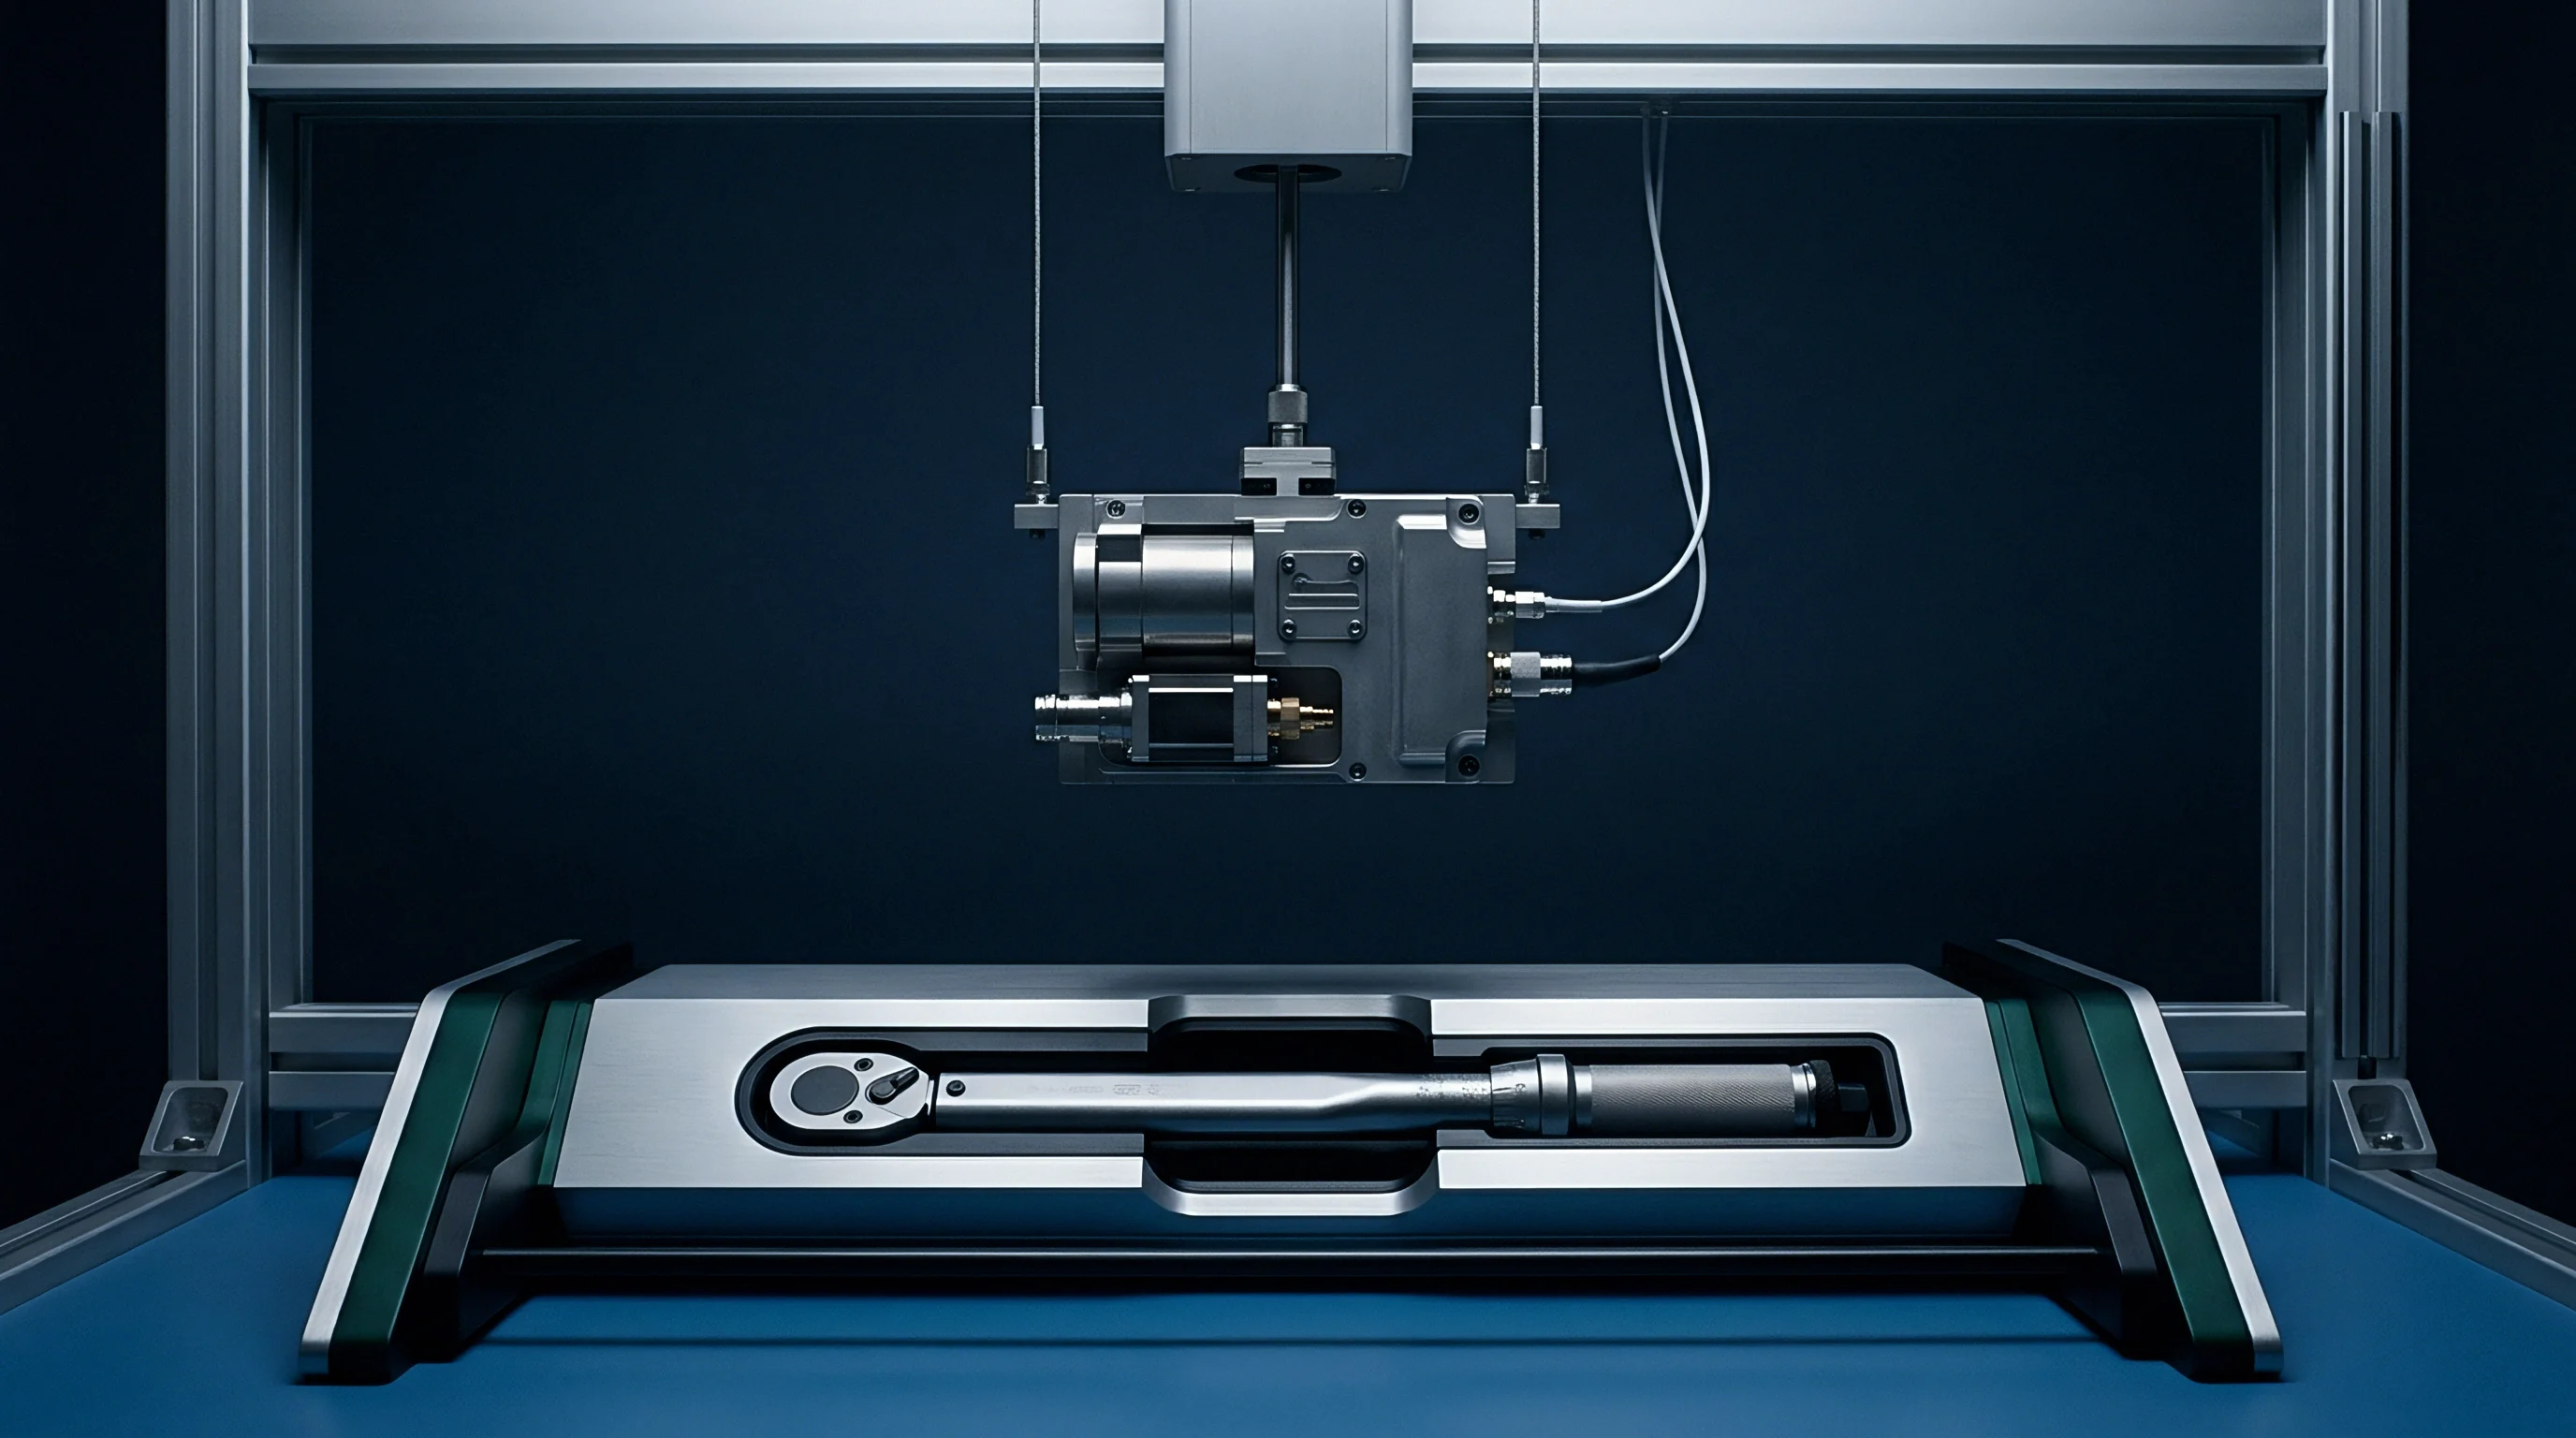
The structural geometry of the phantom directly influences field behavior and phase resolution during SAR qualification. Standardized testing utilizes specific physical enclosures: the Flat Phantom for body-worn evaluations, and the Specific Anthropomorphic Mannequin, designated SAM, representing human head contours. The SAM phantom incorporates a rigid plastic shell with a precisely controlled dielectric constant of 2.0 and a nominal shell thickness of 2.0 millimeters across primary exposure zones, excluding the compressed ear region.
Shell thickness tolerances introduce significant phase disturbances into near-field measurements. Variations of plus or minus 0.2 millimeters in shell thickness shift the mechanical separation between device antennas and internal tissue-simulating fluid. Because antenna reactive near fields decay inversely with the cube of distance, small physical offsets alter antenna ground currents, detuning radiating structures and modifying phase distributions before energy enters the probe array sensing volume.
Multi-band array antennas ~ especially those integrating switched-beam cellular modules with concurrent 2.4 GHz and 5 GHz Wi-Fi paths ~ exhibit spatial phase centers that shift dynamically based on user grip and phantom contact angles. A phone resting against the SAM cheek creates an asymmetrical dielectric boundary that distorts array phase fronts, causing spatial energy distributions to spread unevenly across curved phantom surfaces.

Conformal Probe Mapping on Curved Anthropomorphic Geometries
Planar probe arrays struggle to map fields directly over the complex curvatures of the SAM head phantom. Measuring exposure along the jawline or temple requires conformal probe distributions or mathematical coordinate transformations from planar sensor arrays. Mapping fields across complex geometric gradients introduces coordinate transformation errors, where probe alignment inaccuracies translate directly into artificial phase noise within the reconstruction engine.
Testing multi-transmitter configurations requires running high-speed data links and RF supply lines to the device under test. Unsuppressed common-mode currents traveling along external test cables radiate spurious fields, corrupting phase measurements across peripheral array probes and skewing overlap calculations.
| Transmitter Combination | Primary Hotspot Separation (mm) | Peak Summation SAR (W/kg) | Vector Spatial SAR (W/kg) | Margin Delta (dB) | Qualification Status |
|---|---|---|---|---|---|
| LTE Band 7 + 2.4 GHz WLAN | 42.5 | 1.82 | 1.18 | 1.88 | Compliant via Vector Spatial |
| 5G NR n78 + 5.8 GHz WLAN | 14.2 | 2.15 | 1.52 | 1.51 | Compliant via Vector Spatial |
| 5G NR n41 + 6.5 GHz Wi-Fi 6E | 8.5 | 2.45 | 1.95 | 0.99 | Non-Compliant Requires Backoff |
| LTE Band 13 + Bluetooth | 65.0 | 1.35 | 0.92 | 1.67 | Compliant via SPLSR Threshold |
| Dual 5G NR (n77 + n258 IF) | 5.2 | 2.88 | 2.62 | 0.41 | Non-Compliant Requires Backoff |
Sourcing and qualification teams must evaluate specific mechanical and operational criteria when selecting compliance pathways for multi-transmitter products:
- Antenna array isolation determines whether mutual reactive loading distorts individual beam phase fronts during simultaneous transmission states.
- Enclosure thickness consistency preserves the spatial phase relationship between radiating elements and internal liquid boundaries across production lots.
- Firmware power tables govern dynamic conducted power ceilings based on real-time spatial overlap and thermal sensor input.
- Laboratory positioning precision limits angular tilt variances that introduce false phase gradients during multi-axis phantom scans.
Field distributions align predictably with mechanical surfaces when physical clearances remain stable across repeated measurement passes.

Clearing
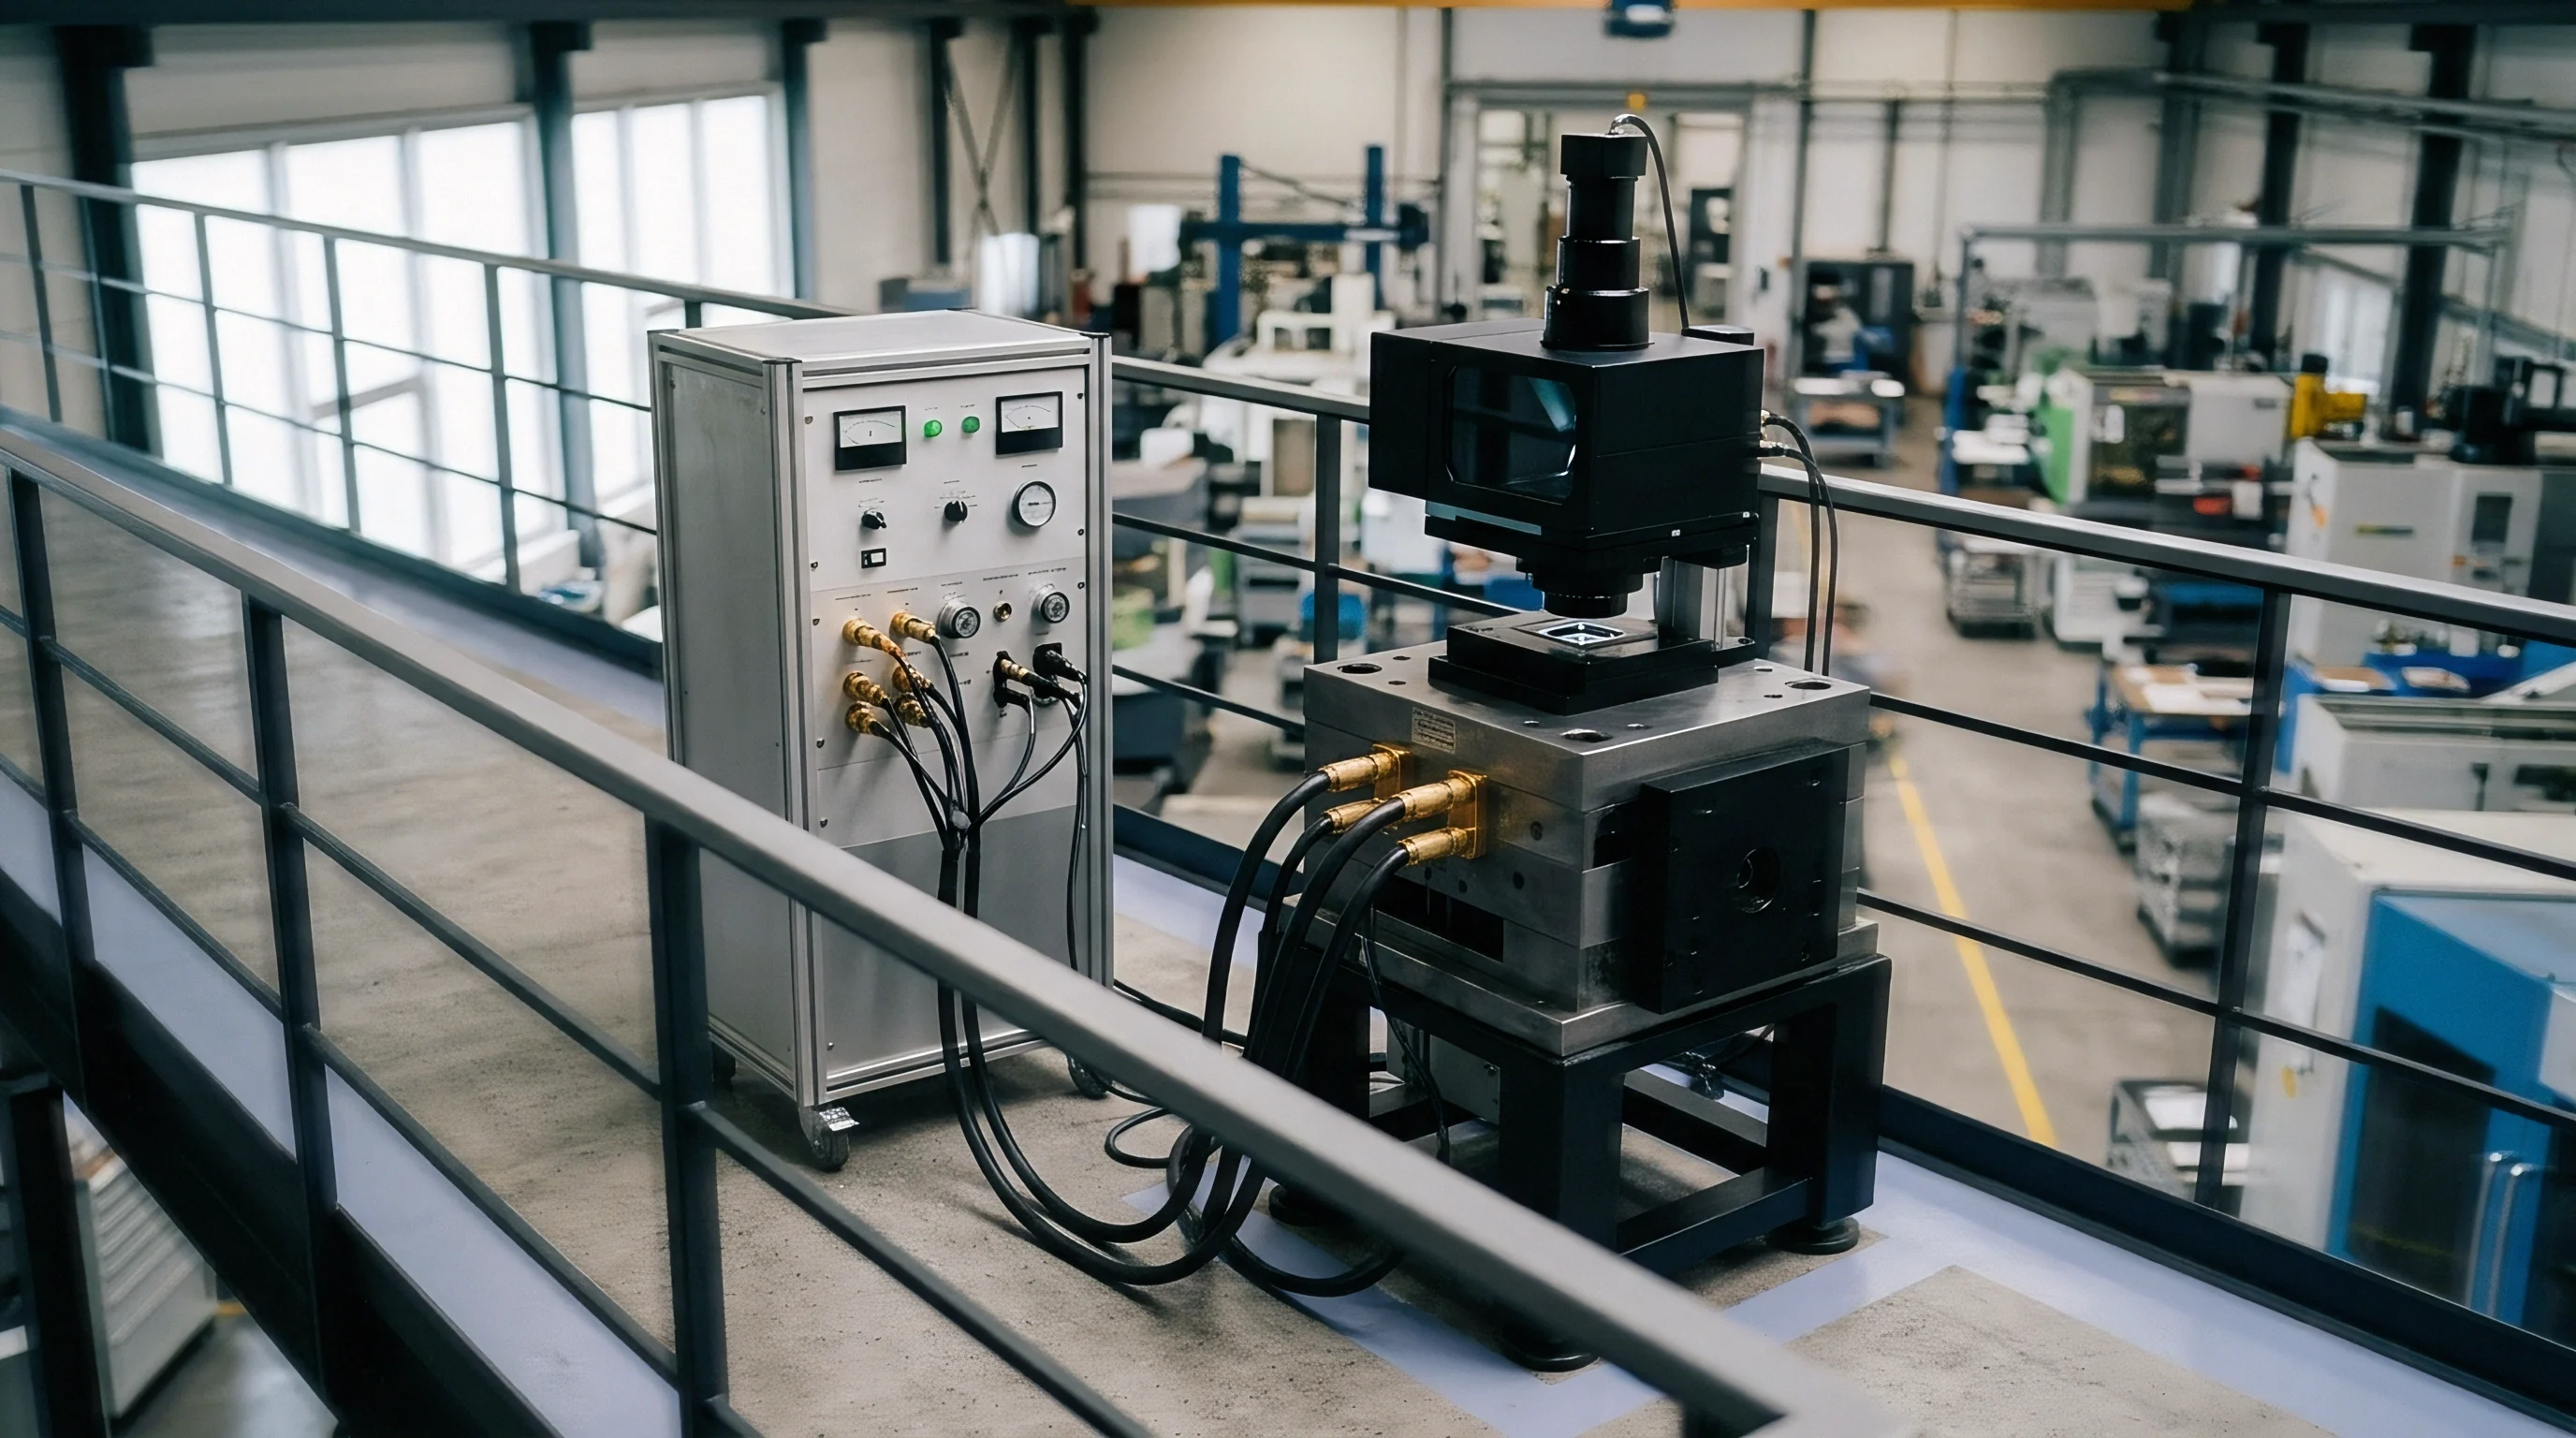
Securing regulatory clearance for devices with multi-band array antennas requires robust qualification dossiers built on defensible spatial overlap data. Filing authorities scrutinize simultaneous transmission analyses closely, particularly when product designs avoid conservative peak summation in favor of vector spatial summation or SPLSR justifications. Sourcing managers, regulatory engineers, and RF designers coordinate to ensure measurement reports satisfy both regional exposure limits and stringent lab audit standards without forfeiting link performance.
If an inaccurate SAR qualification report forces firmware developers to permanently reduce transceiver power budgets, the commercial penalty is paid immediately in field performance. A 2 dB drop in 5G NR uplink power cuts cell coverage area by up to 25 percent in suburban propagation environments, increasing call drop rates and reducing uplink data speeds. Sourcing decisions must weigh the capital expense of precision vector qualification against the permanent commercial liabilities of conservative power throttling.
Phase uncertainties propagate directly into approval timelines. If a regulatory authority questions the phase resolution validity of a fast-scanning array system during filing reviews, the manufacturer faces mandatory re-testing on traditional, slow mechanical single-probe gantries. Re-running a comprehensive multi-band test matrix across dozens of operating channels, body postures, and accessory positions adds four to six weeks to project schedules, frequently missing critical retail launch windows.

Dossier Preparation and Technical Justification Pathways
Building a successful compliance filing demands transparent documentation of measurement uncertainties. When fast vector array scanners generate the underlying data, the regulatory package must include detailed calibration certificates validating sensor phase responses, grid interpolation algorithms, and boundary condition assumptions. System validation scans performed with reference dipoles before and after product qualification establish operational stability, confirming that probe array drift remains well within published regulatory tolerances.
FCC KDB 447498 D04 interim procedures stipulate that when the sum of localized 1-gram SAR values exceeds 1.6 W/kg, compliance filings require either explicit SAR-to-peak-location separation ratio calculations below 0.04 or comprehensive volumetric multi-band evaluation, leaving the device locked to conservative power backoff tables whenever phase resolution limitations obscure actual spatial peak separation.