Deriving Signal Integrity Defect Models from Physical Trace Modifications
Deriving signal integrity defect models requires mapping physical trace cross-section variations into spatial RLGC matrices validated by de-embedded TDR and VNA measurements.

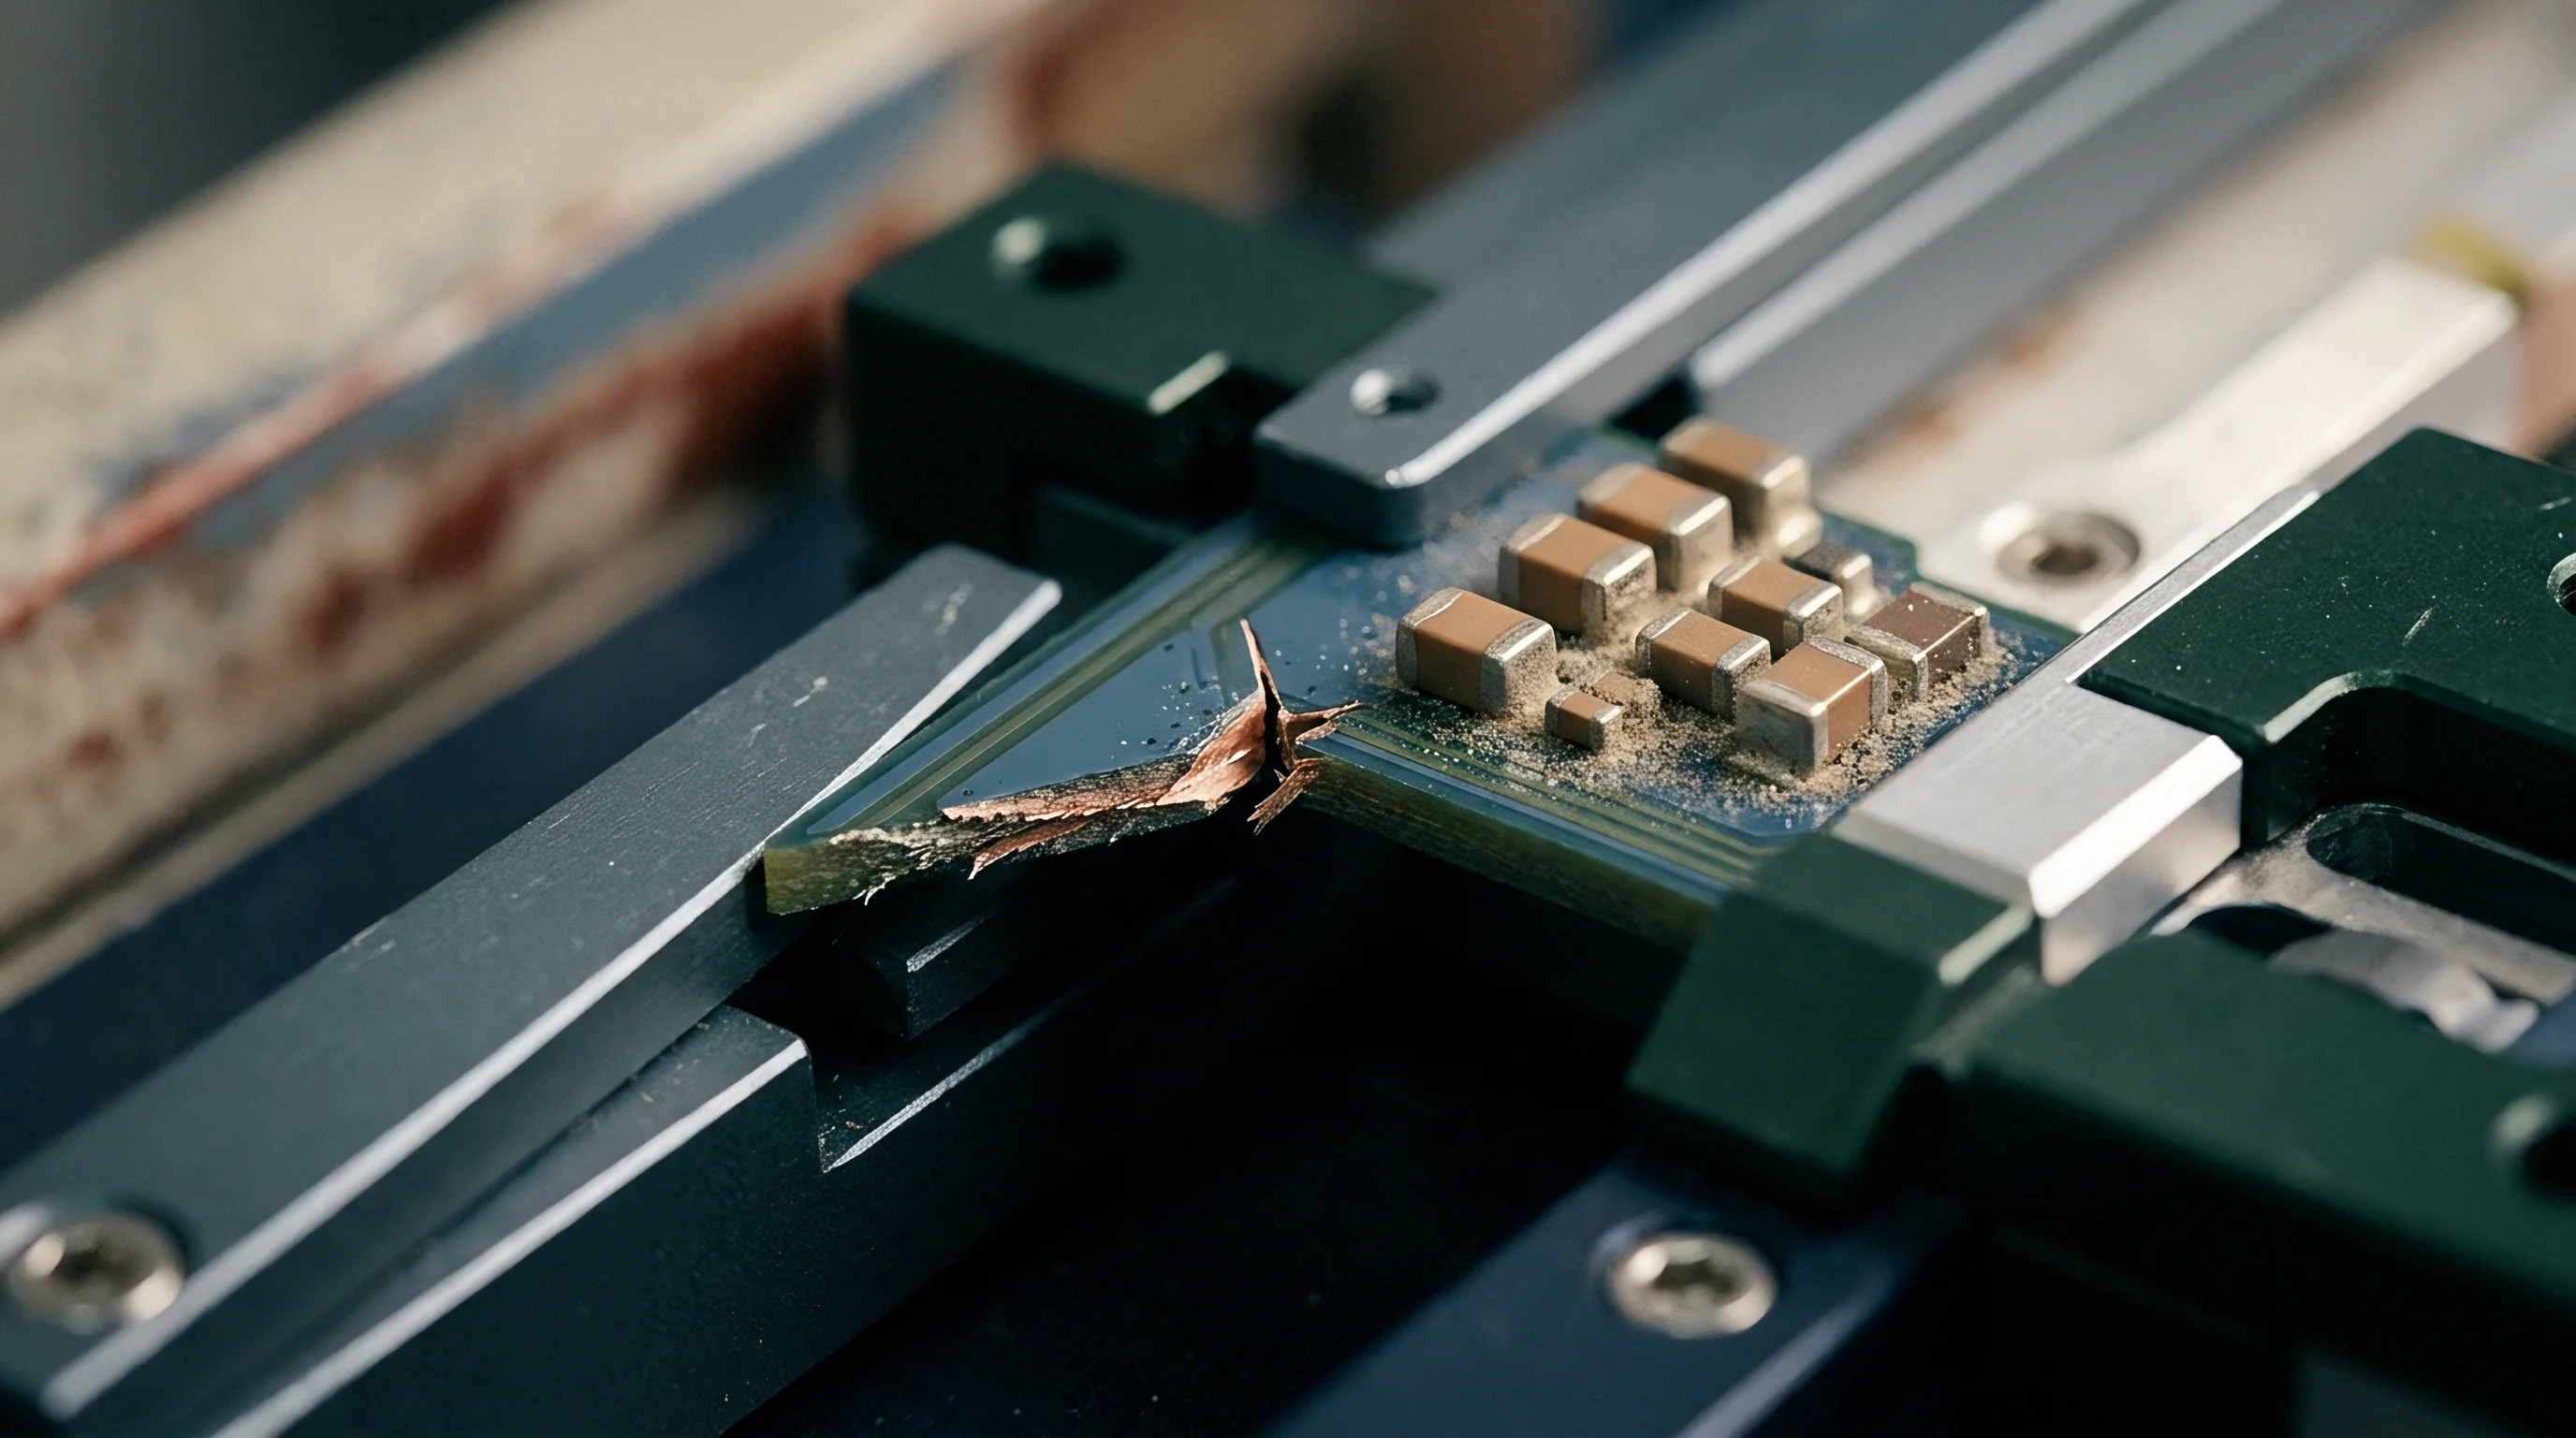
Deformation
Subtractive etching of copper foil on printed circuit board substrates introduces geometric deviations from ideal rectangular interconnect profiles. Process fluid dynamics cause the top edge of a conductor to etch faster than the base, yielding a trapezoidal cross-section. The etch factor, defined as the ratio of lateral undercut to copper thickness, dictates the departure from modeled cross-sectional area.
Galvanic micro-voiding, substrate prepreg resin recession, and localized trace necking modify conductor volume along high-speed signal paths.
These physical modifications shift per-unit-length capacitance and inductance. A narrower top width raises loop inductance while reducing shunt capacitance to adjacent reference planes. Chemical attack leaves rough edges that concentrate localized electric fields, causing current to crowd at the outer boundaries once frequency pushes skin depth below three micrometers.
On thin dielectric cores, a five-micrometer expansion in trace width from plating over-etch drops impedance by two ohms.
Microscopic inspection reveals mousebites along trace edges where photolithographic dry film resist lifts during chemical development. These localized notches restrict current flow, creating inductive bumps. Plating voids along side walls alter surface resistance and local dielectric absorption.
Precise electromagnetic defect models must map these physical variations directly into spatial impedance profiles rather than assuming nominal cross-sectional dimensions.
A ten percent reduction in trace width along a five millimeter segment increases characteristic impedance by three point eight ohms on a fifty ohm nominal microstrip layout.
Dielectric over-etching adjacent to copper traces forms trenching defects that alter the effective relative permittivity of the surrounding medium. Air pockets trapped within resin voids near conductor boundaries drop local capacitance. Spatial non-uniformity along differential pairs impairs common-mode rejection, converting differential signal energy into unwanted common-mode noise.
Whether localized plating roughness variations alter phase velocity beyond the margin predictable by standard stochastic field solvers remains an open analytical question.

Extract
Translating physical geometry variations into electrical behavior begins with two-dimensional and three-dimensional field solver cross-section analysis. Telegrapher equations describe propagation along non-uniform trace structures through spatial distributions of resistance, inductance, conductance, and capacitance matrices. Spatial integration of cross-sectional slices along the transmission path converts physical topography variations into continuous per-unit-length spatial parameter profiles.
Cross-sectional variations yield localized impedance shifts calculated from per-unit-length electrical properties. Consider a high-frequency interconnect constructed on a Rogers 4350B hydrocarbon ceramic laminate. Take a substrate with a nominal core thickness of 100 micrometers, a dielectric constant of 3.66, and a loss tangent of 0.0037 at 10 GHz.
The design specifies half-ounce copper foil with a nominal thickness of 18 micrometers. Chemical processing reduces the nominal trace width from 220 micrometers to a necked-down section of 175 micrometers over a transition length of 1.2 millimeters.
A quasi-static two-dimensional field solver computes the unperturbed cross-sectional capacitance at 98.4 picofarads per meter and inductance at 246.1 nanohenries per meter, yielding a nominal characteristic impedance of 50.0 ohms. Within the necked segment, narrowed conductor width drops shunt capacitance to 82.1 picofarads per meter while elevating loop inductance to 289.5 nanohenries per meter. The local characteristic impedance jumps to 59.4 ohms across the defect region.
Cascading these spatial segments through telegrapher chain matrices generates the full network response. The localized reflection coefficient delta at the entry boundary of the defect equals 0.086. Phase velocity shifts down within narrow geometries due to altered spatial field distributions in the dielectric core.
High-frequency loss calculations include modified Wheeler incremental inductance rules to capture edge roughness contributions.
| Defect Type | Physical Modification | Inductance Delta (%) | Capacitance Delta (%) | Impedance Shift (Ohms) |
|---|---|---|---|---|
| Trapezoidal Etch Bias | 20 degree side-wall angle slope | +3.2 | -4.1 | +1.85 |
| Localized Trace Necking | 20 percent width reduction over 1 mm | +17.6 | -16.5 | +9.40 |
| Substrate Resin Voiding | 15 micrometer dielectric air pocket | +0.4 | -8.9 | +2.30 |
| Side-Wall Mousebite | 30 micrometer semi-circular edge notch | +12.1 | -2.3 | +4.15 |
Because broader traces lower inductance, incorporating surface topology measurements into transmission line differential equations resolves localized skin effect losses accurately. Spatial discretized RLGC matrices map directly into circuit simulators without requiring excessive mesh density. Discontinuities shorter than one tenth of the signal rise time behave as discrete lumped elements rather than distributed transmission lines.
Reflections from narrow geometric discontinuities add coherently when defect spacing matches half the signal wavelength in the dielectric.

Stub
Signal energy scatters backward when propagating through physical discontinuities created by manufacturing errors. Converting geometric defects into executable circuit models involves mapping local electromagnetic fields into behavioral equivalent subcircuits. Lumped element models represent short physical anomalies through discrete series inductors and shunt capacitors arranged in symmetrical topology networks.
Lumped Discontinuity Equivalents
Localized trace narrowing behaves primarily as an inductive insertion, whereas trace width expansion acts as a capacitive load to ground. Mousebites along trace edges concentrate current, increasing resistance alongside inductance. Field solvers determine element values by integrating stored magnetic and electric field energy differences between ideal and modified geometries.

Behavioral S Parameter Synthesis
Broadband behavioral models utilize Touchstone data files generated from three-dimensional full-wave simulation of physical defect geometries. Frequency-dependent scattering parameters capture higher-order modal conversions and radiation losses above ten gigahertz. Cascading these defect block matrices between ideal transmission line segments enables fast channel simulation without full electromagnetic re-simulation of entire printed circuit boards.
- Physical Dimension Capture Optical or micro-CT scanning records defect profile coordinates down to sub-micron accuracy.
- Cross-Sectional Mesh Generation Finite element boundary condition files map spatial variance along the longitudinal propagation vector.
- Per-Unit-Length Extraction Telegrapher parameter matrices populate localized transmission line segments within circuit simulators.
- Subcircuit Cascading Lumped reactive T-network elements combine with unperturbed line sections to yield S-parameter cascades.
- Time-Domain Verification Simulated TDR step response matches time-domain reflectometer measurement curves before release.
Plane splits underlying signal traces interrupt return current paths, introducing loop inductance that functions as a stub discontinuity. Return current diverts around copper voids, coupling noise into adjacent interconnects. Modeling this defect demands adding mutual inductive terms to the spatial RLGC matrices.
IPC 2221A section 6.2 mandates trace width tolerances of plus or minus fifteen percent, below which fabrication lots trigger formal quality non-conformance reviews.
Omission of localized plane-split loop inductance from high-speed channel models causes false pass results in pre-silicon timing closure, forcing unbudgeted board re-spin cycles.


Waveform
Time-domain reflectometry maps impedance variations along physical transmission lines by analyzing reflected voltage steps. A high-bandwidth oscilloscope sends a fast rise-time pulse down the interconnect. Geometric modifications reflect voltage portions proportional to local impedance mismatches.
Positive voltage peaks identify inductive bottlenecks caused by trace necking, while negative dips pinpoint capacitive loading from excess copper deposition.

Could High Frequency Loss Models Predict Weave Shifts?
Because glass bundles deflect fields, inhomogeneous dielectric distributions resulting from glass fiber weave patterns alter local wave velocity and impedance periodically. Standard uniform loss models underpredict phase jitter when signals traverse alternating resin-rich and glass-rich zones. Coupling spatial weave variations into high-frequency attenuation equations requires multi-dielectric field solver modeling.
While reflection metrics determine pass limits, inter-symbol interference escalates when multiple physical trace defects generate complex secondary reflection cascades within high-speed channels. Differential channels operating at fifty-six gigabaud PAM4 signal rates demonstrate severe eye height closure when trace geometry defects induce deterministic jitter.
| Defect Condition | Reflection Coefficient (Gamma) | Total Jitter Penalty (ps) | Eye Height Loss (%) | Eye Width Loss (%) |
|---|---|---|---|---|
| Baseline Nominal Trace | 0.005 | 0.12 | 0.00 | 0.00 |
| Single Mousebite (25% width) | 0.042 | 1.85 | 6.20 | 4.10 |
| Dual Mousebites (Out of Phase) | 0.078 | 3.90 | 14.80 | 11.30 |
| Etch Neckdown (1.5 mm length) | 0.091 | 4.65 | 18.50 | 15.20 |
| Dielectric Void (20 um length) | 0.035 | 1.40 | 4.90 | 3.50 |
Time-domain transmissometry measures the forward transmitted pulse, revealing edge rate degradation caused by defect-induced dispersion. High-frequency signal harmonics attenuate rapidly when passing over localized side-wall roughness. Phase distortion shifts zero-crossing points, widening deterministic jitter bands beyond receiver equalization limits.
Impedance discontinuities exceeding five percent cause measurable eye height degradation in PAM4 signals operating above fifty-six gigabaud.
High-frequency phase noise is frequently attributed to environmental humidity fluctuations rather than variations in glass weave bundle density.


Bench
Vector network analyzers collect multi-port scattering parameters across multi-gigahertz frequency spans to validate physical defect models. Measuring raw trace performance requires isolating test fixture contributions from the device under test. Coaxial connector launches, probe pads, and lead-in microstrip traces introduce parasitic reactances that distort physical defect signatures if left uncorrected.

De-Embedding Methodology and Fixture Removal
De-embedding algorithms strip fixture parasitic effects from measured raw S-parameters. The 2x-Thru calibration method utilizes an unpopulated calibration structure to compute the ABCD matrix of input and output launch paths. Subtracting fixture matrices isolates the intrinsic scattering parameters of the modified trace segment.
Vector error correction removes system directivity, crosstalk, and tracking errors before mathematical extraction of per-unit-length RLGC parameters.

Test Coupon Architecture
Dedicated fabrication test coupons placed on panel margins provide physical samples for process validation. Inspection coupons feature deliberate geometric modifications, including micro-voids, necked traces, and variable etch factors. Micro-sectioning coupons verify cross-sectional dimensions via optical microscopy, providing ground-truth measurements to validate field solver calculations.
- Launch Misalignment Coaxial connector transitions inject unaccounted capacitive stubs that mask physical trace defect reflections.
- Copper Roughness Overestimation Applying static Hammerstad models to modified trace edges inflates high-frequency attenuation figures artificially.
- Dielectric Anisotropy Neglect Ignoring z-axis permittivity shifts in thin core laminates skews propagation delay calculations during TDR correlation.
- Uncalibrated Probe Contact Varying ground spring pressure during wafer probing introduces variable contact inductance into S-parameter measurements.
| Standard Designation | Primary Test Target | Frequency Limit | De-Embedding Required |
|---|---|---|---|
| IPC-TM-650 2.5.5.7 | Characteristic Impedance via TDR | 10 GHz | Optional |
| IPC-TM-650 2.5.5.12 | Relative Permittivity and Loss Tangent | 20 GHz | Yes |
| IEEE 370 Specification | Electrical Characterization of Interconnects | 50 GHz | Mandatory |
| IEC 61189-2-721 | High-Frequency Attenuation Measurement | 40 GHz | Yes |
Correlating measured broadband S-parameters with extracted defect models validates electromagnetic solver accuracy up to fifty gigahertz, provided mesh density is sufficient. High correlation ensures that system-level timing and noise simulations predict physical board performance accurately.
IEEE 370 Annex B specifies test fixture de-embedding criteria that reject S-parameter models showing non-causal impulse responses exceeding zero point five picoseconds.


Tolerance
Contracting module development or turnkey printed circuit board assembly requires explicit boundaries on acceptable trace modifications. Fabrication tolerances directly govern signal integrity risk, dictating yield limits and component replacement liabilities. Design transfer packages must define clear physical parameters paired with tight tolerance enforcement mechanisms to prevent sub-tier suppliers from delivering non-compliant hardware.

Design Transfer Dossier Requirements
Transferring a validated high-speed layout to an offshore volume factory moves design responsibility boundaries. The engineering transfer dossier must contain complete physical defect models alongside structural artwork files. Providing static Gerber artwork without underlying physical geometry constraints leaves high-speed lines vulnerable to fab-house process tuning that compromises high-frequency performance.

Commercial Risk Allocation
Factory tooling dictates etch precision, and engineering scope definitions allocate cost burdens when physical trace deviations cause functional test failures. Non-recurring engineering agreements specifying turnkey delivery must obligate the fabricator to verify impedance tolerances against extracted defect limits prior to volume laminate slicing.
- Native Layout Files Gerber X2 or IPC-2581 formatted layers containing explicit trace modification keep-out rules.
- Field Solver Scripts Automated extraction code mapping physical trace etch profiles to broad-band SPICE models.
- De-embedded Touchstone Files Measured baseline and defect S-parameter data sets stripped of test fixture parasitics.
- Acceptance Threshold Matrix Upper and lower impedance boundaries paired with explicit yield penalty cost adjustments.
Broadening acceptable trace width variations from five percent to fifteen percent reduces fabricator scraping costs, dropping unit prices at the expense of system timing margin. The buyer evaluates this cost differential against the engineering hours needed to implement adaptive equalization on host silicon receivers. Defining precise physical trace modification models secures product reliability while maintaining strict control over manufacturing cost trade-offs.