Quantifying Production Line Tooling Calibration Drift and Stoppage Costs
Tooling drift costs combine line stoppage labor, scrapped assemblies, and re-qualification fees, demanding automated inline sensor verification.

Wear
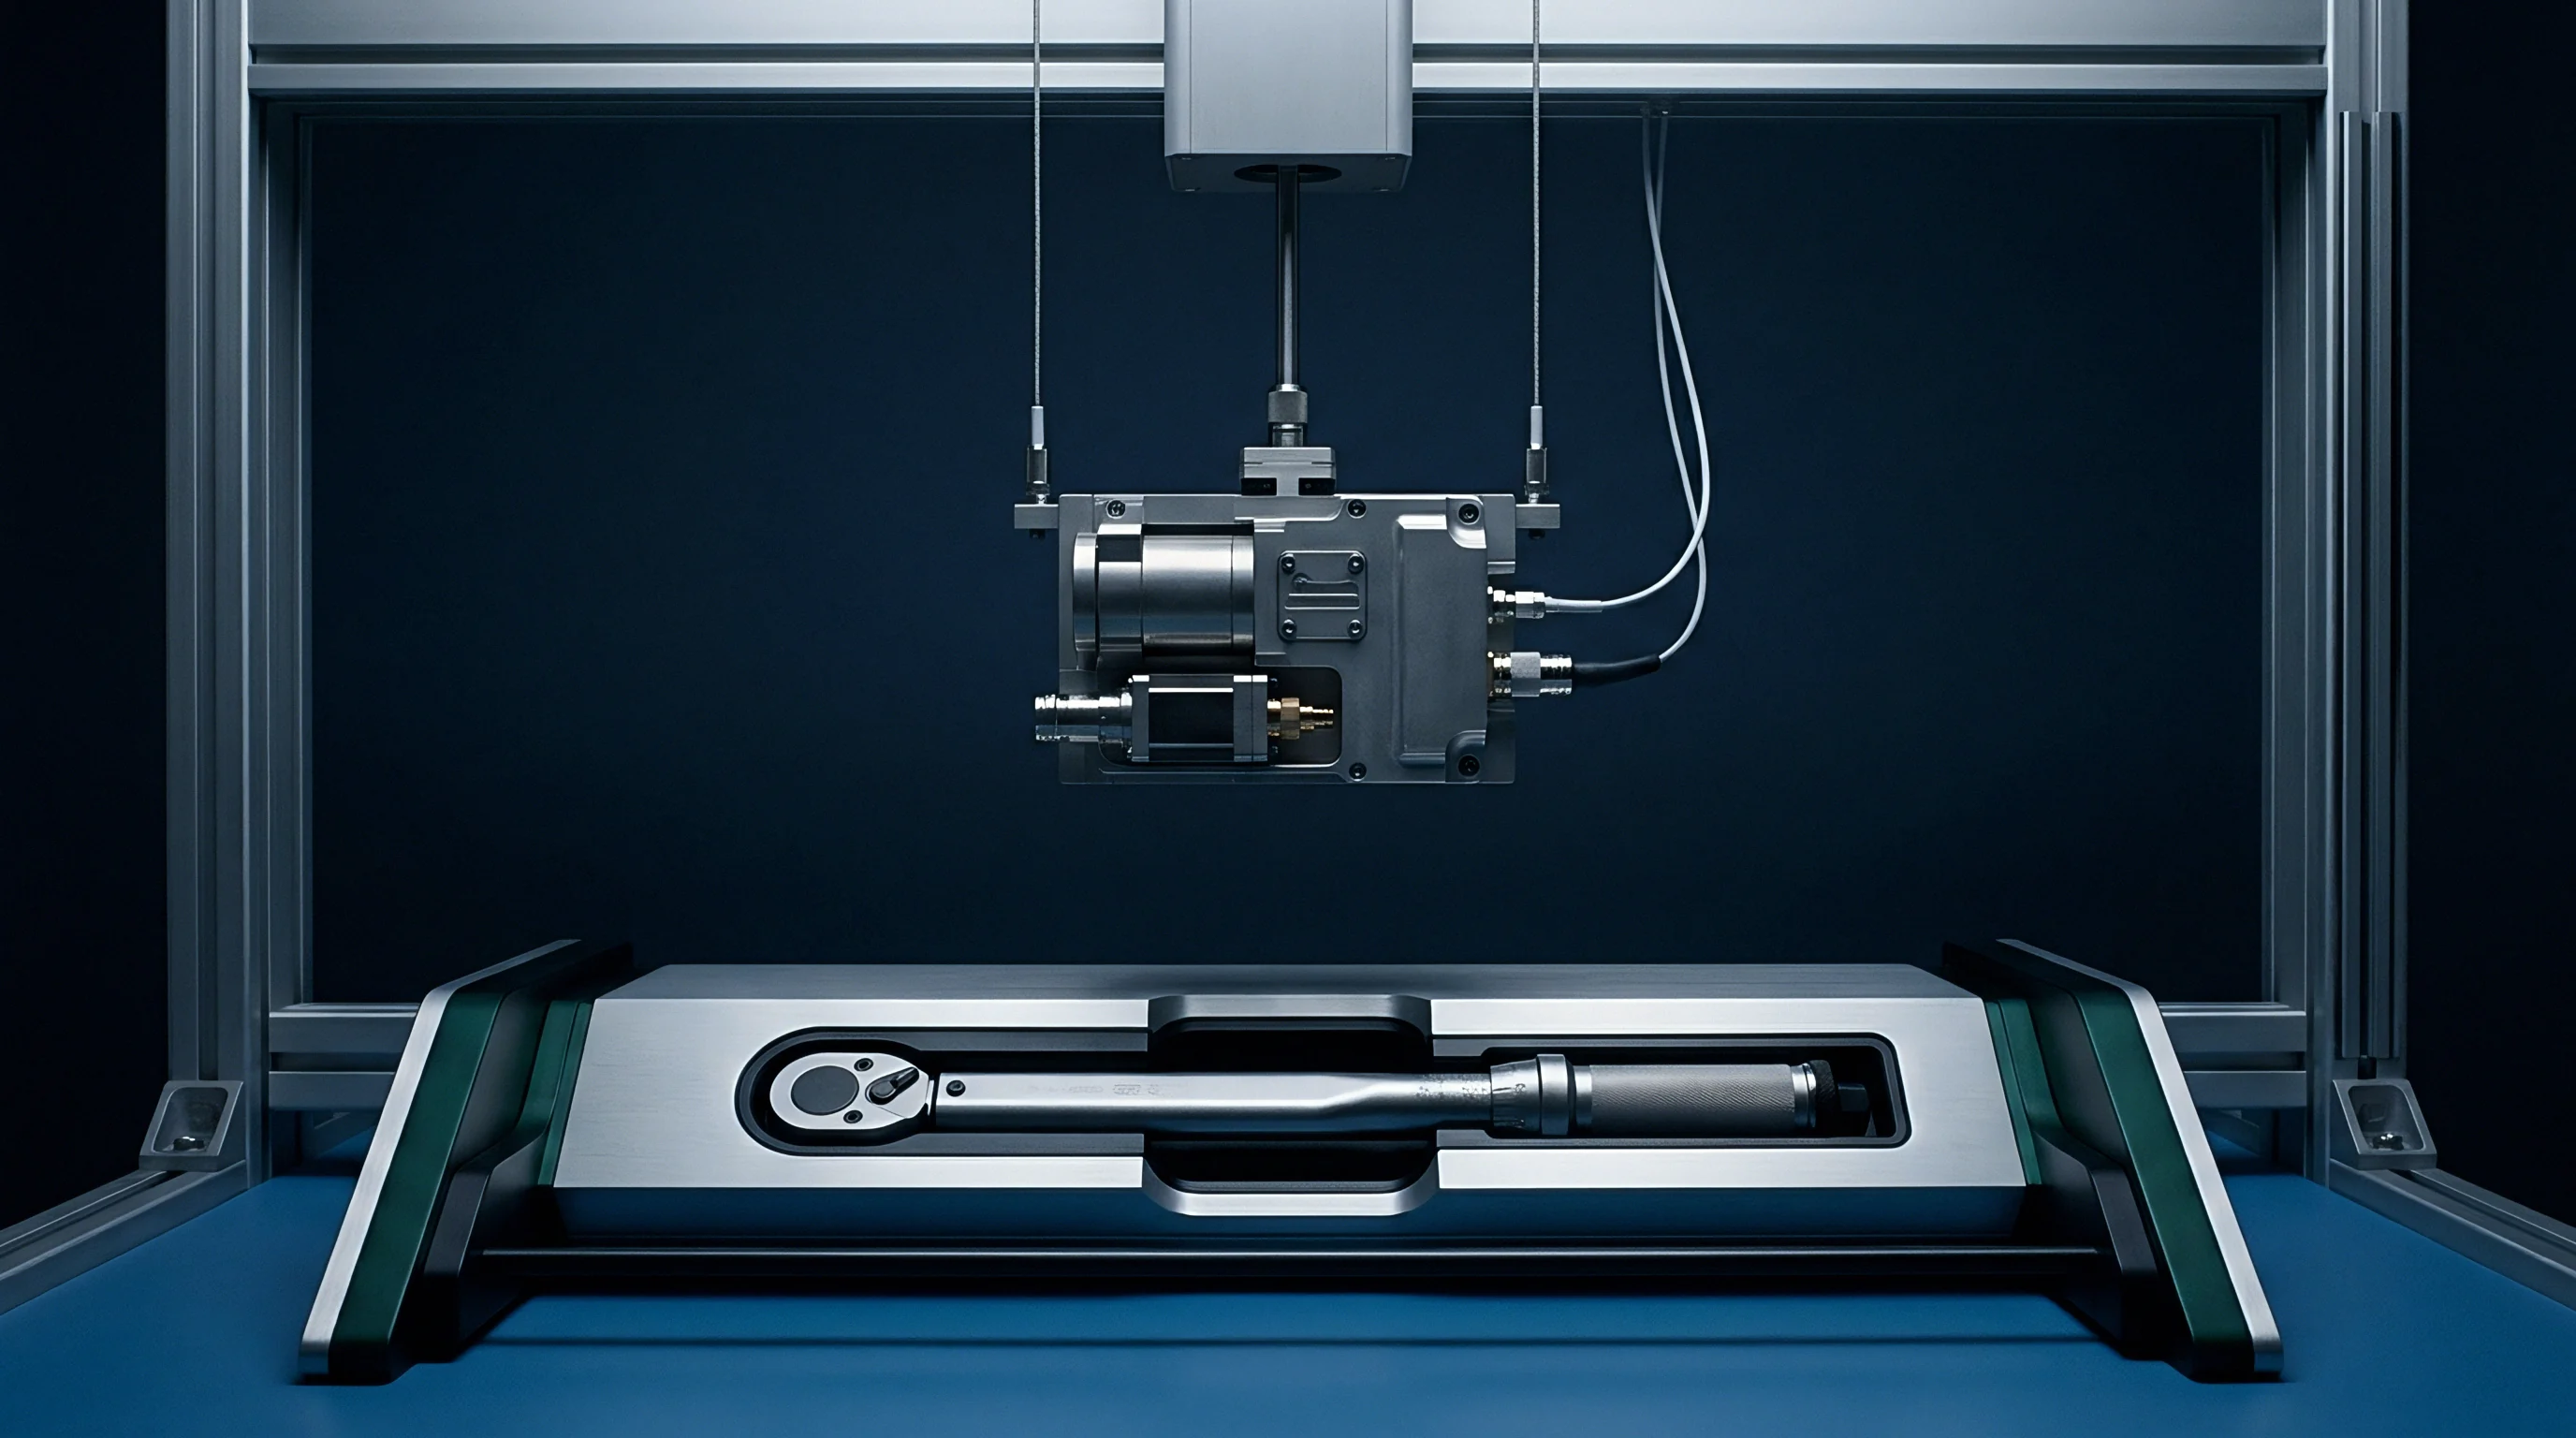
Precision micro-assembly fixtures, pneumatic insertion actuators, and automated torque heads lose dimensional accuracy from cumulative mechanical stress and thermal loading. In automated production environments, mechanical contact surfaces endure constant micro-abrasion, cyclic impact forces, and temperature swings. These forces shift critical reference baselines well before any physical damage shows on the equipment exterior.
Kinetics of Mechanical Degradation
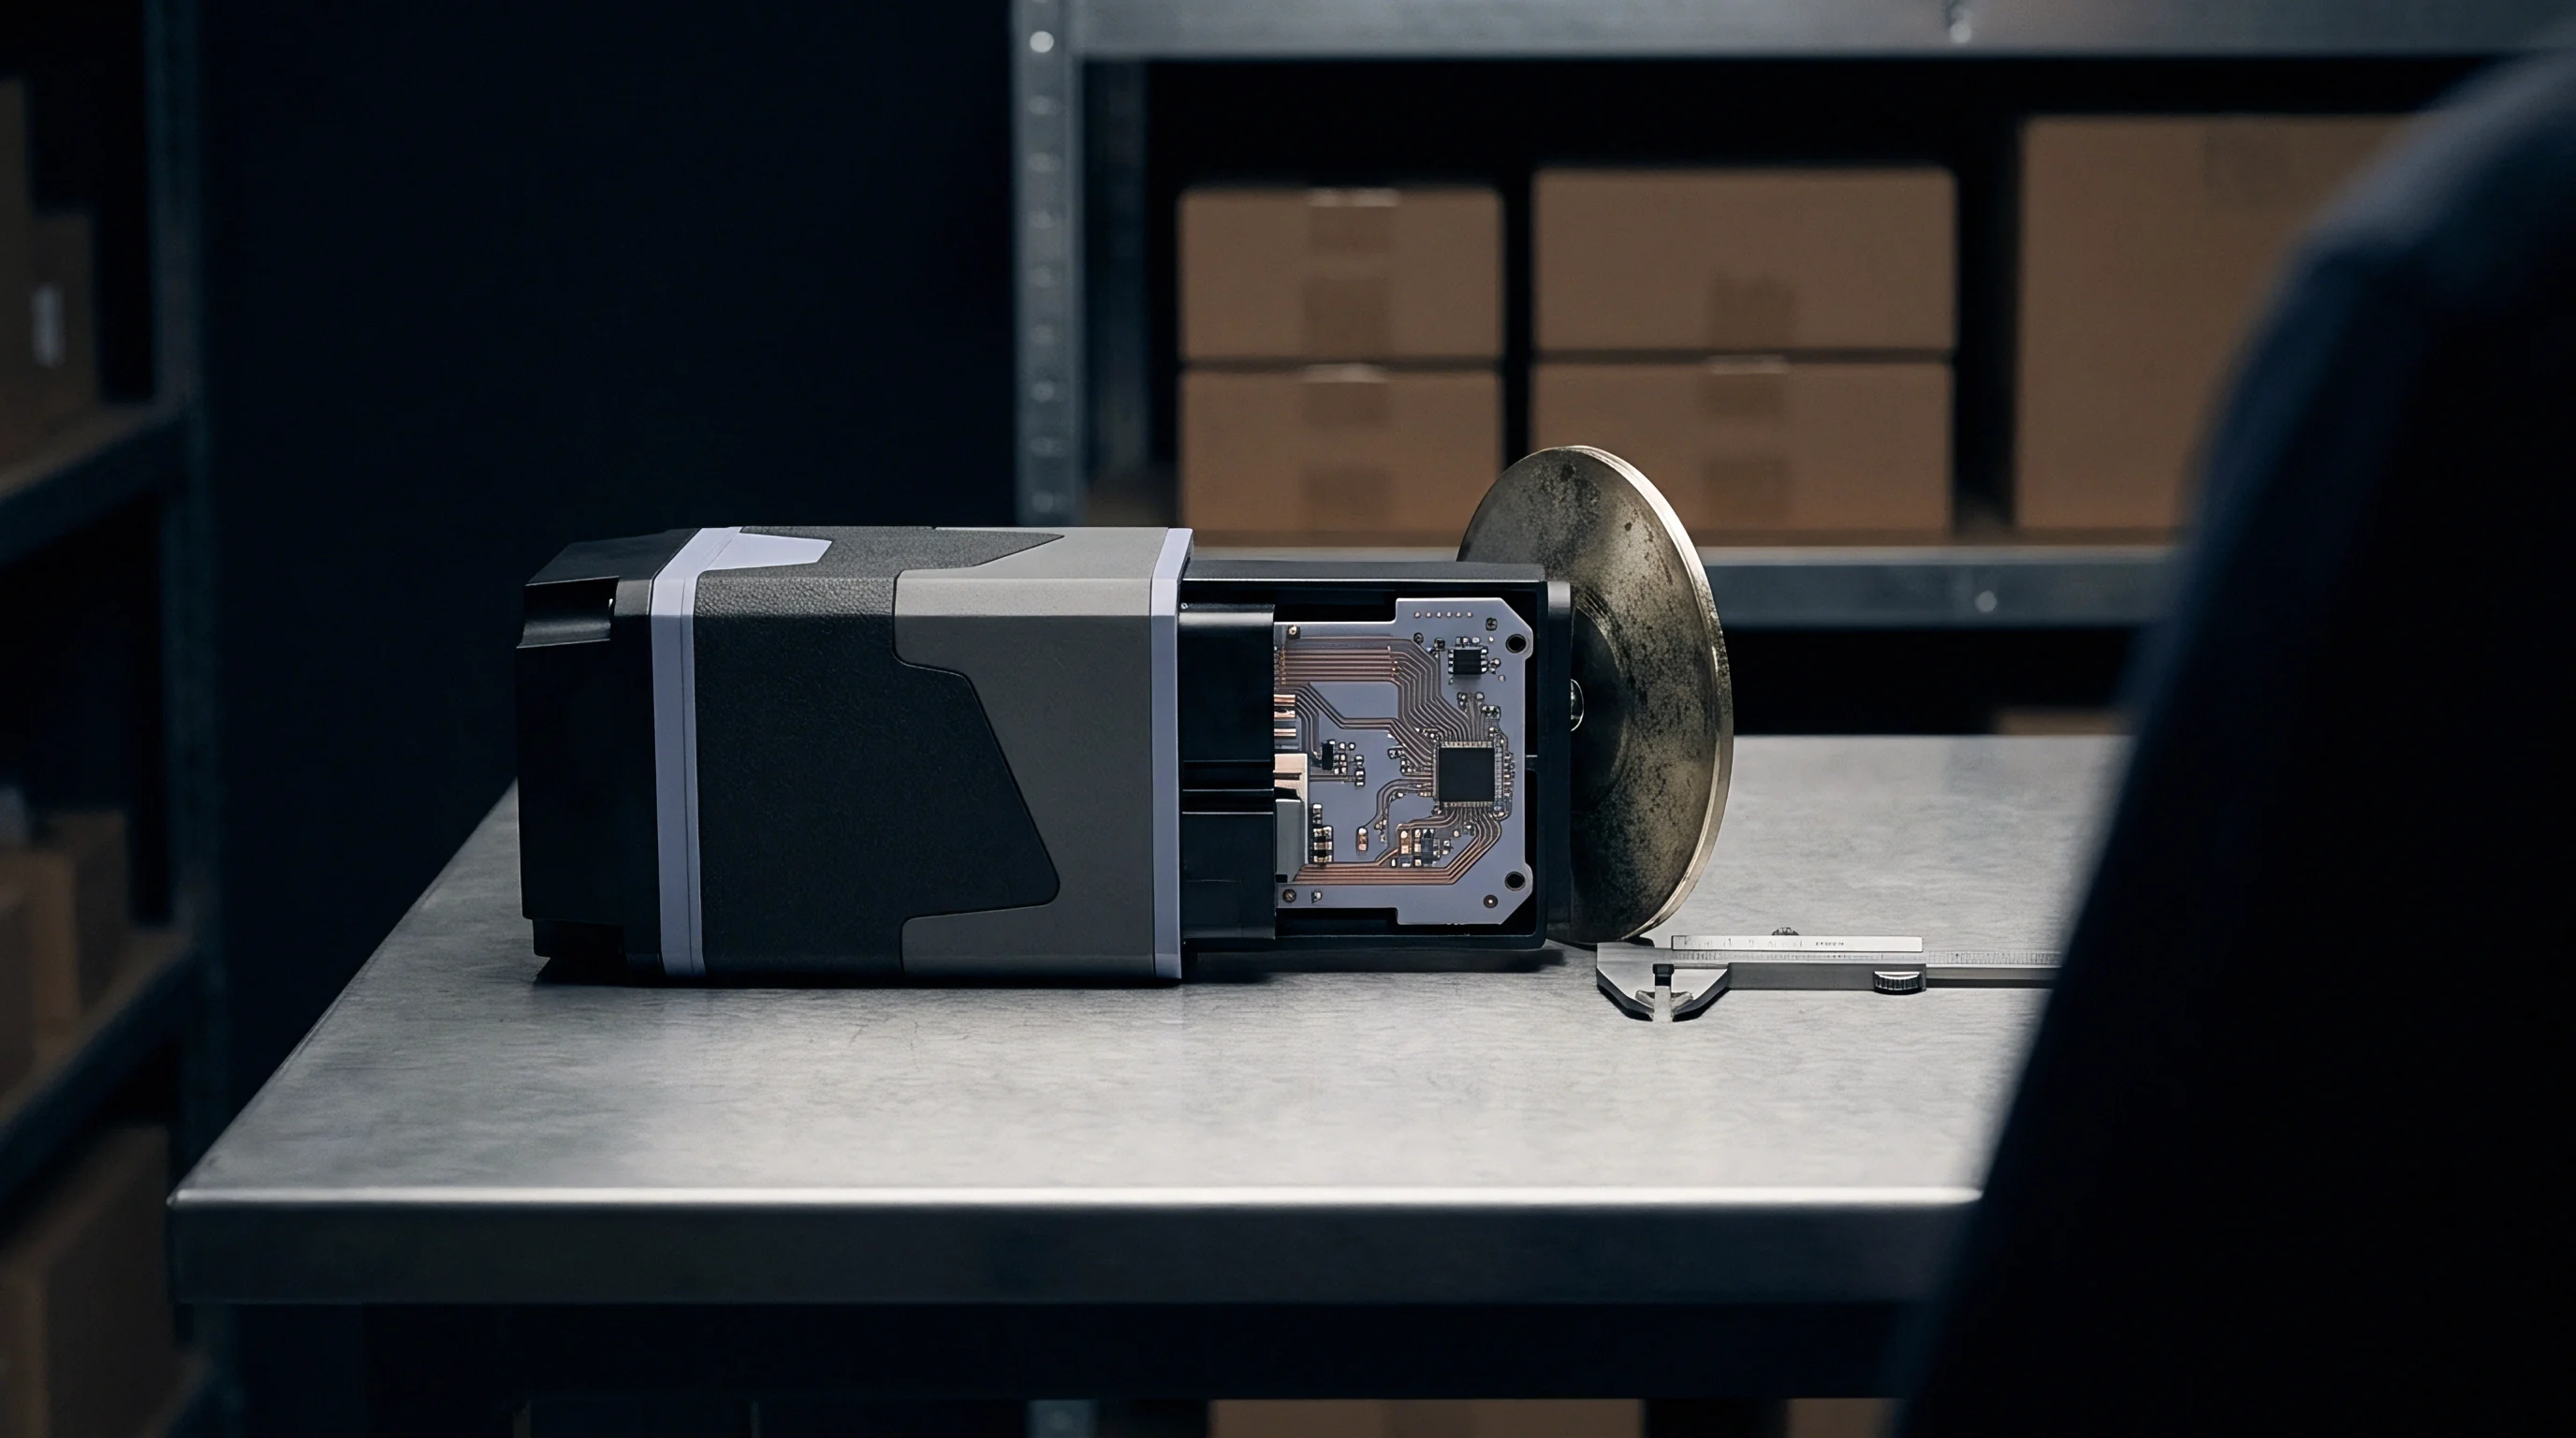
During repeated clamping operations, contact surfaces undergo continuous frictional displacement, stripping microscopic amounts of material from registration pins. Over tens of thousands of cycles, this localized wear opens up alignment tolerances from original micron-level specs to gross positioning errors, misaligning automated end-effectors with target circuit substrates.
Uncalibrated insertion force leads directly to non-visible micro-cracks inside multi-layer circuit boards during press-fit operations.
Thermal expansion during high-speed production runs compounds this mechanical wear. Friction heats contact points, creating temporary dimensional growth that vanishes once machinery sits idle. As a result, tooling calibrated only during cold, static maintenance shifts drifts unmonitored once the line reaches full operating speed.

Secondary Mechanisms in Automated Fixtures
In pneumatic pressure regulators, diaphragms stiffen after repeated cycling, shifting insertion forces without triggering sensor fault thresholds. Misalignment between pneumatic drive shafts and mechanical guide rails creates asymmetric loading across guide bushings, accelerating localized wear on critical guiding surfaces.
- Pneumatic Actuator Drift occurs when internal seal friction increases over time, altering the terminal impact force on delicate surface-mount connector housings.
- Linear Encoder Misalignment arises from thermal expansion differences between aluminum mounting brackets and glass scale sub-assemblies during extended production shifts.
- Torque Transducer Zero Shifting develops through strain gage material creep under continuous preload in high-speed automated fastener assembly operations.
- Locating Pin Ovalization stems from repeated shear forces during high-speed circuit panel positioning, creating progressive alignment play across multiple axes.
When locating pins develop rotational or axial play, automated placement systems drop fine-pitch surface-mount devices outside target pad boundaries. Misalignment during high-speed connector seating damages internal substrate traces, causing intermittent field failures that easily pass standard end-of-line functional tests.

Tolerance
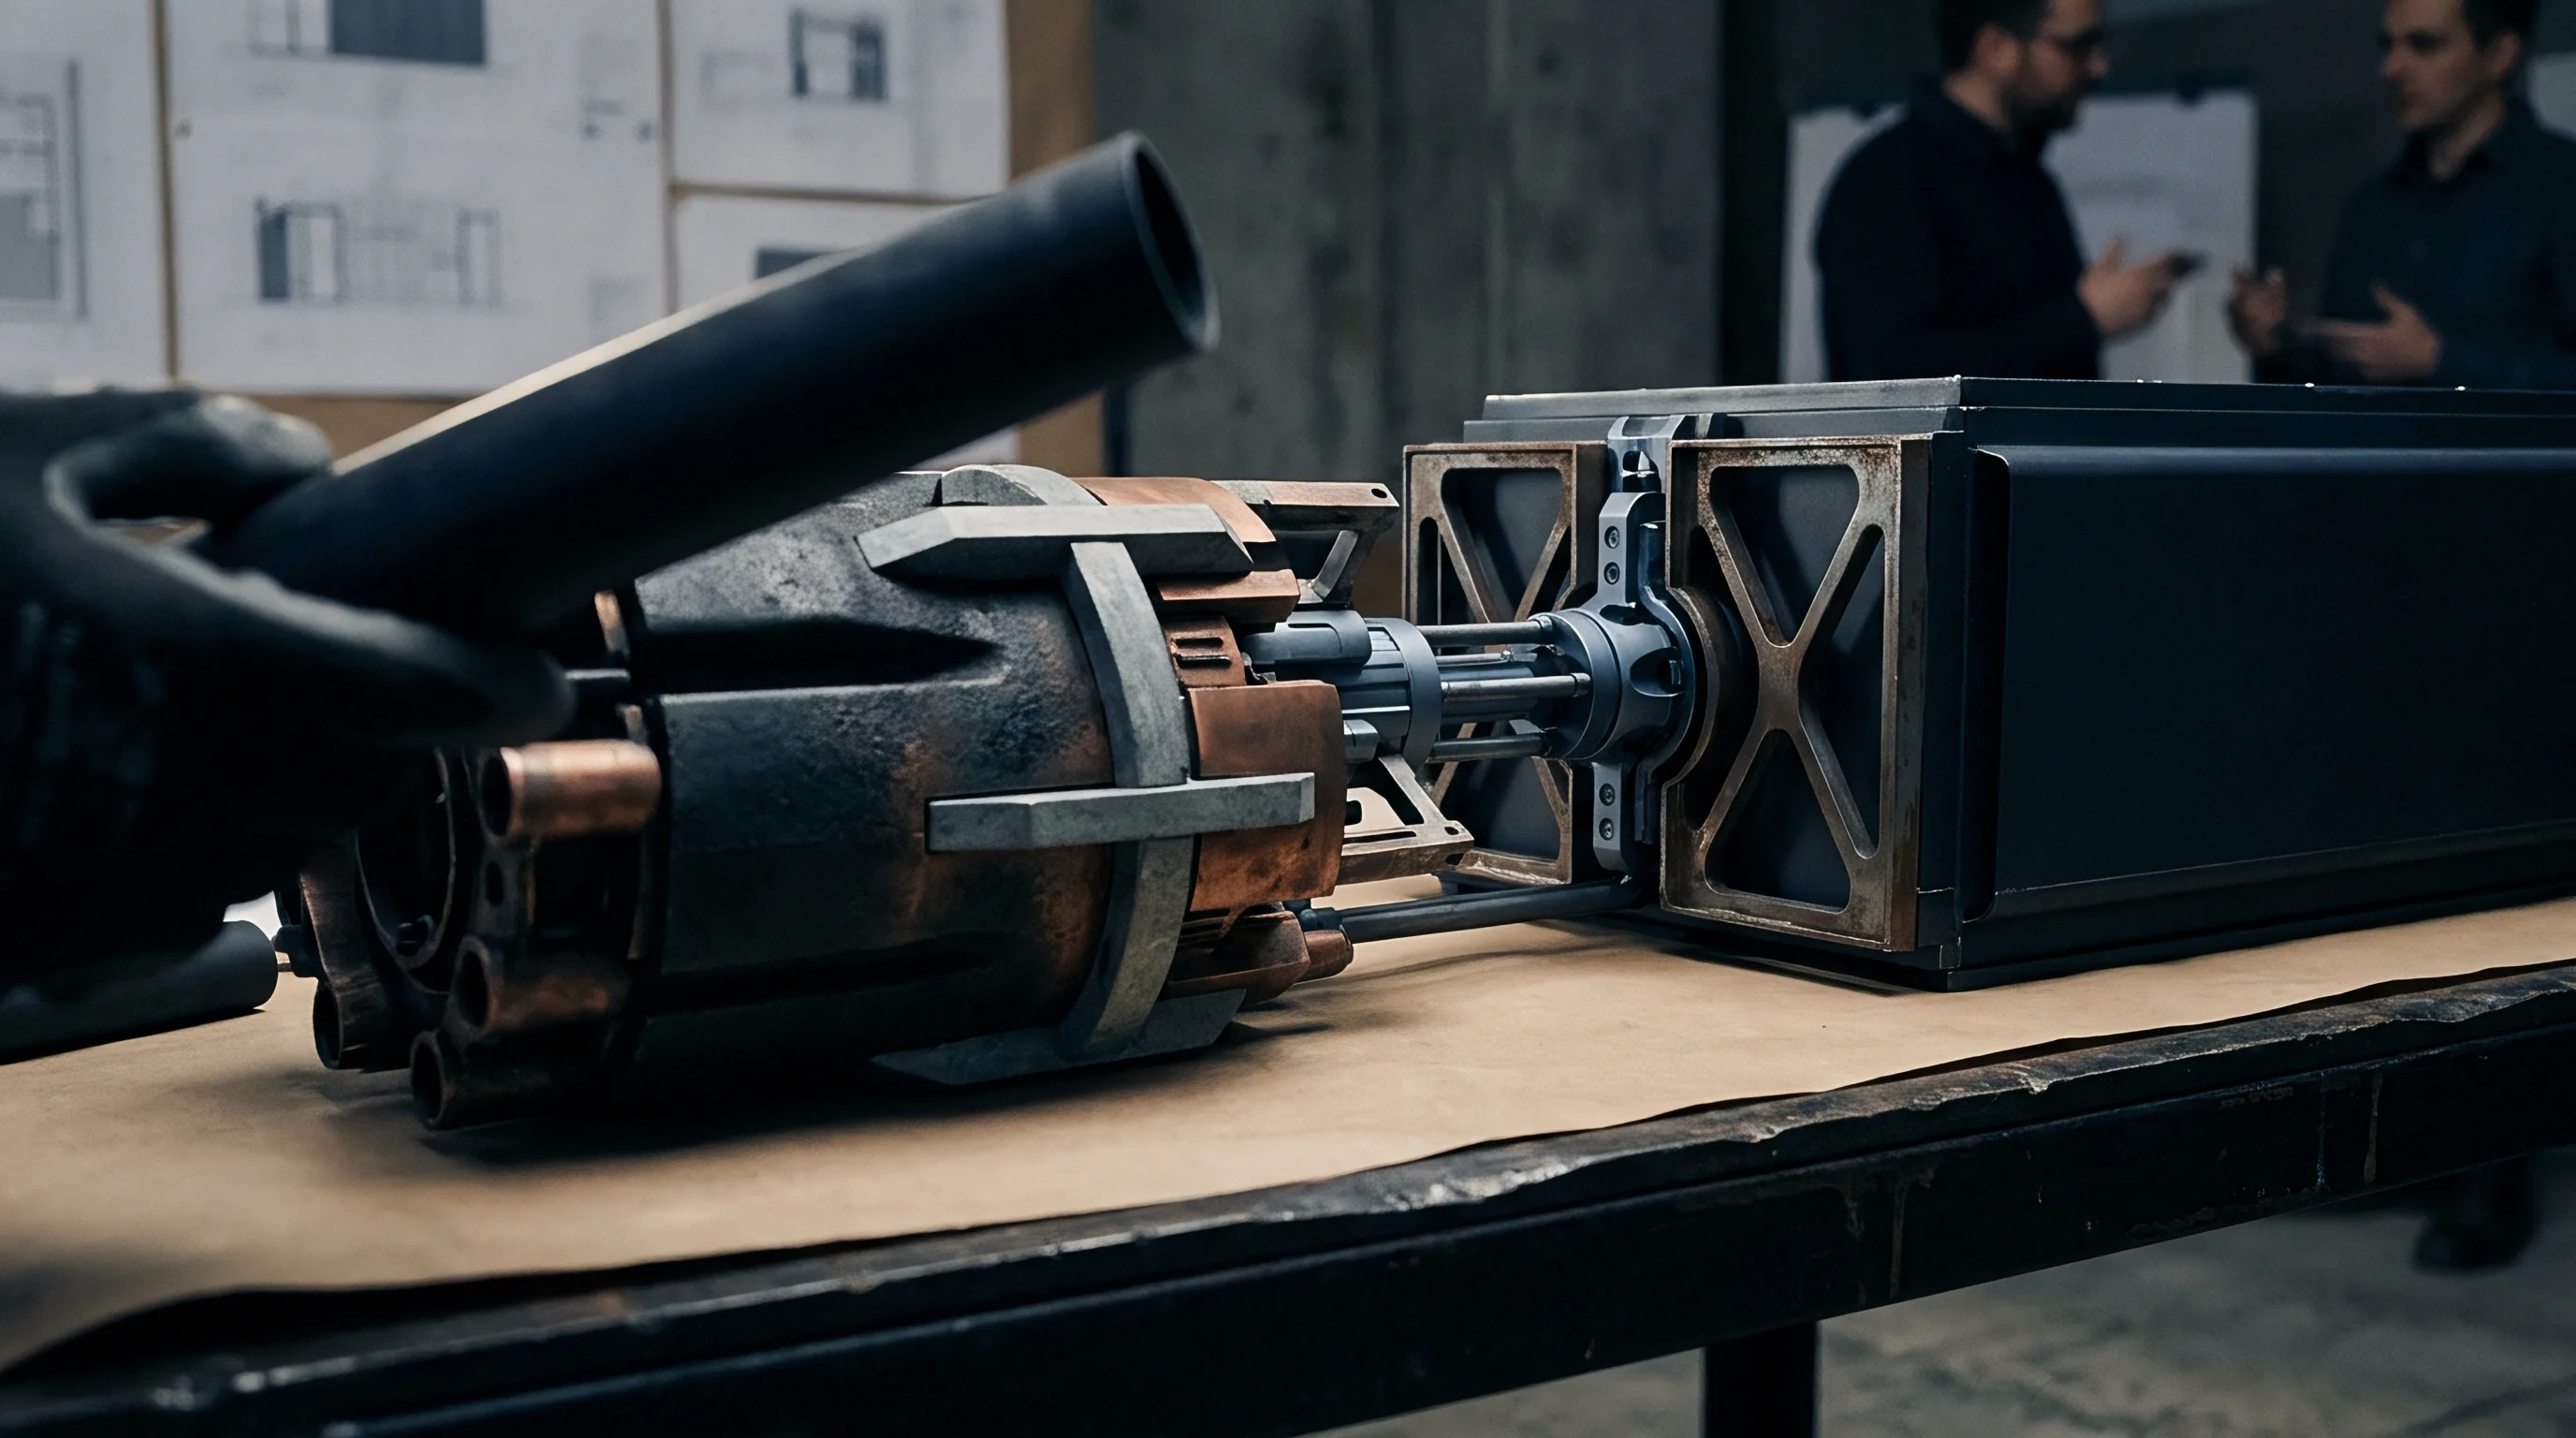
Statistical process control boundaries define allowable variance in mechanical dimensions before component interference degrades finished product quality. Tracking capability metrics across high-velocity assembly lines isolates fixture degradation well before catastrophic batch scrap events occur.

How Does Sensor Offset Mask Tool Wear?
Automated zeroing routines in optical sensors frequently absorb minor physical shifts as baseline offsets, hiding pin displacement until positioning fails. Software designed for routine part-to-part variation routinely masks mechanical fixture decay from line operators.
Once physical fixture displacement exceeds the maximum programmable adjustment window, automated assembly systems fault abruptly, halting the line without warning.
| Tooling Sub-Assembly | Primary Drift Mechanism | Calibration Decay Rate | Verification Frequency | Metrology Standard |
|---|---|---|---|---|
| Surface-Mount Pick Head | Nozzle O-ring fatigue and optical offset shift | 0.005 mm per 100,000 placements | Every 24 production hours | ISO 20783-2 |
| Servo Torque Screwdriver | Strain gage creep and clutch spring relaxation | 0.8 percent torque shift per 50,000 cycles | Weekly batch sampling | ISO 6789-2 |
| Dispensing Needle Positioner | Lead screw backlash and thermal expansion | 0.012 mm per 50 degrees Celsius rise | Per shift initialization | ASME B89.4.19 |
| Press-Fit Connector Actuator | Load cell zero drift and guide rod wear | 1.2 Newtons per 10,000 insertions | Every 5,000 cycles | ASTM E4-20 |
Statistical Limits and Real-Time Variance Detection
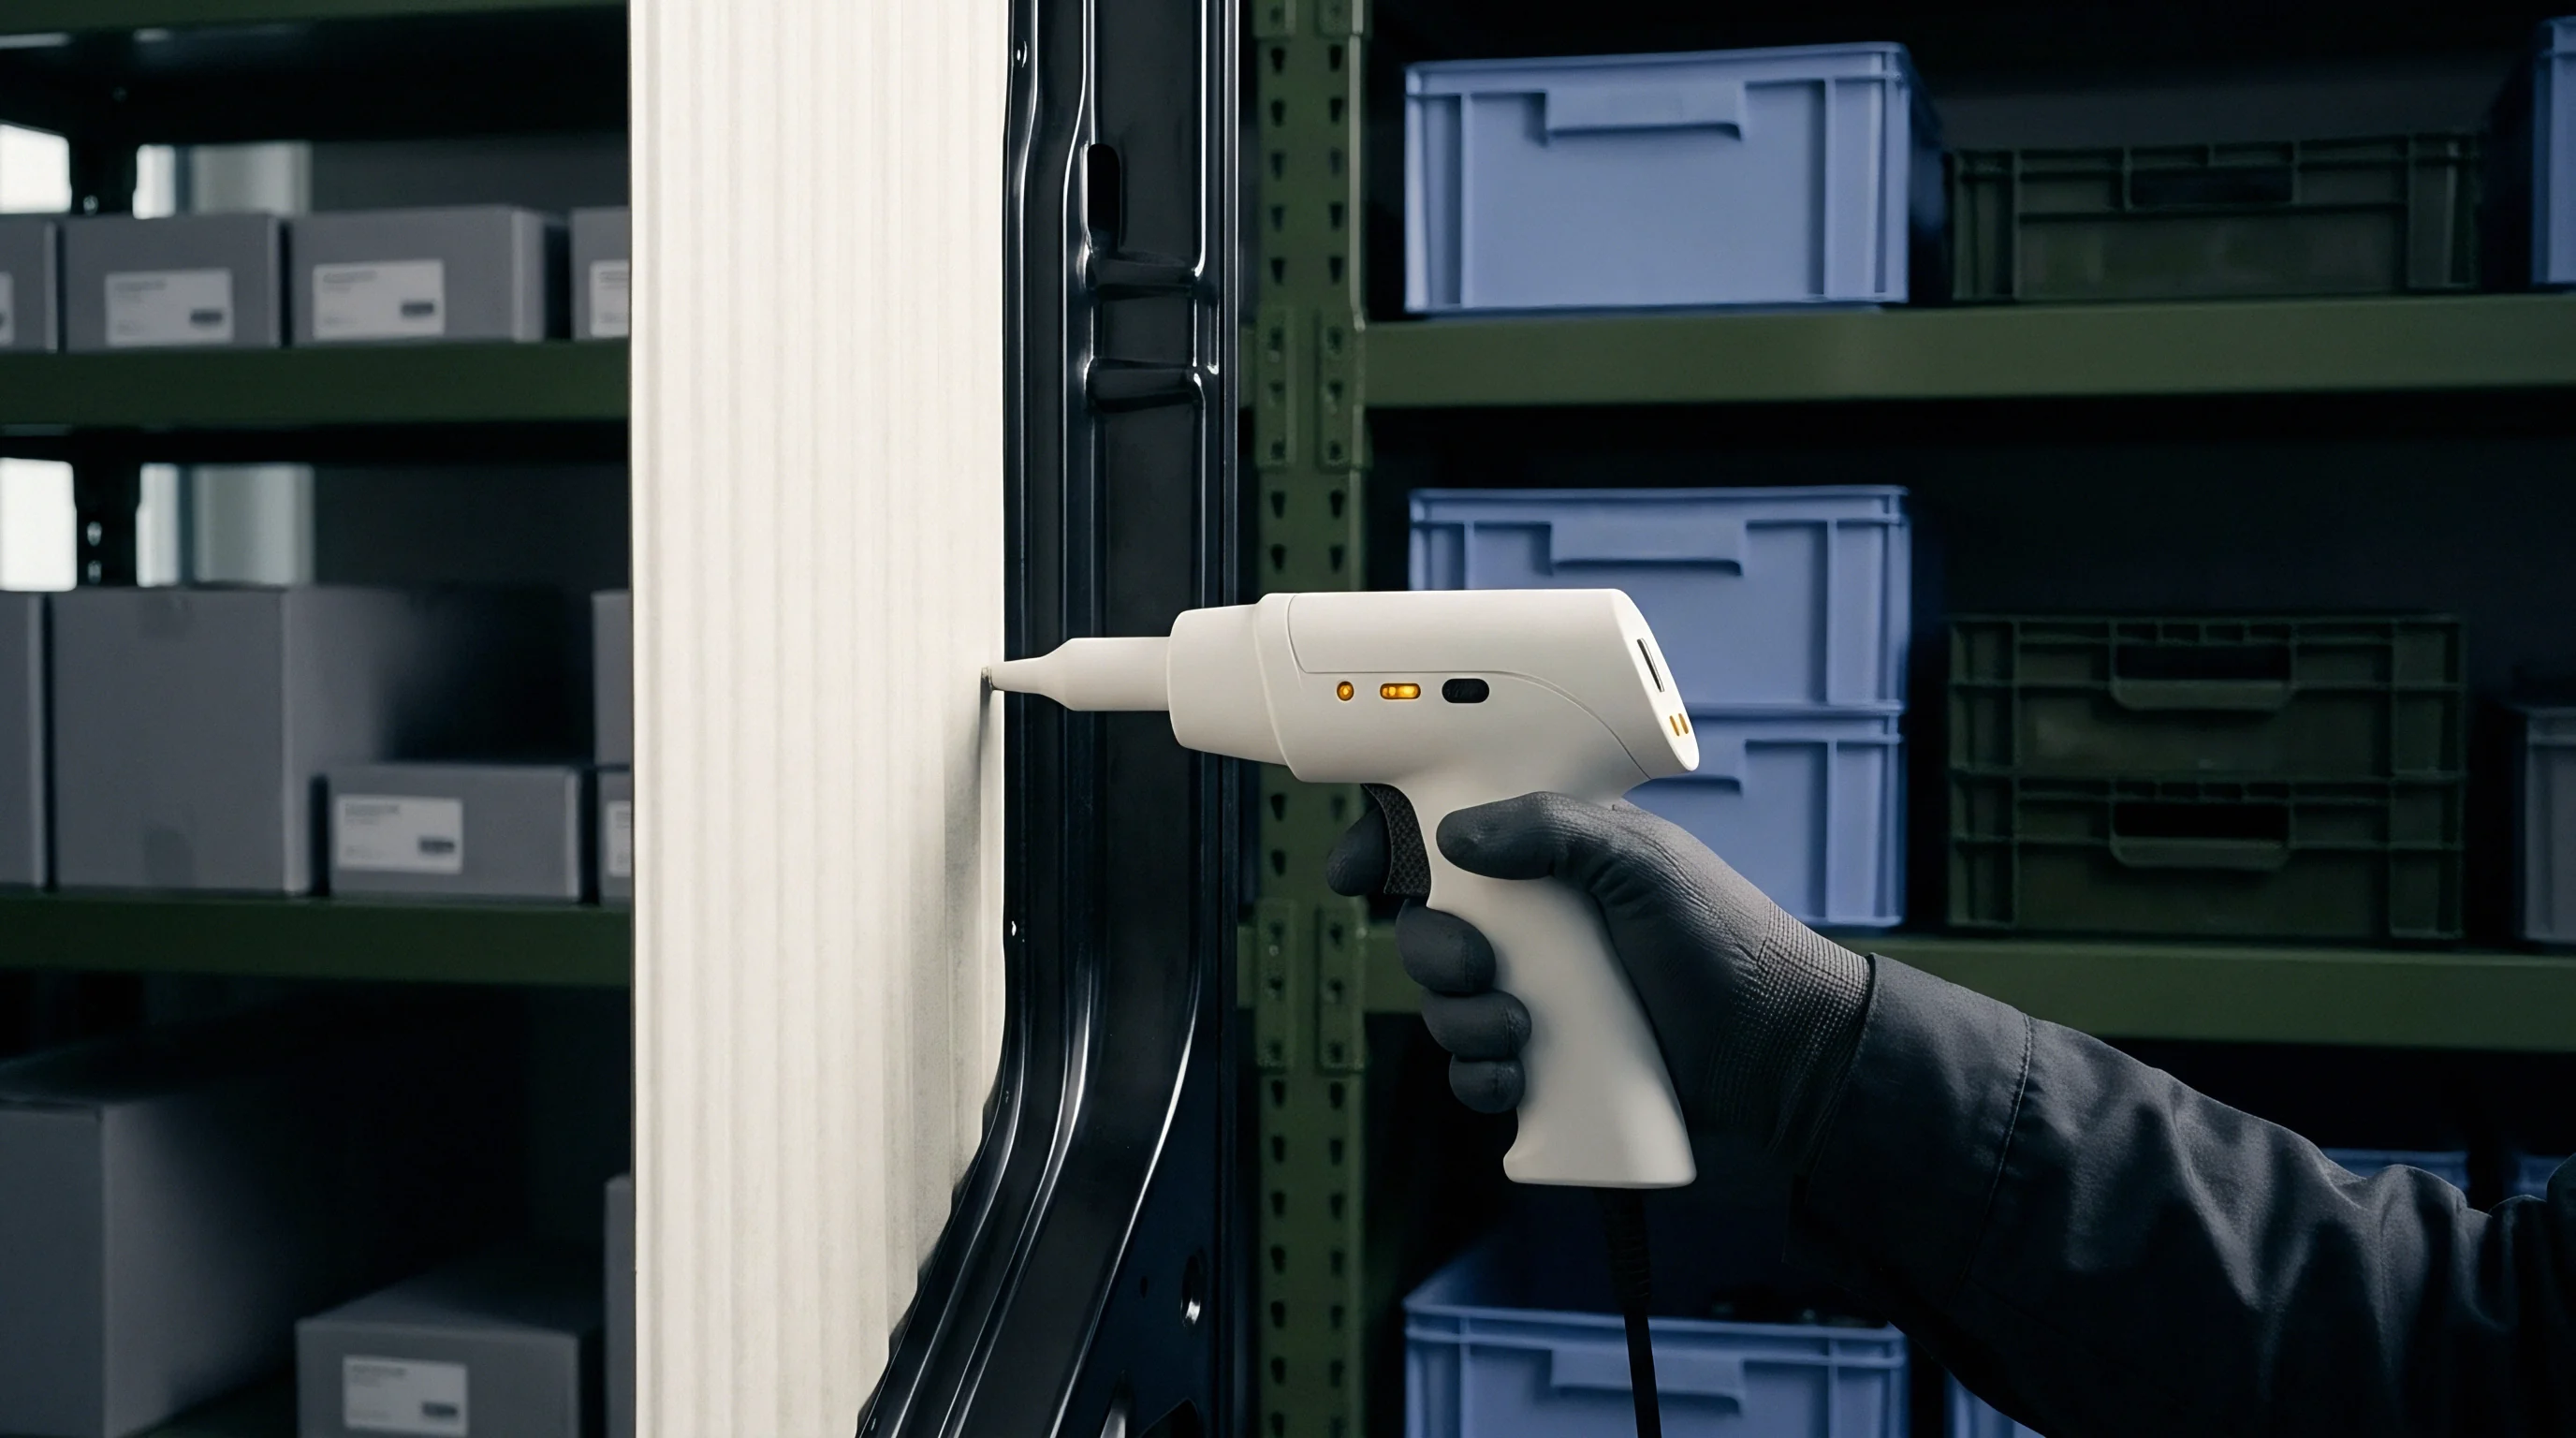
Process capability indices reflect continuous variance distribution; a declining value signals systematic mechanical shifts long before an absolute limit is breached. Calculating capability metrics at continuous intervals separates random material variations from fixture decay.
Compliance with ISO/IEC 17025 Section 6.4 obligates equipment operators to withdraw uncalibrated measuring devices immediately from active production lines.
When metrology data shows capability indices falling below target control thresholds, maintenance schedules require immediate fixture re-alignment. Standard ISO 10012 Clause 7.2 requires formal isolation of product processed through unverified equipment, forcing a full quarantine of suspect manufacturing lots.

Interruption
Unscheduled assembly line shutdowns trigger compound overhead expenses that far exceed the direct labor hours spent re-calibrating. Stoppage costs multiply quickly as downstream operations sit idle across the factory supply chain.

Direct Cost Structure of Line Halts
Idle line labor, engineering troubleshooting, and delayed batch completion account for most immediate financial losses during unexpected machinery shutdowns. Specialized engineers diagnosing misaligned fixtures charge high hourly rates while pulled away from scheduled product development tasks.
Component scrap rates escalate during restart procedures. Re-aligning tooling on an idle line requires trial runs with active production components, consuming expensive raw materials during qualification testing.
True line stoppage cost equals direct maintenance expenses multiplied by factory overhead rates plus lost opportunity margin.
Purging and Line Clearance Requirements
Resuming production after fixture realignment requires completely clearing semi-processed assemblies to prevent mixed-quality batches. Quality assurance protocols mandate purging all work-in-progress inventory from the affected production segment over the estimated drift timeframe.
- Idle Operator Labor accumulates continuously while assembly technicians wait for maintenance personnel to clear mechanical errors and re-establish reference home positions.
- Scrapped Work in Progress includes assemblies partially joined during the initial out-of-spec detection threshold that cannot be non-destructively reworked.
- Re-Qualification Material Loss accounts for blank substrates and consumable fasteners destroyed during validation test runs following fixture mechanical adjustment.
- Schedule Disruption Penalties emerge when late delivery triggers contractual supply chain fines and expedited air freight charges to meet customer delivery dates.
Tooling drift is often treated as acceptable until total physical seizure occurs, even though minor dimensional shifts can ruin high-density SMT assemblies.
Derivation
Mathematical modeling of cumulative tooling drift gives factory accountants clear figures for balancing calibration intervals against downtime risk. Quantifying total financial impact requires combining scrap material costs, technician labor, and unrecovered factory overhead.
Quantifying Yield Loss and Stoppage Thresholds
Evaluating total financial impact involves summing scrap expenses, engineering re-calibration fees, and lost production capacity per hour. These calculations rely on clear baseline metrics across operational variables, with scrap costs incorporating raw component values, lost processing labor, and disposal fees.
Downtime cost models incorporate fixed facility depreciation alongside variable labor. Operating an automated surface-mount line incurs an average fixed overhead rate of four hundred fifty dollars per hour. Adding four operator labor positions at thirty-five dollars per hour yields a baseline idle expense of five hundred ninety dollars for every hour of unscheduled stoppage.

Step-by-Step Stoppage Cost Calculation Procedure
Determining the financial breakeven point between scheduled preventive alignment and an unscheduled shutdown follows a straightforward sequence.
- Calculate the average hourly operational cost of the assembly line including direct labor, facility overhead, and equipment depreciation.
- Measure the historical mean time between calibration failure and the average repair duration per incident.
- Multiply the total downtime hours by the hourly line cost to establish raw stoppage expenditure.
- Add the material value of scrapped components generated during the drift period prior to fault detection.
- Divide total financial risk by scheduled calibration cost to set the optimum maintenance cycle.
| Drift Acceleration Profile | Scrap Units Per Hour | Unplanned Downtime Hours | Scrap Material Expense | Total Stoppage Loss |
|---|---|---|---|---|
| Nominal (0.01 mm per 1,000 cycles) | 12 units | 1.5 hours | 840 USD | 1,725 USD |
| Moderate (0.03 mm per 1,000 cycles) | 45 units | 3.8 hours | 3,150 USD | 5,391 USD |
| Severe (0.08 mm per 1,000 cycles) | 180 units | 8.5 hours | 12,600 USD | 17,615 USD |
| Calculated using standard SMT line baseline: 590 USD hourly idle cost, 70 USD component unit value, 2,000 units per hour baseline throughput. | ||||
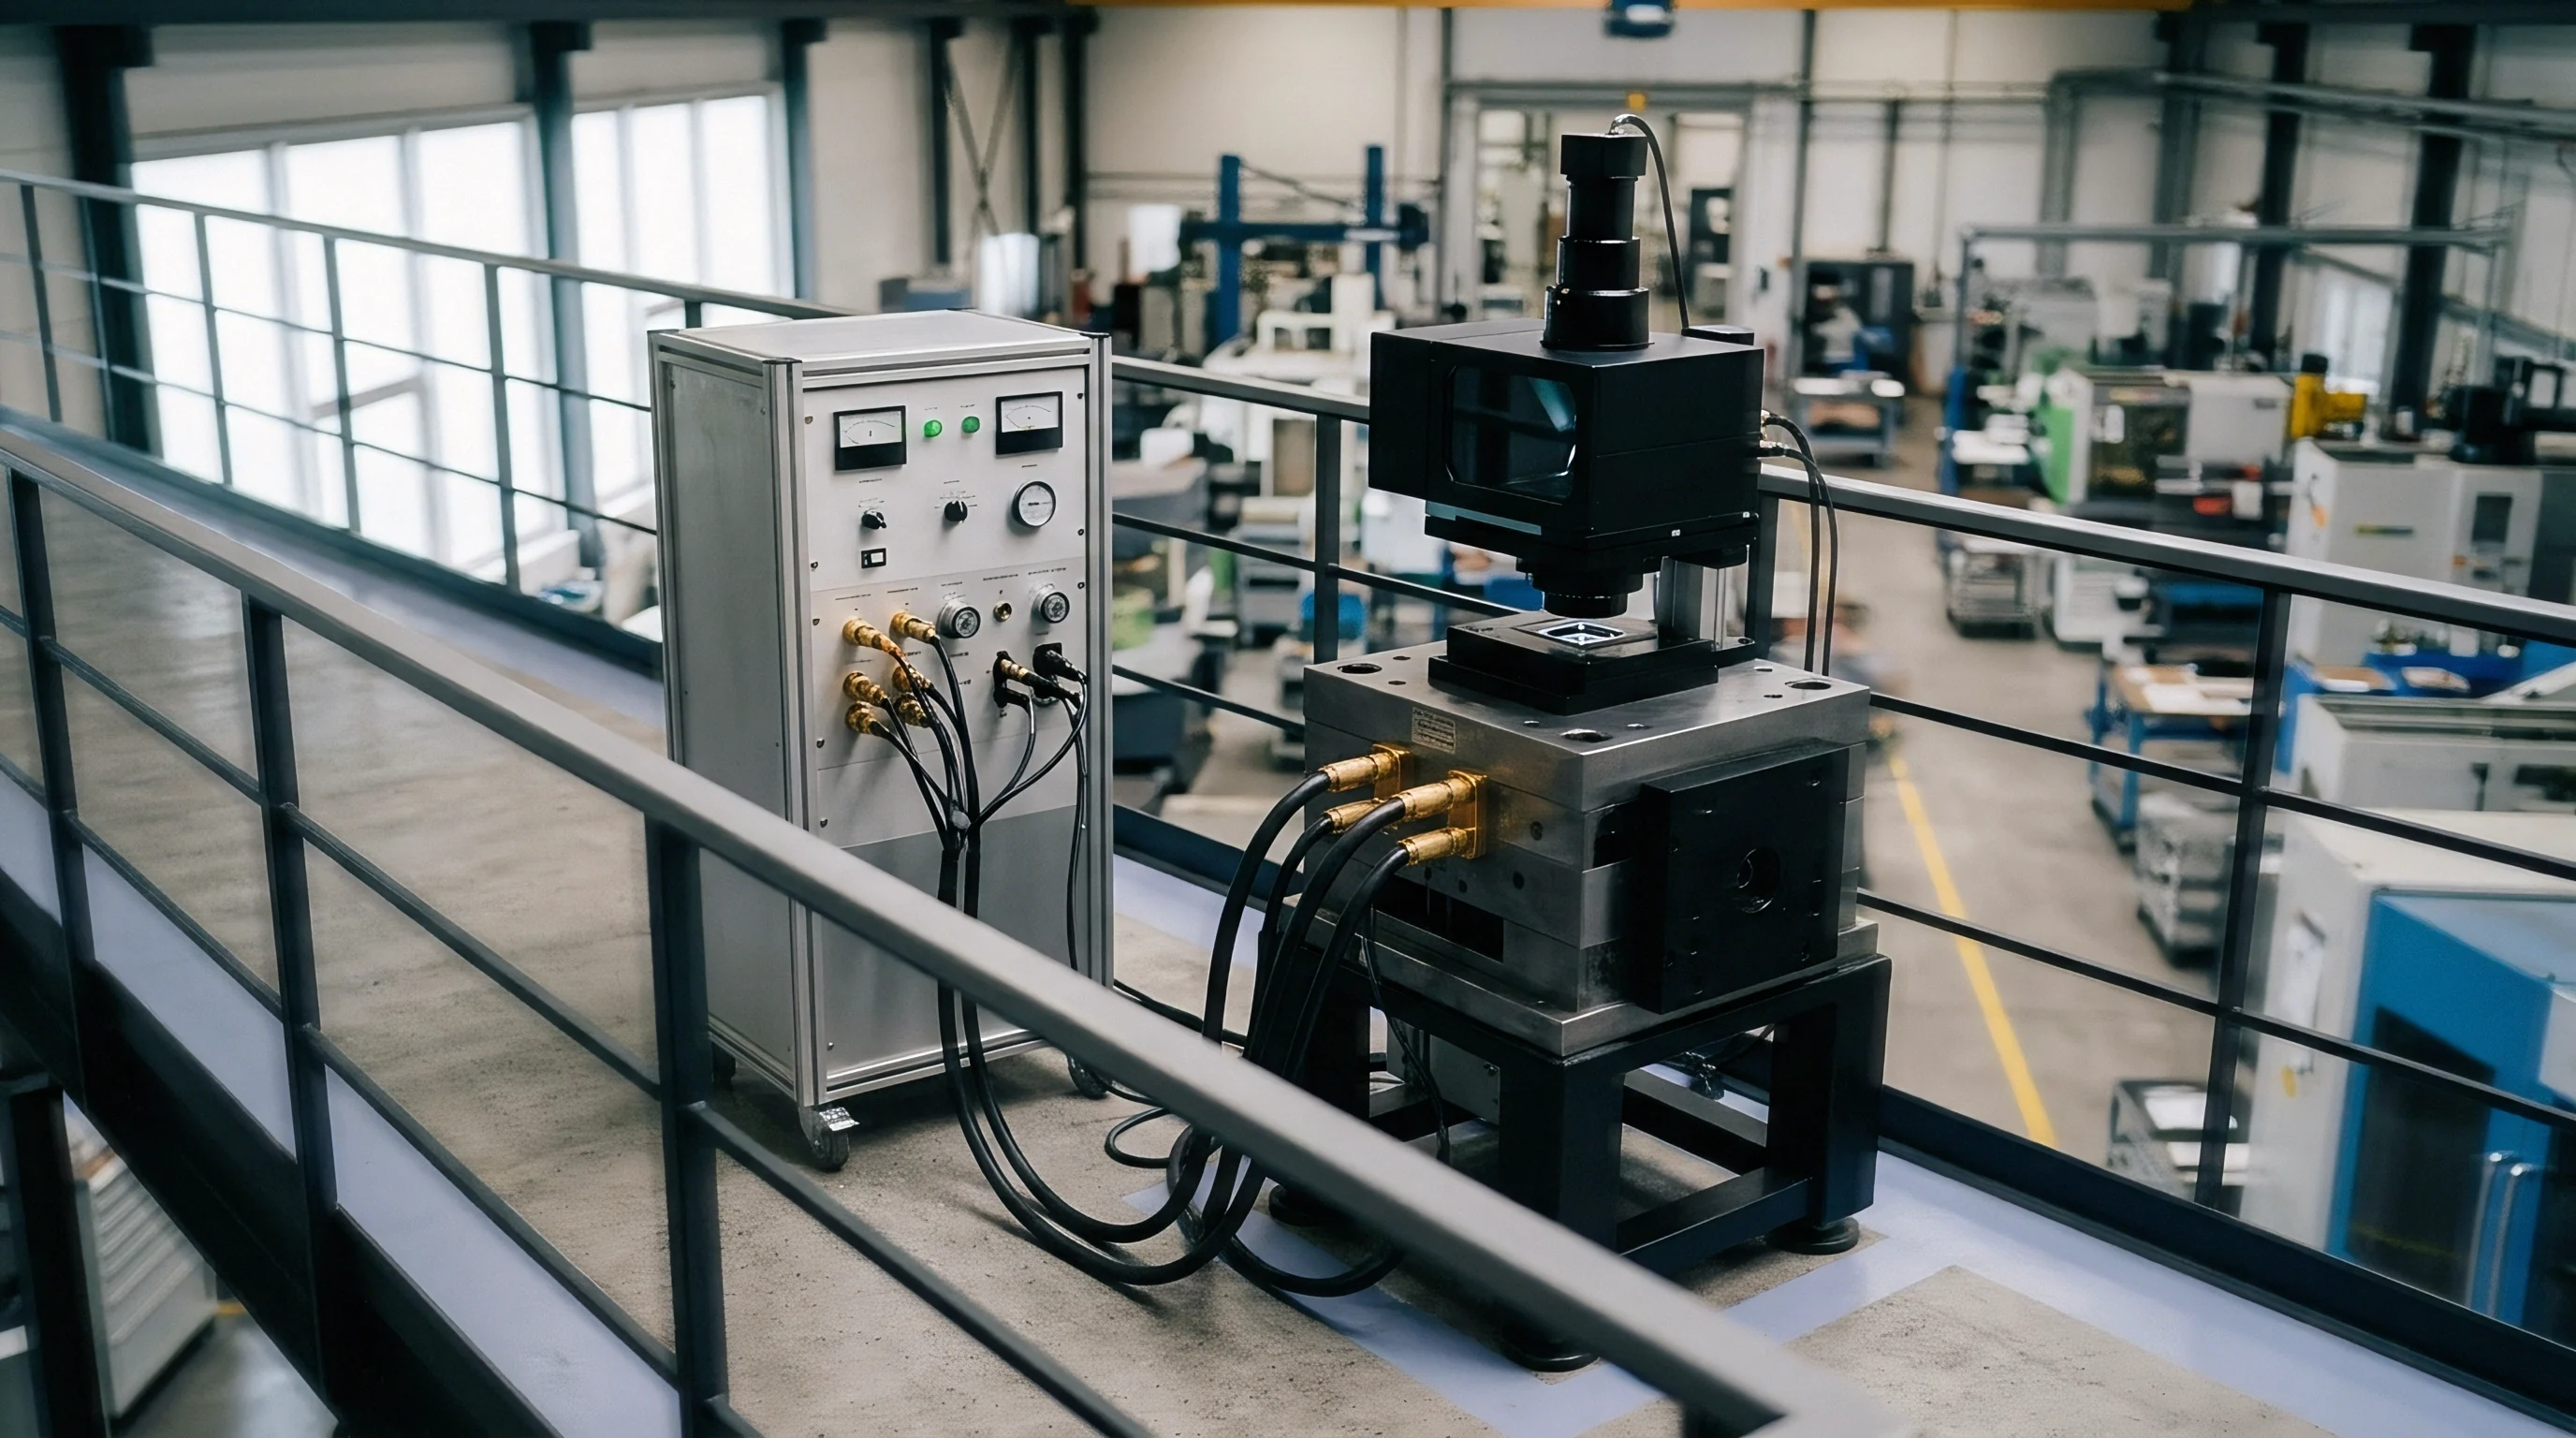
Factoring actual scrap counts alongside technician labor yields a predictable cost baseline that justifies installing automated inline laser displacement sensors across critical alignment fixtures.
Indemnity
Supply agreements allocate financial responsibility for calibration failures between contract manufacturers and tooling originators using maintenance logs. Detailed documentation shows whether dimensional shifts stemmed from normal wear or unapproved mechanical modifications.

Contractual Calibration SLAs and Maintenance Audits
Manufacturing contracts set mandatory calibration intervals alongside strict penalties for out-of-spec production caused by neglected maintenance schedules. Regular third-party audits verify that factory technicians adhere to sensor verification schedules specified by equipment suppliers.
| Calibration Defect Scope | Responsible Party | Verification Evidence | Commercial Remedy | Maximum Financial Cap |
|---|---|---|---|---|
| Sub-Assembly Misalignment | Contract Manufacturer | Machine maintenance logs | Batch rework at manufacturer cost | 50,000 USD per incident |
| Unscheduled Transducer Shift | Tooling Original Equipment Manufacturer | Metrology lab calibration cert | Component replacement plus NRE credit | Original tooling purchase value |
| Fixture Wear Beyond Limit | Contract Manufacturer | Cycle counter records | Scrap cost absorption | 100,000 USD per batch |
| Delayed Calibration Audit | Contract Manufacturer | Quality management audit log | Contractual SLA penalty fee | 10,000 USD per calendar day |
Resolving legal disputes relies on verifiable digital metrology records captured during active production runs. Unrecorded mechanical adjustments by line operators invalidate vendor tooling warranties immediately, shifting all scrap liability back to the plant operator.
Contract manufacturers incur liquidated damages of five thousand dollars per hour for line stoppages caused by unrecorded tooling adjustments.
Whether real-time automated metrology data will ultimately replace periodic manual calibration certificates as primary legal evidence in supplier disputes remains an open question in international manufacturing contract law.