Quantified High Frequency Dielectric Drift Effects on Link Margins
Dielectric drift shifts trace impedance and loss tangent, degrading high frequency link margins by up to 5 dB at 24 GHz under heat and humidity.

Resin
High frequency printed circuit board laminates undergo structural changes when exposed to environmental heat and humidity. Polymer matrices expand, altering the volumetric ratio of glass fibers to binder across the dielectric layer. This thermal and hygroscopic expansion modifies the effective relative permittivity and dissipation factor of the substrate.
At sub-gigahertz frequencies, minor shifts in substrate permittivity remain manageable within standard design tolerances. When operating frequencies extend past 2.4 GHz into millimeter-wave spectrums, slight modifications to the substrate dielectric properties distort trace impedance and degrade transmitted signal energy.

Thermal Permittivity Shifts in Woven Glass Substrates
Substrate materials rely on woven fiberglass bundles bonded by hydrocarbon or epoxy formulations. The thermal coefficient of dielectric constant quantifies how relative permittivity shifts across operating temperatures. standard FR-4 laminates exhibit a thermal coefficient ranging from 100 to 300 parts per million per degree Celsius. High performance laminates engineered for microwave frequencies reduce this coefficient down to 30 parts per million per degree Celsius.
Temperature rises drive polymer chain relaxation, changing the electronic polarizability of the medium.
Dielectric expansion alters trace phase velocity. High temperatures reduce density, which typically lowers permittivity in pure polymers. Woven glass structures complicate this dynamic because the thermal expansion coefficient of the fiberglass core differs from the surrounding matrix.
Z-axis expansion reduces capacitance per unit length on microstrip lines, shifting characteristic impedance upward.
Moisture Absorption Mechanisms across Microwave Frequencies
Water molecules trapped within the substrate matrix introduce a high permittivity polar component. Water exhibits a relative permittivity near 78 at direct current, dropping to approximately 30 at 24 GHz. Moisture absorption of 0.2 percent by weight increases overall substrate permittivity by 0.1 to 0.3 units.
This increase raises the transmission line capacitance, pulling characteristic impedance downward from nominal design targets.
Dissipation factor escalation presents a parallel hazard. Absorbed water molecules rotate under high frequency electromagnetic fields, converting RF power into thermal energy within the dielectric layer. The loss tangent of a standard substrate increases by up to 50 percent as relative humidity shifts from 20 percent to 90 percent.
High loss tangents attenuate propagating waves directly on the printed circuit board before energy reaches the antenna feed point.
| Substrate Class | Nominal Permittivity at 10 GHz | Thermal Coefficient (ppm per degree C) | Moisture Absorption (Percent Weight) | Dissipation Factor Delta at 85 Percent RH |
|---|---|---|---|---|
| Standard FR-4 Epoxy | 4.40 | +180 | 0.35 | +0.0080 |
| Enhanced High-Tg FR-4 | 4.25 | +120 | 0.20 | +0.0045 |
| Hydrocarbon Ceramic | 3.48 | +40 | 0.06 | +0.0007 |
| PTFE Woven Glass | 2.55 | -160 | 0.02 | +0.0003 |
| Modified Polyimide | 3.50 | +50 | 0.10 | +0.0012 |
Environmental aging degrades laminate structure over prolonged operating periods. Thermal cycling breaks polymer cross-links, forming micro-voids along glass fiber intersections. Micro-voids accumulate condensed moisture during high humidity cycles, creating localized permittivity spikes along critical RF traces.
Physical failure modes emerge when environmental conditions drive laminate parameters beyond operational thresholds:
- Phase Velocity Dispersion shifts arrival timing on phase-array antenna feeds, causing steering angle errors.
- Microstrip Impedance Drift depresses return loss below acceptable design thresholds, causing reflection losses.
- Dielectric Loss Escalation converts power amplifier output into substrate heat, reducing total radiated energy.
- Passband Filter De-tuning moves planar bandpass filter cutoffs into operating channels, truncating signal bandwidth.
Design teams frequently overlook how dielectric properties shift in real operating environments. RF links designed using room-temperature datasheet values suffer performance drops when deployed outdoors in humid tropical regions or unconditioned industrial enclosures.
A substrate moisture absorption increase of 0.2 percent weight degrades loss tangent sufficiently to drop radiated link margin by 1.8 dB at 24 GHz.
Fabrication suppliers often claim that baseline tolerance bands cover ambient drift without affecting system performance. Field data demonstrates that ambient drift routinely exceeds factory tolerance bands when operating conditions exceed nominal bench environments.
Detuning
Impedance matching networks depend on stable component values and predictable PCB trace geometries to deliver maximum power transfer between the transceiver integrated circuit and the antenna. When substrate permittivity shifts due to temperature or moisture absorption, the physical dimensions of microstrip lines no longer match the electrical lengths calculated during design. The resulting impedance mismatch reflects a portion of the transmitted signal back toward the source, lowering effective isotropic radiated power.

Impedance Discontinuities on High Frequency Traces
Microstrip trace impedance varies inversely with the square root of substrate effective permittivity. A 5 percent rise in effective permittivity drops a nominal 50-ohm trace to 48.8 ohms. While a 1.2-ohm drop appears modest, it alters the S-parameters across multi-stage matching topologies.
Transmission line sections functioning as impedance transformers drift away from target impedances, inducing standing waves along the signal path.
Voltage Standing Wave Ratio increases in step with permittivity drift. Higher VSWR degrades power amplifier efficiency and increases current draw at full output power. Transceivers operating with automatic output power control attempt to compensate for reflection losses by increasing transmit current, accelerating power budget exhaustion in battery-operated nodes.
Quarter Wave Resonator Frequency Drift
Planar filters, directional couplers, and quarter-wave stub matching elements rely on precise physical lengths tied to signal wavelength within the dielectric medium. Signal wavelength shrinks as dielectric constant increases. An upward drift in permittivity lowers the resonant frequency of printed structures.
A quarter-wave resonator tuned for 5.8 GHz shifts downward by 140 MHz under a 5 percent dielectric constant increase.
Narrowband filters suffer heavy insertion loss penalties when passbands shift away from assigned operating channels. A planar bandpass filter with a 200 MHz 3-dB bandwidth drops signal amplitude by 4 dB to 8 dB at the band edges when permittivity shifts shift the center frequency. Receiver sensitivity degrades by an identical margin because incoming signals experience off-center attenuation before reaching the low-noise amplifier.
Uncompensated dielectric shifts pull planar matching network resonances completely outside nominal channel allocations.
Engineers evaluate several critical substrate parameters when selecting RF laminates for high frequency systems:
- Substrate Thickness Tolerance dictates characteristic impedance consistency across production batches.
- Copper Surface Roughness drives conductor losses at frequencies where skin depth approaches foil profile height.
- Thermal Expansion Profile determines Z-axis via reliability and microstrip capacitance shifts over temperature cycles.
- Glass Weave Uniformity prevents localized permittivity variations between adjacent trace runs on multi-layer boards.
Failing to account for dielectric drift in impedance matching calculations forces systems into degraded performance states, reducing achievable line-of-sight range and increasing packet error rates under field conditions.


Attenuation
Link budgets account for all gains and losses from the transmitter power amplifier to the receiver baseband processor. Substrate dielectric drift introduces attenuation mechanisms that erode the fade margin established during system design. At lower frequencies, free space path loss dominates the link budget sum.
As carrier frequencies scale into the microwave and millimeter-wave regions, substrate loss becomes a major factor in overall system attenuation.

Link Budget Margin Degradation Mechanics
Radiated link margin represents the surplus signal power available above the receiver sensitivity threshold. A link budget calculated for a 2.4 GHz LoRaWAN or Zigbee system typically incorporates a 10 dB to 15 dB fade margin to absorb environmental path loss variation. When substrate dielectric constant shifts, impedance mismatches generate reflection losses at antenna ports.
Combined with higher substrate dissipation loss, total RF channel insertion loss increases.
Receiver sensitivity degrades as dielectric losses increase noise figures. Low-noise amplifiers placed after detuned input filters experience higher input insertion losses, adding directly to the system noise figure on a decibel-for-decibel basis. A 2 dB input filter loss increases system noise figure by 2 dB, lowering sensitivity from -104 dBm to -102 dBm.
This shift reduces maximum communication distance in line-of-sight environments.
Worked Derivation of Millimeter Wave Link Decay
Consider a 24 GHz point-to-point wireless data module operating over a 100-meter line-of-sight path. Assume a transmit power of +14 dBm, an antenna gain of +18 dBi at both ends, and a receiver sensitivity of -85 dBm at a 100 Mbps data rate using QPSK modulation. Free space path loss at 24 GHz over 100 meters equals 100.0 dB, calculated using the standard path loss equation.
Under nominal bench conditions at 20 degrees Celsius and 30 percent relative humidity, substrate microstrip loss measures 0.4 dB per centimeter on a hydrocarbon laminate. With 5 centimeters of total microstrip trace length across the transmitter and receiver boards, baseline board loss equals 2.0 dB. Total received power equals +14 dBm + 18 dBi + 18 dBi – 100.0 dB – 2.0 dB = -52.0 dBm.
This baseline yield establishes a comfortable 33.0 dB link margin over the -85 dBm sensitivity floor.
Now evaluate the system inside an unconditioned enclosure at 65 degrees Celsius and 85 percent relative humidity. Substrate moisture absorption and thermal expansion increase the real permittivity by 4 percent and the dissipation factor by 80 percent. Board loss increases from 0.4 dB per centimeter to 0.7 dB per centimeter, expanding trace attenuation to 3.5 dB across the 5 centimeter path.
Simultaneously, permittivity shifts move the matching network impedance from 50 ohms to 42 – j12 ohms, creating an S11 reflection loss of 1.8 dB at the transmitter antenna port and 1.8 dB at the receiver antenna port. Total hardware degradation equals 1.5 dB additional line loss plus 3.6 dB total reflection loss, producing a 5.1 dB drop in radiated link power. Received power falls to -57.1 dBm, reducing available link margin from 33.0 dB to 27.9 dB.
| Frequency Band | Nominal Trace Loss (dB/cm) | Drift Trace Loss (dB/cm) | Matching Mismatch Loss (dB) | Total Hardware Penalty (dB) | Equivalent Range Reduction (Percent) |
|---|---|---|---|---|---|
| 868 / 915 MHz | 0.03 | 0.04 | 0.20 | 0.25 | 2.8 |
| 2.4 GHz | 0.08 | 0.11 | 0.45 | 0.60 | 6.7 |
| 5.8 GHz | 0.18 | 0.26 | 0.90 | 1.30 | 13.9 |
| 24 GHz | 0.40 | 0.70 | 3.60 | 5.10 | 44.4 |
| 60 GHz | 1.20 | 2.10 | 6.20 | 10.70 | 70.9 |
At 60 GHz, attenuation effects scale rapidly. Atmospheric oxygen absorption adds 15 dB per kilometer of path loss. When combined with substrate dielectric drift penalties exceeding 10 dB, communication distance collapses to a fraction of the nominal design target unless transmitters operate with massive power overhead.
Power budgets suffer direct consequences from dielectric attenuation. Transceivers running high duty cycles expend energy radiating lost power as thermal dissipation within substrate layers. A module drawing 120 milliamperes at 3.3 volts to deliver +20 dBm RF output wastes 30 percent of its drawn power overcoming substrate mismatch and line losses when dielectric parameters drift off nominal values.
IPC 6012 Class 3 performance specifications enforce strict laminate thickness and dielectric constant tolerances to limit high frequency insertion loss variation.
Stable RF operation requires matching substrate material properties to operating frequency profiles before committing designs to volume production.

Bench
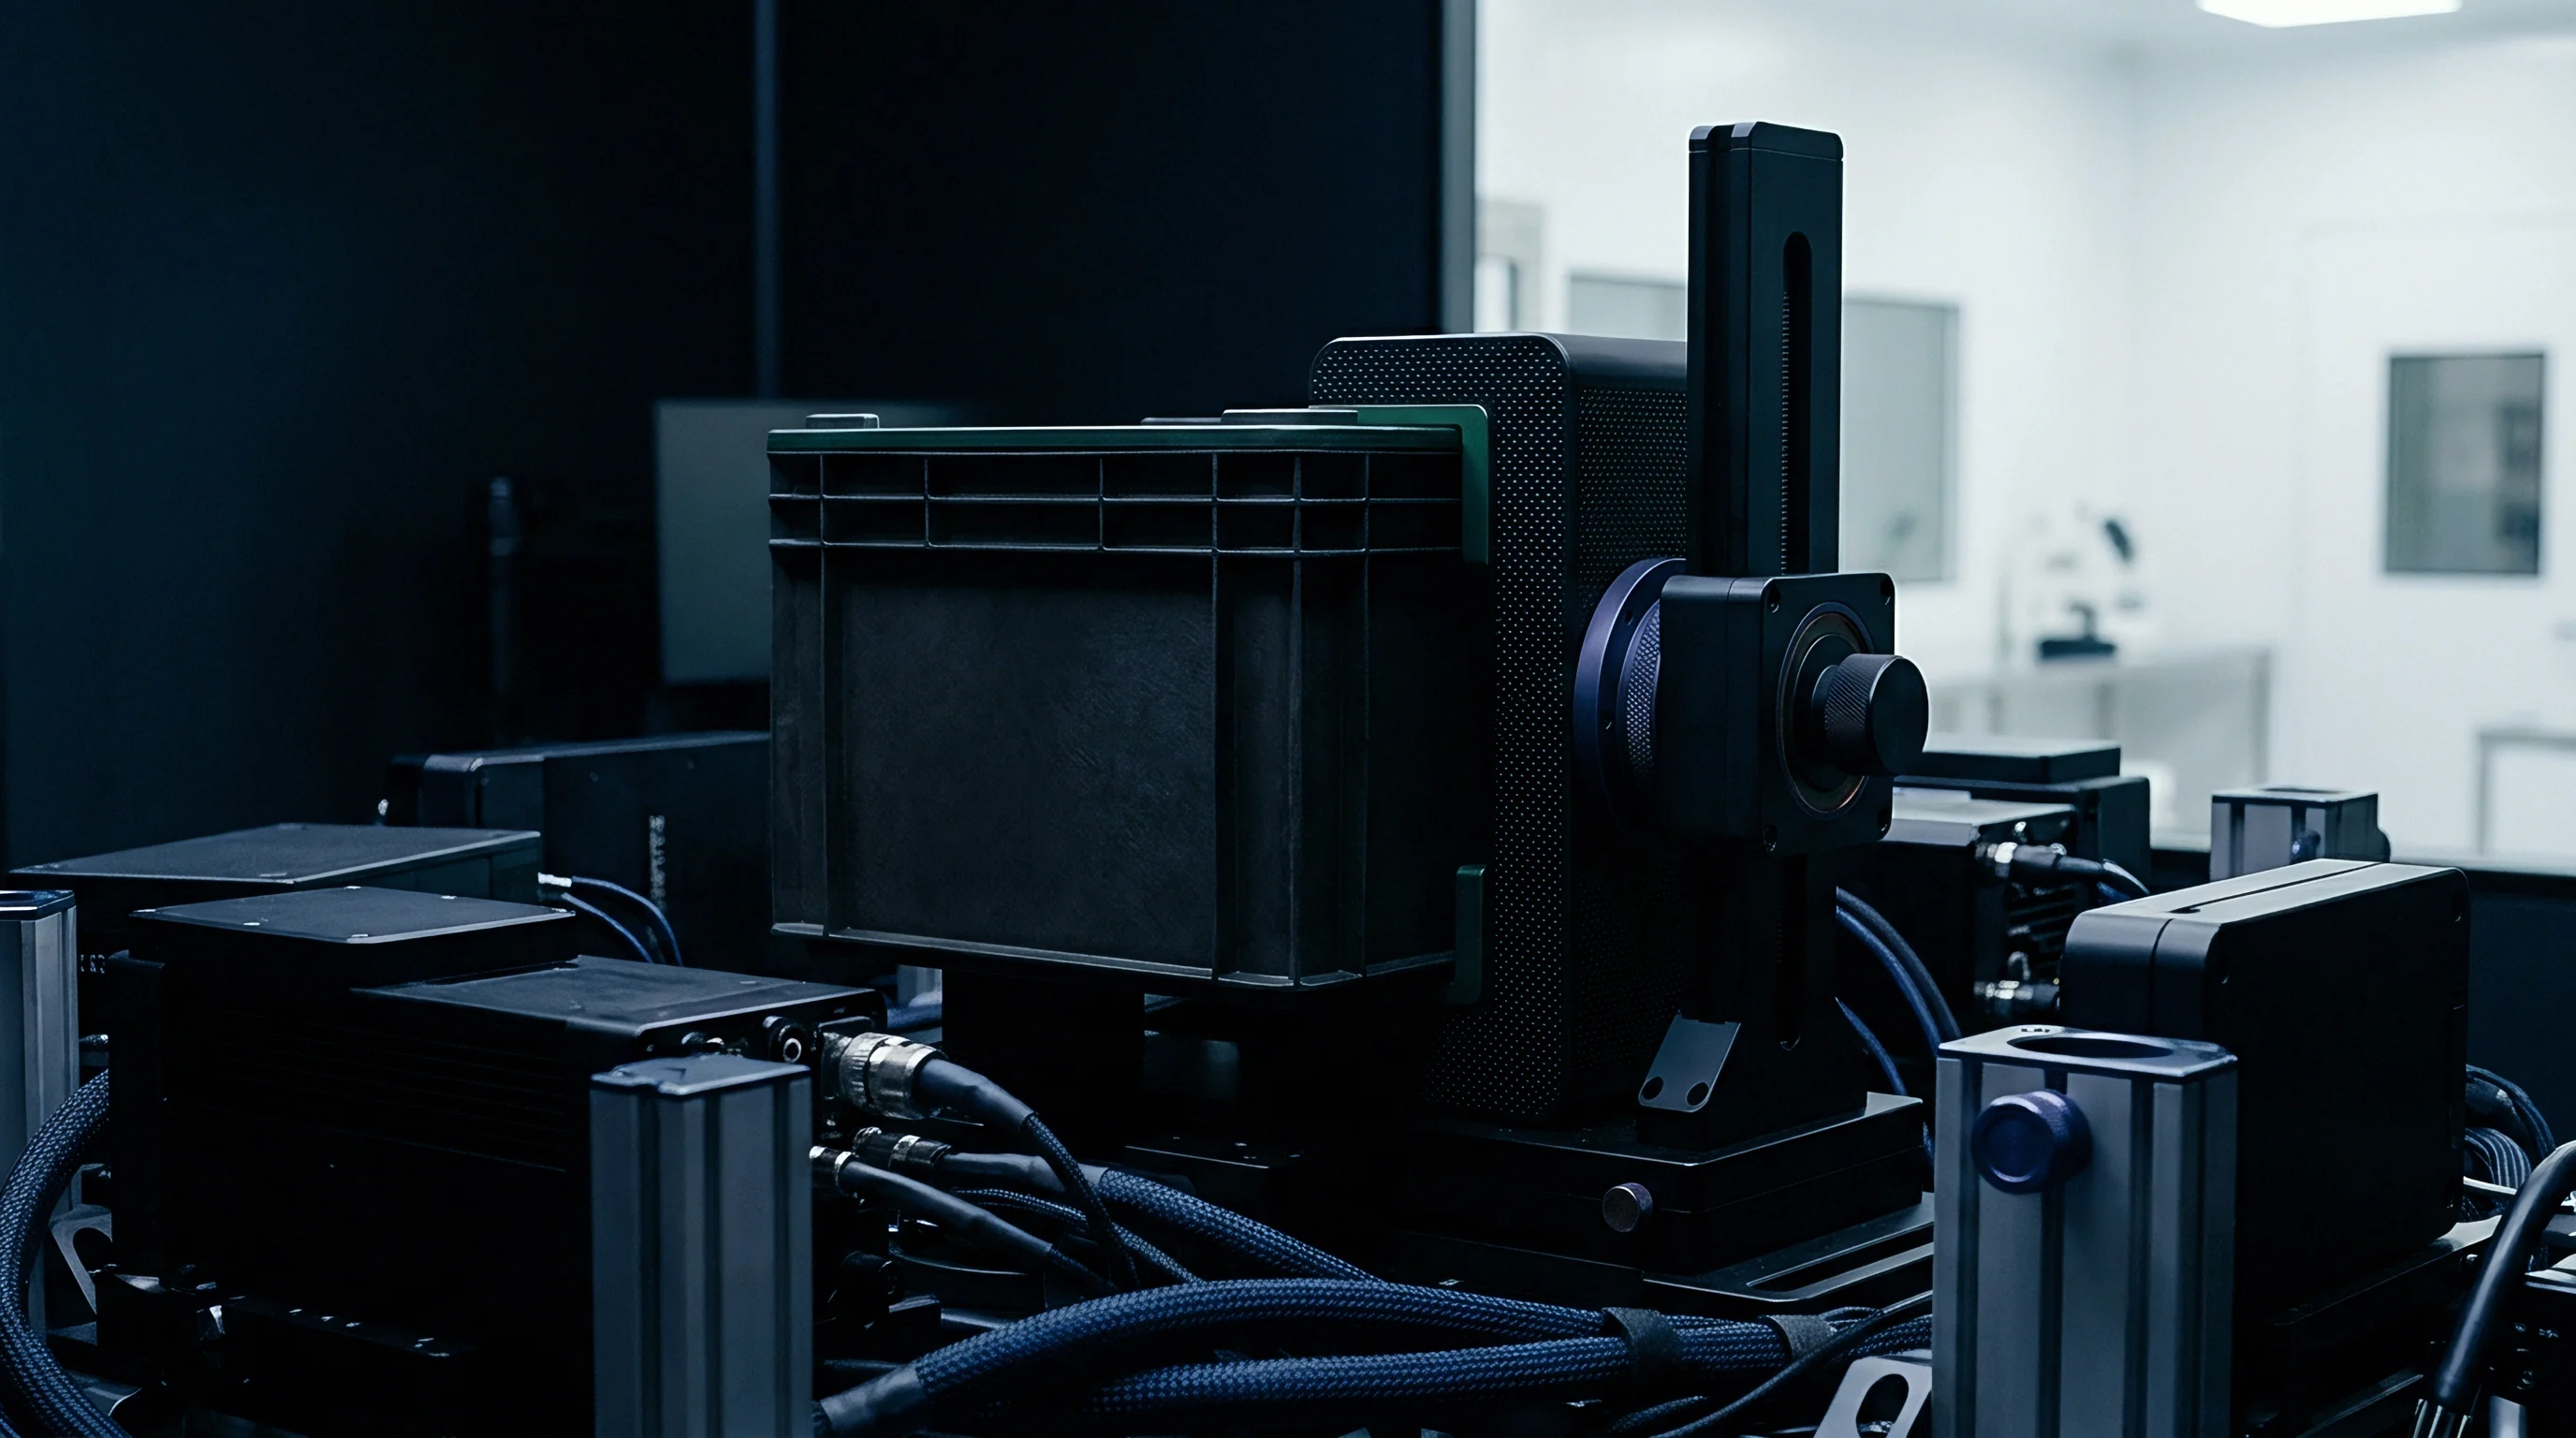
Characterizing dielectric drift requires precise RF measurement techniques across environmental extremes. Engineers validate substrate behavior using test fixtures placed inside thermal and humidity chambers while connected to calibrated vector network analyzers. Measuring shifts in complex S-parameters reveals exact permittivity and loss tangent variations under dynamic operating conditions.
Why Do Accelerated Thermal Cycles Shift Dielectric Permittivity?
Repeated thermal cycling stresses the molecular bond interfaces between epoxy resins and glass fibers. Coefficient of thermal expansion mismatches generate micro-fractures along fiber bundles. Moisture enters these micro-fractures during elevated humidity testing, altering localized permittivity values.
Measured data indicates dielectric drift accelerates after initial thermal shock exposures before settling into a steady state degradation curve.
Split-post dielectric resonator fixtures provide accurate measurements of material permittivity and loss tangent. Placing substrate samples into an SPDR cavity shifts the resonant frequency and quality factor of the test cell. Comparing cavity responses across temperature sweeps quantifies substrate dielectric drift without contamination from conductor copper losses.

Resonator Characterization Methods for PCB Lot Audits
Ring resonator structures etched onto test coupons allow engineers to audit laminate lots during incoming quality control. The resonant frequencies of microstrip ring structures correspond directly to effective substrate permittivity. Measuring S21 insertion loss peak frequencies provides immediate verification of material parameters prior to assembly processing.
| Measurement Method | Frequency Range | Permittivity Accuracy | Loss Tangent Resolution | Sample Requirements |
|---|---|---|---|---|
| Split-Post Dielectric Resonator | 1 GHz to 20 GHz | +/- 0.5 percent | 0.0001 | Bare flat substrate coupon |
| Microstrip Ring Resonator | 2 GHz to 60 GHz | +/- 1.5 percent | 0.0005 | Etched circuit board coupon |
| Broadband Transmission Line | 100 MHz to 110 GHz | +/- 2.5 percent | 0.0020 | Precision microstrip trace |
| Cavity Perturbation Method | 8 GHz to 40 GHz | +/- 0.8 percent | 0.0002 | Precision machined substrate rod |
Executing an incoming dielectric verification procedure follows a defined measurement sequence:
- Bake substrate test coupons in a dry oven at 105 degrees Celsius for 4 hours to eliminate residual storage moisture.
- Measure baseline resonant frequencies using an SPDR cavity fixture connected to a calibrated vector network analyzer.
- Transfer coupons into an environmental test chamber set to 85 degrees Celsius and 85 percent relative humidity for 48 hours.
- Remeasured S-parameters within 5 minutes of chamber extraction to capture peak moisture absorption impacts.
- Calculate real permittivity shifts and loss tangent deltas using cavity resonance inversion equations.
Evaluating test coupon data against supplier specification sheets often reveals discrepancies between published material datasheets and production lot reality. Substrates sourced from low cost suppliers exhibit batch-to-batch dielectric constant variations up to 8 percent, introducing unexpected link budget losses in finished products.
Unresolved questions remain regarding how multi-gigahertz copper surface treatments interact with drifting substrate dielectric boundaries over ten-year operational product lifespans.

Contract
Sourcing high frequency laminates demands unambiguous engineering documentation embedded directly within supply agreements. Procurement terms must reference specific material standards, processing limits, and inspection criteria to prevent suppliers from substituting lower grade substrates during volume production. Clear technical specifications protect link budget margins by enforcing strict dielectric tolerances at the laminate manufacturing stage.

Specifying Laminate Dielectric Tolerances in RFQs
Request for Quote documentation must detail exact material limits rather than generic material trade names. Specifications must explicitly state target relative permittivity values accompanied by tight tolerance bands, such as 3.48 +/- 0.05 at 10 GHz. Demanding compliance with IPC-4103 standards for high frequency laminates ensures suppliers use tested resin systems and controlled glass weaves.
Procurement terms should include lot-level certificate of analysis requirements. Laminate manufacturers must supply test data confirming permittivity, loss tangent, and panel thickness profiles for every shipped master roll. Out-of-spec material lots must trigger automatic rejection protocols before laminates enter board fabrication lines.
Supplier Conformance Clauses for High Frequency Substrates
Supply contracts must define clear financial liabilities when unannounced material modifications degrade RF performance. PCB fabricators occasionally substitute alternative resin formulations or change glass weave styles to reduce processing costs. These unapproved alterations shift dielectric constants, degrading product sensitivity and transmission range in production batches.
Contractual guarantees specifying dielectric constant stability across operating temperature ranges protect buyers against unannounced laminate material changes.
Per IPC-6012 Section 3.2.5, fabricators must demonstrate laminate dielectric constant compliance using dedicated test coupons processed on the same manufacturing panels as finished production boards.