Establishing Semi Anechoic Chamber Quiet Zones for Pre Scan Verification
Establishing a semi-anechoic quiet zone involves volumetric SVSWR calibration and field mapping to align pre-scan data with accredited certification sweeps.
Boundary
Semi-anechoic testing relies on defining a controlled cylinder where electromagnetic radiation behaves predictably. Inside this volume, plane waves propagate without significant reflection from metallic wall structures or ceiling enclosures. Pre-scan checks fail when equipment under test extends beyond this calibrated volume, exposing measurement antennas to reflected wave paths that mask true emission peaks.
Setting physical dimensions correctly isolates source emissions from enclosure boundary interference.
Antenna phase centers, test sample dimensions, and turntable position tolerances set the limits of a compliant Quiet Zone. When testing radio modules or unshielded electronic assemblies, emissions radiated from peripheral cables or secondary enclosures often spill outside the calibrated space. This leakage creates artificial resonance dips and uncalibrated amplitude spikes across the frequency spectrum.
Mapping chamber capabilities requires establishing spatial boundaries based on physical wavelength parameters rather than arbitrary geometric dimensions.
Cylindrical Specification and Volumetric Limits
Standardized measurement protocols define the minimum quiet volume as a right circular cylinder centered above the turntable axis of rotation. The diameter of this cylinder must span the largest physical dimension of the device under test, including attached cables and support equipment. Height extends from the ground plane base up to the highest point of the emitter assembly.
Establishing these boundaries accurately requires methodical setup.
For pre-scan verification, engineers frequently use a nominal cylinder measuring 1.5 meters in diameter by 1.5 meters in height. Maintaining uniform field parameters across this volume grows difficult as frequencies push into the microwave spectrum. At higher frequencies, absorber performance drops at oblique incidence angles, allowing localized reflections to cross the cylindrical perimeter and effectively shift the boundary as frequencies pass specific dimensional thresholds.
Radiated field measurement accuracy degrades when an emitter exceeds thirty percent of the quiet cylinder’s diameter. Beyond this threshold, the assumption of plane-wave illumination breaks down, replacing planar phase fronts with spherical wave curvature across the antenna aperture. This curvature introduces phase distortion across broadband horn receiving antennas, creating amplitude errors when detecting peak emissions.
| Parameter | CISPR 16-1-4 Specification | ANSI C63.4 Standard | Pre-Scan Verification Target |
|---|---|---|---|
| Cylinder Diameter Range | 1.0 m to 3.0 m | 1.2 m to 2.0 m | 1.5 m standard reference |
| Cylinder Height Range | 1.0 m to 2.0 m | 1.0 m to 1.5 m | 1.5 m standard reference |
| Frequency Lower Bound | 30 MHz | 30 MHz | 30 MHz |
| Frequency Upper Bound | 18 GHz | 40 GHz | 6 GHz nominal pre-scan |
| Maximum Allowable Field Amplitude Ripple | 6.0 dB (SVSWR) | 6.0 dB (SVSWR) | 4.0 dB internal target |
Spatial Variance across Low Frequency Regimes
Electromagnetic wave physics below two hundred megahertz present severe challenges in small pre-scan enclosures. At thirty megahertz, a single wavelength spans ten meters ~ exceeding the physical dimensions of standard pre-scan rooms. Pyramidal absorber tips lack sufficient electrical depth at these long wavelengths, allowing electromagnetic energy to penetrate deep into underlying ferrite tiles or bare metallic enclosure walls and rapidly compound measurement errors.
Low-frequency standing waves distort the quiet region, creating spatial nodes and anti-nodes across the turntable volume. An emitter positioned at an anti-node can appear to radiate several decibels above its actual output, while one located at a node yields artificially suppressed readings. Antenna factor calculations assume uniform spatial impedance, which varies widely across an uncalibrated volume in low-frequency bands.
To evaluate low-frequency spatial variations, engineers map volumetric transmission loss across multiple grid heights and assess attenuation along three orthogonal axes. This empirical approach reveals localized boundary collapses that standard single-point calibrations miss completely.
A field amplitude variation exceeding 1.5 dB across a 1.5-meter quiet cylinder at 30 MHz alters final radiated emission estimates by up to 4.2 dB.
Engineers encountering quiet volume distortion at low frequencies often misattribute test deviations to internal circuit board coupling. In reality, the physical enclosure walls reflect long-wavelength signals directly back into the receiving antenna path. Fixing this requires installing higher-permeability ferrite tiles or shifting the turntable center away from resonant enclosure cavity modes.
Volumetric Scoping Failures:
- Uncalibrated Cable Radiation causing radiated signals to leak past the calibrated cylindrical perimeter into unshielded measurement paths.
- Spherical Phase Distortion where large test samples create non-planar illumination across receiving antenna apertures at high microwave frequencies.
- Localized Ferrite Resonances causing sharp amplitude notches in quiet region uniformity across the thirty to eighty megahertz spectrum.
- Turntable Offset Errors generating artificial signal variations as the device under test rotates through non-concentric electromagnetic field contours.
Miscalculating quiet volume dimensions during pre-scan setup introduces systematic amplitude shifts that corrupt preliminary compliance assessments. A test sample cleared in an unverified quiet volume frequently fails formal accredited testing, forcing expensive board re-lays, unbudgeted shielding redesigns, and missed product launch windows.
Foam
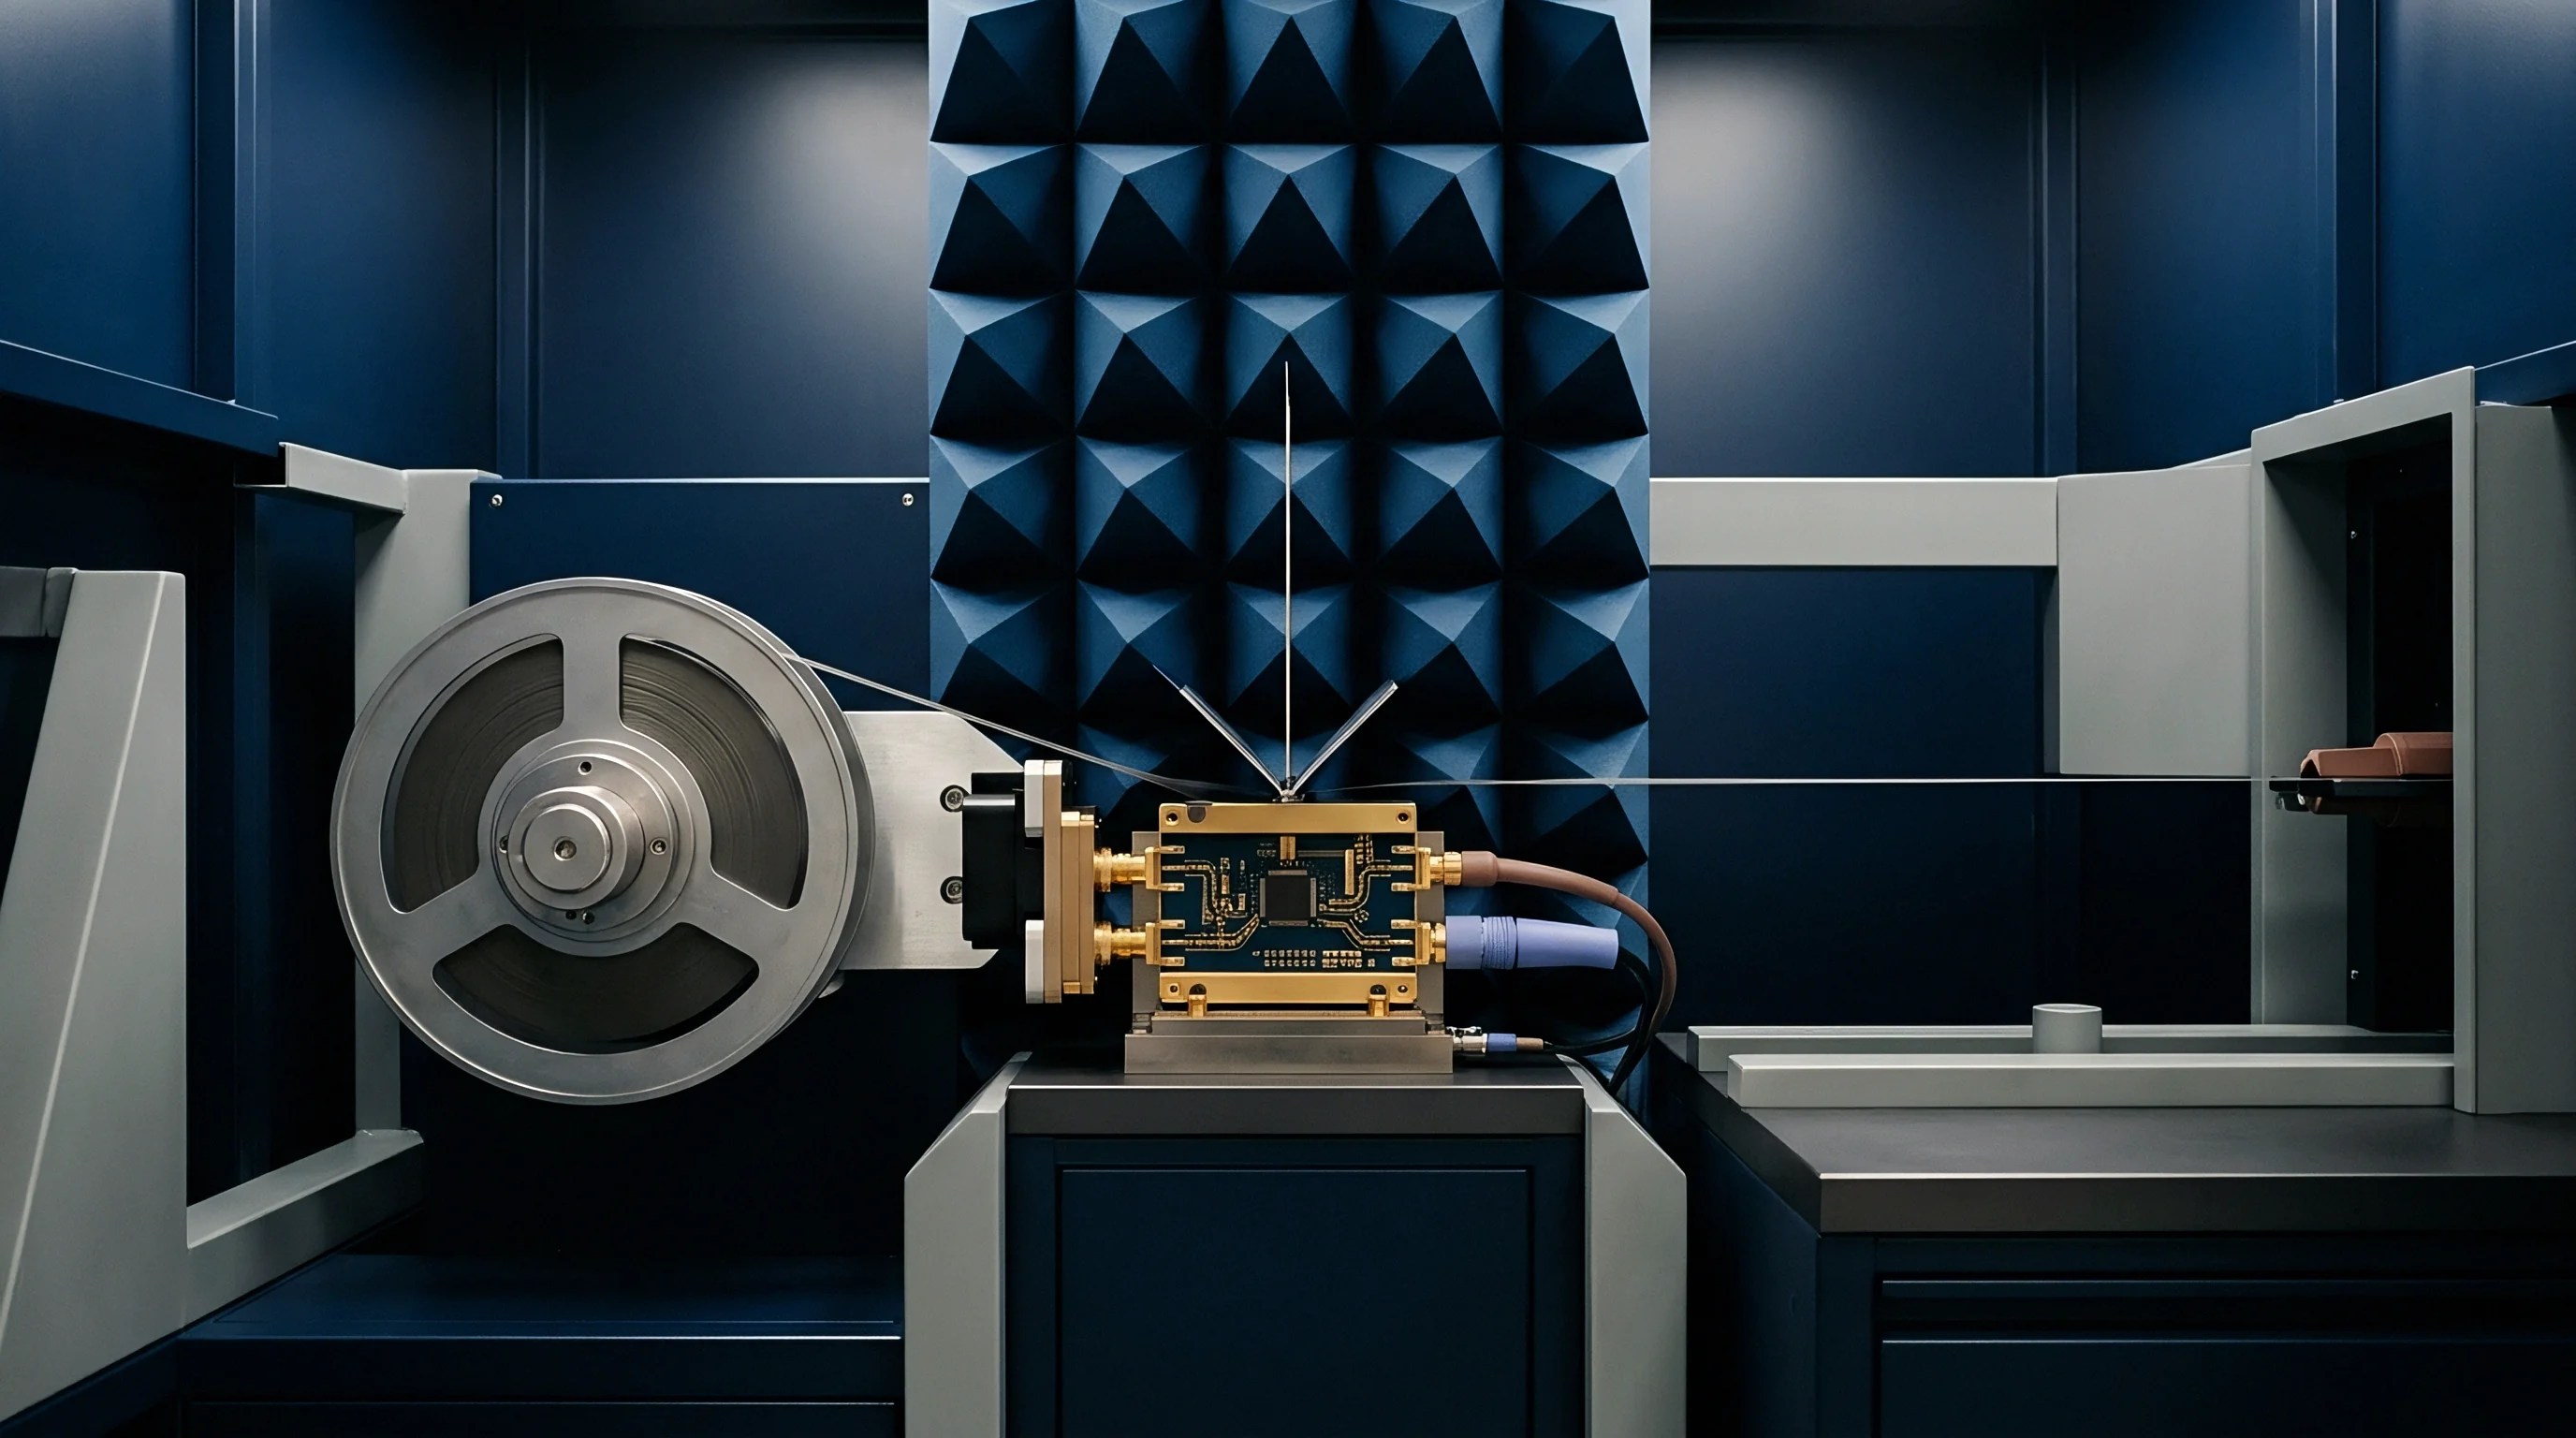
RF absorber materials convert incident electromagnetic wave energy into heat through dielectric loss. Carbon-impregnated polyurethane geometries form the main defense against unwanted internal wave scattering in semi-anechoic spaces. Without proper absorption profiles, high-frequency energy bounces off conductive structural walls, creating complex interference patterns that ruin pre-scan accuracy.
Selecting and arraying absorber elements determines baseline chamber performance.
Polyurethane absorbers rely on precise carbon dispersion throughout their open-cell foam matrix. Variations in carbon density alter the dielectric loss tangent, shifting the impedance transformation curve across the operational spectrum. Higher carbon concentrations increase attenuation per unit length but degrade spatial impedance matching at the air-absorber interface.
Achieving high absorption requires balancing interface reflection against internal wave attenuation.

Carbon Loaded Pyramidal Absorber Mechanics
Pyramidal structures achieve impedance matching through a gradual geometric transition between air and the loaded substrate. Waves impinging on the tip encounter an effective intrinsic impedance close to free space, minimizing front-face reflection. As the wave penetrates deeper toward the pyramid base, the increasing volume introduces higher dielectric loss, absorbing energy before it hits the metallic wall.
Physical pyramid height dictates the lowest frequency of effective absorption. A standard rule in chamber design ties effective quarter-wavelength performance directly to pyramid height. For efficient operation at one gigahertz, pyramids measuring seven point five centimeters satisfy basic absorption requirements, whereas working down to one hundred megahertz requires pyramids exceeding seventy-five centimeters in height.
Over time, physical sagging, moisture absorption, and mechanical tip damage degrade geometric uniformity across wall arrays. Sagging tips alter the wave entry angle, reflecting energy directly toward the turntable rather than scattering it between adjacent pyramid faces. Regular visual and physical inspections prevent unnoticed quiet volume degradation.
Absorber Installation Steps:
- Clean metallic enclosure surfaces thoroughly with solvent to remove oil and dust deposits.
- Apply conductive adhesive or secure mounting tracks evenly across substrate panel grid interfaces.
- Align ferrite tile backing arrays flush against the enclosure shield, ensuring no air gaps remain between adjacent tiles.
- Press carbon-loaded absorber bases firmly against ferrite surfaces, keeping structural alignment along vertical grid lines.
- Verify pyramid tip alignment using laser leveling tools across the entire ceiling and sidewall arrays.
Hybrid Tile and Absorber Impedance Matching
Ferrite backing plates extend lower boundary performance down to thirty megahertz while maintaining compact wall profiles. Pure carbon-loaded pyramids capable of absorbing thirty-megahertz signals need physical lengths exceeding two point five meters, which severely restricts usable floor space. Combining thin ferrite tiles with shorter carbon pyramids achieves broadband performance within tight chamber footprints.
Ferrite tiles operate through magnetic permeability losses rather than pure dielectric loss mechanisms. Sintered ceramic ferrite plates measuring six millimeters in thickness absorb magnetic field components effectively between thirty and three hundred megahertz. Above three hundred megahertz, ferrite permeability drops rapidly, leaving energy absorption to the overlaying shortened carbon pyramid array, though the heavy ceramic tiles add significant mass to the enclosure walls.
Matching the dielectric impedance of shortened carbon pyramids to the magnetic impedance of ferrite tiles requires precise formulation of the absorber base layer. Improper matching at the foam-ferrite interface reflects electromagnetic energy back through the pyramid tips, creating sharp resonance peaks in the quiet volume. Pre-scan operators must verify that hybrid installations maintain flat absorption curves across transition frequencies.
Hybrid absorber arrays are rarely immune to quiet zone degradation over long operational periods. In practice, binder breakdown in low-cost foam combined with thermal expansion cycles in ferrite backings alters joint impedances over time, causing uncalibrated reflections along primary signal paths.


Grid
Mapping spatial field uniformity mandates scanning discrete positions across a defined planar surface. This mapping validates that energy radiated inside the pre-scan room remains free from localized hot spots caused by wall reflection anomalies. Performing spatial grid measurements identifies physical quiet zone boundaries before real test samples go onto the turntable, establishing baseline confidence in pre-scan data.
Standard field uniformity assessments use a vertical plane positioned where the device under test will sit. This planar area covers a square grid, typically measuring one point five meters by one point five meters, containing sixteen evenly spaced measurement points. Field strength variations across these points dictate whether the volumetric space meets regulatory pre-scan requirements.

Field Uniformity Mapping Procedures
Isotropic field probes capture field strength magnitude across sixteen designated spatial points. An unmodulated carrier signal feeds a transmitting antenna located at the far end of the chamber, projecting electromagnetic energy toward the grid plane. Field probes sweep through each grid coordinate, recording amplitude values across discrete frequency steps within the geometric limits of the setup.
Data processing algorithms evaluate field uniformity by sorting the sixteen recorded amplitude values at each frequency step. Excluding the lowest four values leaves seventy-five percent of the grid points for calculating total field spread. Standard compliance rules require that the field spread across this reduced dataset remains within a zero-to-six-decibel window to prevent shadow zones from skewing results.
During preliminary product scans, aligning antenna phase centers against the geometric origin ensures that receiving antenna calibration factors match spatial grid origin points during radiated emission data capture. Misalignment between antenna phase centers and spatial grid origins introduces systematic magnitude offsets during spectrum analysis sweeps.
| Frequency Band | Maximum Field Variation | Allowable Outlier Exclusion | Primary Standard Alignment |
|---|---|---|---|
| 30 MHz to 80 MHz | 6.0 dB maximum window | Up to 4 points excluded | IEC 61000-4-3 / CISPR 16-1-4 |
| 80 MHz to 1000 MHz | 6.0 dB maximum window | Up to 4 points excluded | IEC 61000-4-3 / ANSI C63.4 |
| 1 GHz to 6 GHz | 6.0 dB maximum window | Up to 4 points excluded | CISPR 16-1-4 SVSWR Method |
| 6 GHz to 18 GHz | 6.0 dB maximum window | No exclusions permitted | CISPR 16-1-4 Volumetric Sweep |
Does Wall Ferrite Aging Alter Quiet Zone Boundaries?
Environmental humidity and mechanical stress induce micro-cracks in ceramic magnetic structures over long duty cycles. Moisture entering the porous ferrite matrix alters relative dielectric permittivity, shifting low-frequency absorption bands. These structural changes cause subtle degradation in quiet volume boundaries, particularly along wall sections exposed to temperature swings.
Mechanical vibration from facility walls further accelerates micro-fracturing along ferrite tile glue lines. When tiles decouple from metallic enclosure backing plates, air gaps disrupt magnetic flux paths, reducing magnetic losses at lower boundary frequencies. This breakdown causes localized reflections that shrink the effective cylindrical quiet zone diameter over extended service periods.
Periodic spatial grid re-verification catches aging absorber regions before degraded performance skews product test results. Installing automated field-probe positioning systems allows facility managers to run overnight spatial grid calibrations, tracking volumetric quiet zone integrity without interrupting daytime pre-scan schedules.
Compliance with CISPR 16-1-4 Clause 8.2 dictates that site voltage standing wave ratio measurements above 1 GHz stay within a 6.0 dB maximum window to prevent false compliance passes.
Under contract provisions matching EN 50147-2 section 4.1, chamber validation reports must include sixteen-point grid field uniformity plots generated under full environmental control before facility acceptance sign-off occurs.
Reflection
Multipath electromagnetic waves bouncing off metallic chamber enclosures distort radiated emission amplitude measurements. Direct-path signals transmitted from a test sample interfere vectorially with reflected signals arriving from sidewalls, floor, and ceiling surfaces. This vector summation generates constructive and destructive interference patterns that alter measured signal levels on spectrum analyzer displays.
Managing internal reflections is essential for preserving pre-scan amplitude accuracy.
Ground plane reflection paths represent an intentional design feature in semi-anechoic chambers, simulating open area test site conditions. However, unwanted reflections from sidewalls and ceiling surfaces contaminate these controlled ground reflections. Evaluating site voltage standing wave ratio isolates internal wall scattering from intended floor reflections, providing a clear metric of chamber quietness.

Site Voltage Standing Wave Ratio Physics
Interference between direct and scattered wave fronts generates standing wave patterns along the transmission path. Measuring site voltage standing wave ratio involves moving an omnidirectional transmitting antenna along defined line paths inside the quiet zone volume while recording signal strength at a fixed receiving antenna. Standing wave peaks and troughs reveal the magnitude of wall and ceiling reflections.
High site voltage standing wave ratio values indicate strong internal specular reflections that alter measured signal amplitudes. If a wall reflection arrives in phase with the direct signal, the receiving antenna records an artificial amplitude increase of up to six decibels. Conversely, an out-of-phase reflection creates deep amplitude nulls, masking real product emissions that exceed regulatory limits during turntable scans.
Site voltage standing wave ratio calibrations above one gigahertz require capturing transmission loss data across complex spatial vectors. Line paths include front-to-back, side-to-side, and diagonal sweeps across multiple turntable heights. Calculating maximum amplitude variations across all vector positions determines whether the chamber meets international pre-scan verification tolerances.
Ground plane reflections always dominate low frequency radiation patterns before sidewall specular points take over.
Ray Tracing Analysis for Sidewall Absorption
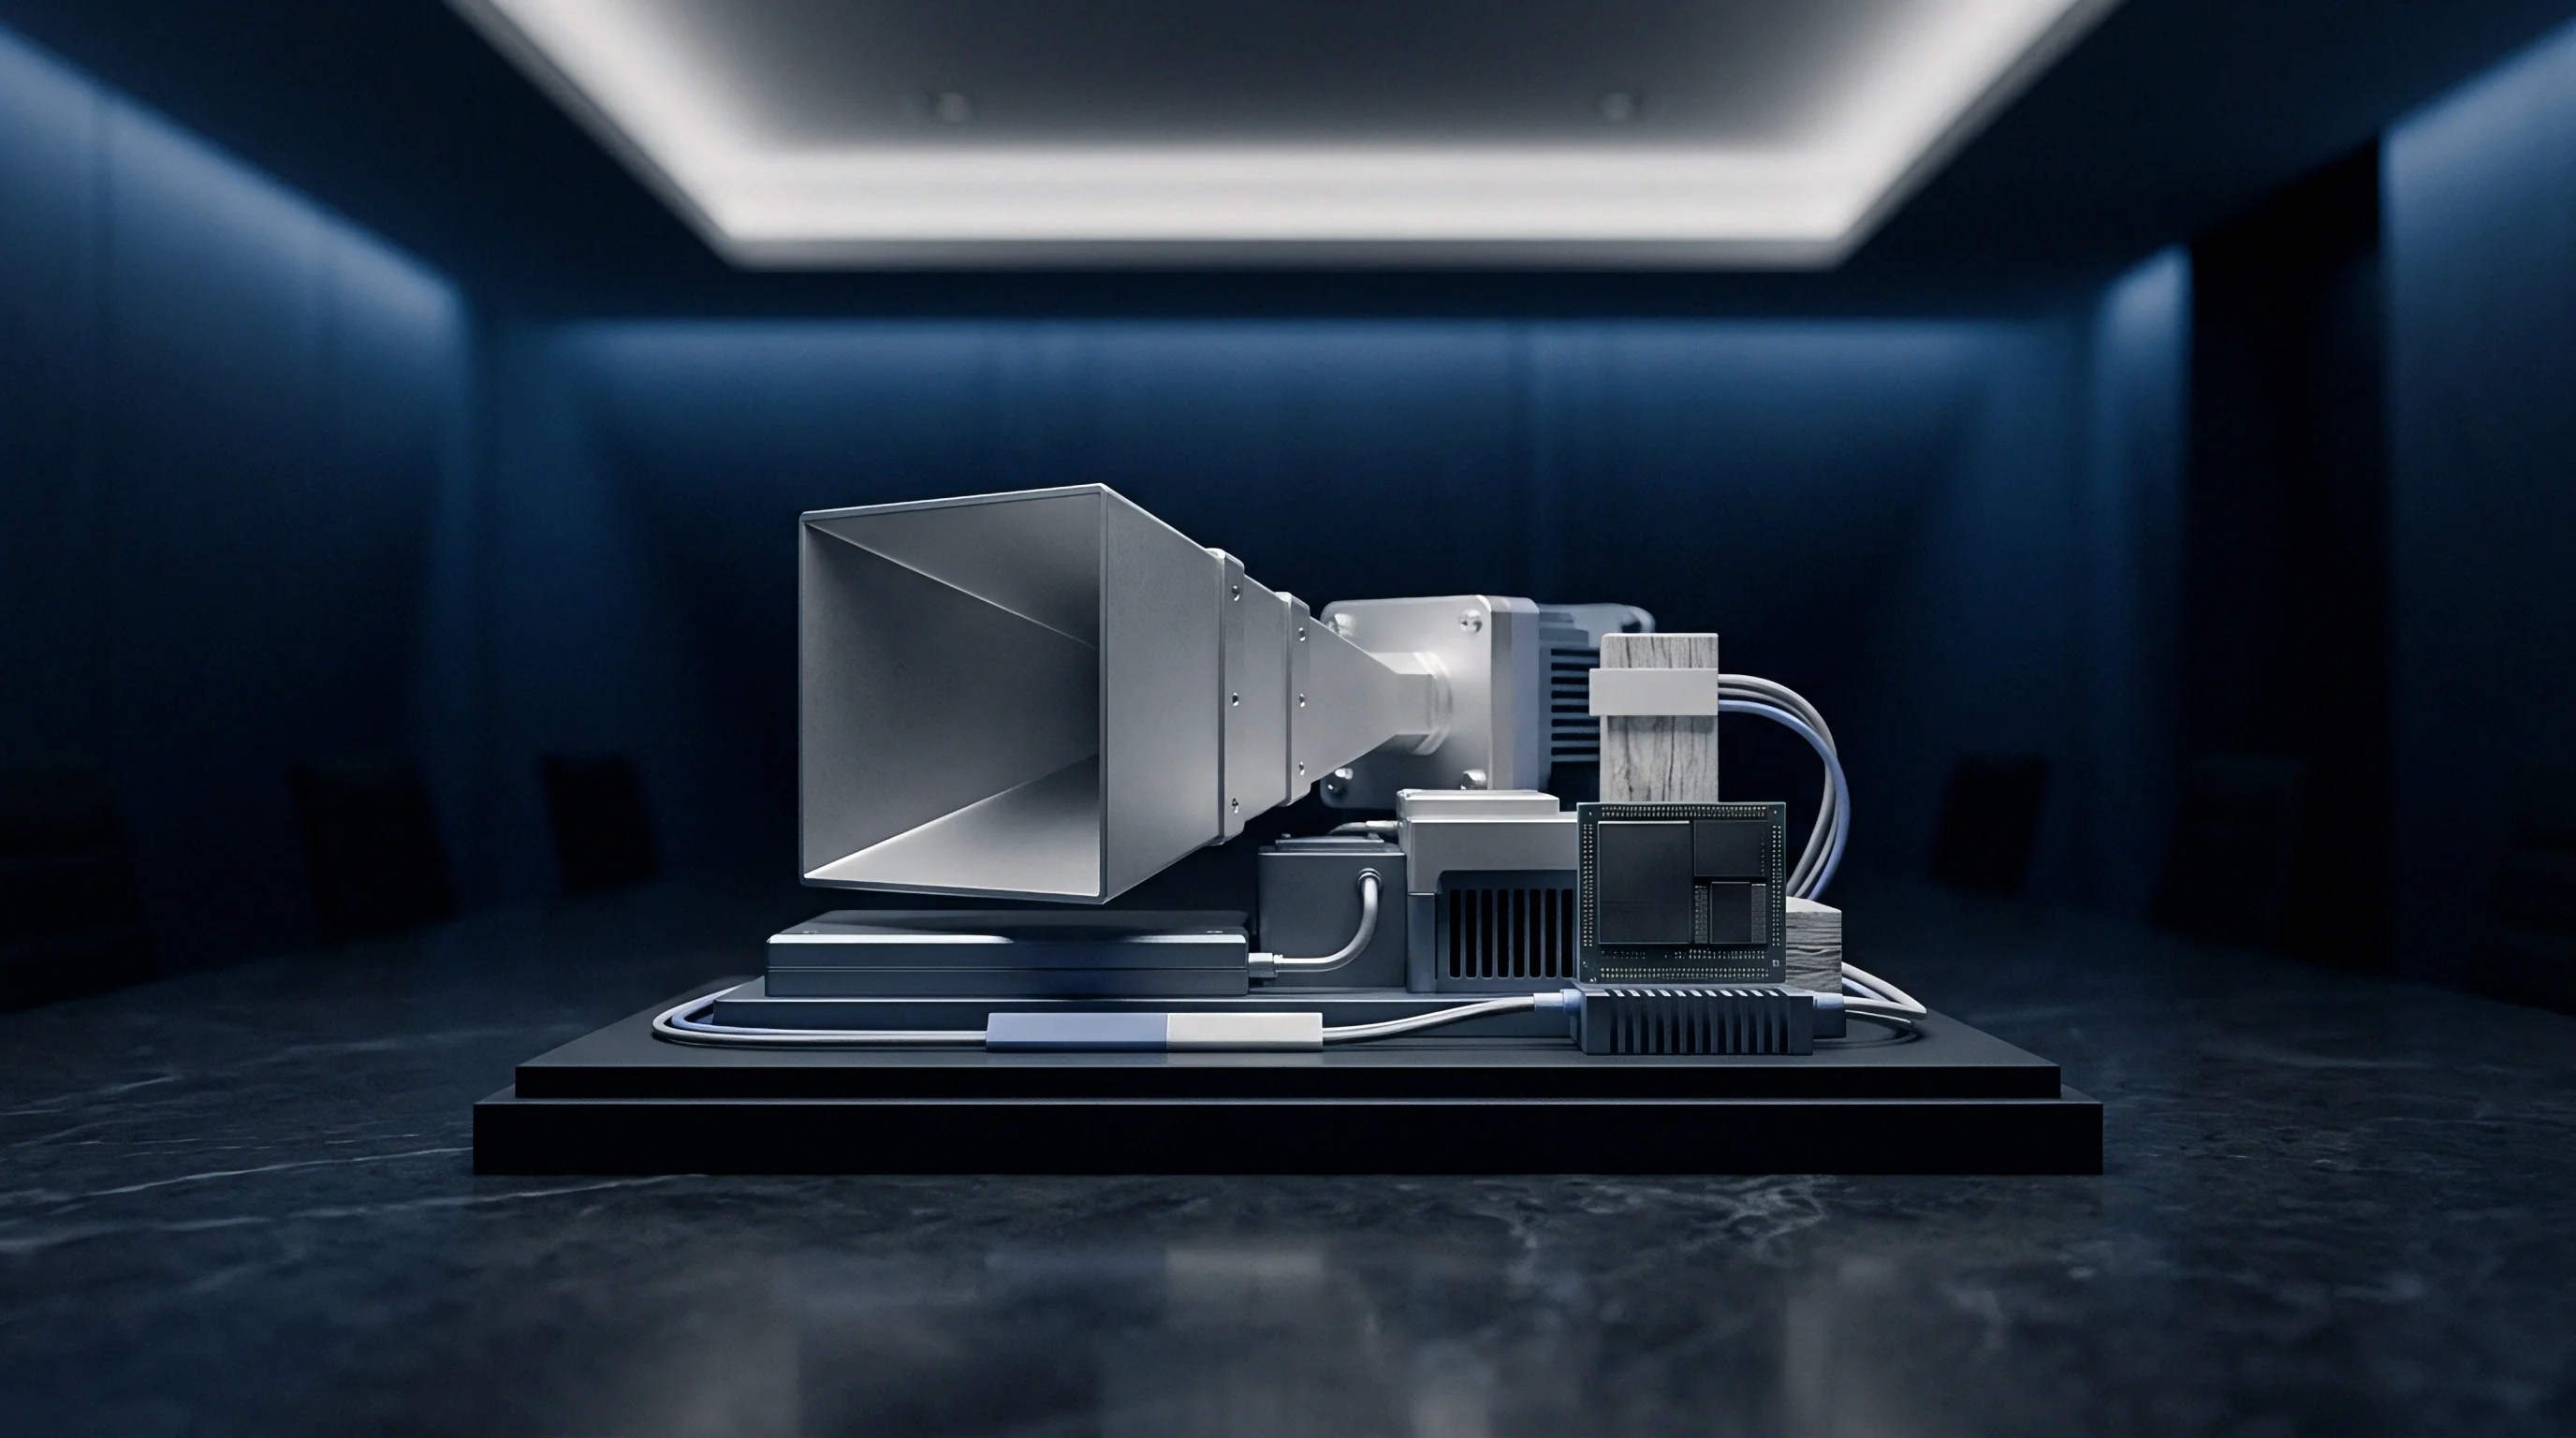
Geometric optical modeling identifies primary mirror points on chamber surfaces where absorber performance governs overall quietness. Ray tracing calculations compute reflection angles from the emitter location to every unshielded surface inside the enclosure. Specular reflection points receiving high angle-of-incidence radiation require higher-performance absorber profiles to maintain quiet volume boundaries.
Sidewall specular reflection points shift dynamically as receiving antennas move along vertical mast positions during emission scans. Higher antenna positions increase ray angles relative to sidewall surfaces, reducing absorber attenuation efficiency. Installing wedge absorbers or adjusting pyramid orientations at key reflection zones mitigates these high-angle specular reflections.
When qualifying internal pre-scan facilities, comparing broadband dipole response against theoretical free-space propagation exposes localized reflection zones that mathematical ray tracing models overlook due to ideal surface boundary assumptions. Misalignment here invalidates pre-scan sweeps.
Evaluation Parameter Checklist:
- Spatial Vector Geometry specifying six distinct line paths, including diagonal cross-sections across two elevation planes.
- Transmitter Antenna Directivity requiring isotropic radiation profiles to expose subtle enclosure surface reflection modes.
- Laser Alignment Calibration maintaining sub-millimeter positioning accuracy as test antennas travel across discrete measurement points.
- Frequency Step Density enforcing logarithmic frequency steps not exceeding one percent across six-gigahertz verification sweeps.
Unresolved reflection anomalies in high-frequency pre-scan rooms raise a fundamental technical question: can algorithmic post-processing of spectrum analyzer traces reliably compensate for physical specular reflections, or does digital trace smoothing merely conceal underlying spatial calibration defects?
Correlation
Relating pre-scan verification traces to full accredited laboratory measurements demands accounting for every source of measurement discrepancy. Pre-scan rooms often compromise on physical dimensions, absorber grade, or antenna positioning systems to fit facility budget constraints. Establishing a robust correlation factor translates preliminary laboratory observations into reliable predictions of accredited test success.
Without statistical correlation, pre-scan testing becomes guesswork. A product demonstrating six decibels of margin inside a compact pre-scan room can still fail accredited testing due to minor differences in quiet zone site voltage standing wave ratio or ground plane construction. Developing empirical correction factors bridges the gap between internal development benches and external test houses.
Uncertainty Budget Analysis for Pre Scan Chambers
Systematic errors arising from cable losses, antenna factor calibration drift, and ground plane tilt accumulate linearly. Random errors, such as impedance mismatch ripple and turntable positioning repeatability, combine quadratically in standard measurement uncertainty evaluations. Variations in cable routing can also alter results.
Developing an uncertainty budget requires quantifying individual standard uncertainties associated with the pre-scan environment. Antenna phase center movement, receiver amplitude non-linearity, and spatial field non-uniformity are major contributors to total combined uncertainty. Standard uncertainty components multiplied by sensitivity coefficients yield expanded uncertainty values at defined confidence levels.
Initial host evaluations revealed a 3.8 dB discrepancy between pre-scan predictions and full qualification test data. A root-cause investigation traced this error directly to uncalibrated phase center offsets in low-cost broadband bilog antennas used during preliminary emission sweeps. Correcting the antenna positioning logic eliminated the correlation gap across all higher harmonic frequencies.
| Uncertainty Source | Probability Distribution | Standard Uncertainty (dB) | Sensitivity Coefficient |
|---|---|---|---|
| Antenna Factor Calibration Drift | Normal (k = 2) | 0.35 | 1.0 |
| Quiet Zone Field Non-Uniformity | Rectangular | 1.15 | 1.0 |
| Receiver Amplitude Accuracy | Normal (k = 1) | 0.20 | 1.0 |
| Impedance Mismatch (Antenna/Cable) | U-Shaped | 0.45 | 1.0 |
| Turntable Height Positioning Error | Rectangular | 0.15 | 1.0 |
| Combined Standard Uncertainty | Normal | 1.32 | 1.0 |

Translating Pre Scan Data to Certification Results
Margin allocations offset physical chamber deficiencies against formal test house capabilities. When pre-scan quiet zone verification reveals a four-decibel field variation across the turntable volume, product engineering teams must apply an equivalent four-decibel guard band to all development limit lines. Conservative guard bands prevent false compliance pass conclusions.
Comparative testing strategies use reference emitters, such as battery-powered comb generators, to establish empirical baseline offsets between internal pre-scan facilities and external accredited chambers. Measuring a stable reference source in both environments generates a frequency-dependent correction mask. Applying this mask to pre-scan product traces aligns internal measurement views with external test house results.
Pre-scan measurements in an unverified quiet space convert lab turnaround time into regulatory delay.
Verification Log Documentation Requirements:
- Absolute Frequency Calibration Data identifying receiver clock stability and resolution bandwidth filter accuracy across operational bands.
- Antenna Phase Center Offsets tracking physical geometric variations across the full frequency range.
- Environmental Ambient Records documenting ambient temperature, relative humidity, and RF background noise levels during verification sweeps.
- Comb Generator Reference Traces establishing historical repeatability lines for baseline chamber reflection characteristics.
Applying empirical correlation factors without updating physical quiet zone calibrations works effectively until the physical dimensions of the test sample exceed the calibrated boundary.

Validation
Routine periodic checks confirm that internal test environments remain within acceptable performance tolerances over time. Physical wall settling, absorber degradation, connector wear, and environmental drift alter chamber electromagnetic characteristics. Implementing a structured verification program ensures early detection of quiet zone degradation before invalid test data leads to costly product launch delays.
Pre-scan validation differs from formal accreditation recalibration in scope and execution frequency. While full site attenuation calibrations occur every two to three years due to high cost and downtime, internal pre-scan validation checks run on monthly or quarterly schedules to maintain continuous confidence between formal calibration cycles.

Reference Emitter Comparison Standards
Comb generators emit stable broadband harmonic comb lines that serve as physical transfer standards across operational bands. These self-contained, battery-operated signal sources radiate highly repeatable RF amplitude profiles across wide frequency spectra. Placing a reference comb generator at the turntable origin provides an instant check of overall system response.
Comparing daily comb generator traces against baseline reference scans detects system failures immediately. A sudden drop in signal amplitude across a specific frequency band indicates cable damage, antenna connector oxidation, or localized absorber failure, while unexpected spikes or mismatches can signal ambient noise floor changes or loose connections.
Positioning reference emitters at off-center locations within the quiet cylinder checks volumetric repeatability. Rotating the comb generator through four ninety-degree positions exposes turntable alignment shifts and localized wall reflection changes. Recording these offset traces establishes an ongoing trend analysis matrix for facility health monitoring.
Recalibration Schedules and Maintenance Records
Documenting environmental stability and physical wall integrity creates an unbroken audit trail for internal compliance verification. Maintenance logs track mechanical repairs, absorber replacements, cable changes, and antenna recalibration dates. Keeping complete historical records allows engineering teams to correlate unexpected product test variances with physical facility changes.
When physical modifications occur inside the enclosure, such as adding new filter panels or replacing damaged absorber foam, immediate quiet zone re-verification is necessary. Skipping validation after structural changes invalidates historical correlation factors and exposes ongoing pre-scan testing to unquantified measurement errors.
Establishing baseline quietness is a continuous engineering discipline rather than a single installation milestone. Facility operators who maintain rigorous periodic verification protocols ensure that preliminary internal scans align reliably with final accredited certification sweeps, protecting product development schedules and regulatory budgets.