Permittivity Extraction Methods for Millimeter Wave Radome Design
Accurate millimeter-wave radome permittivity extraction requires free-space or cavity testing to prevent transmission losses and costly regulatory re-filings.
Slab
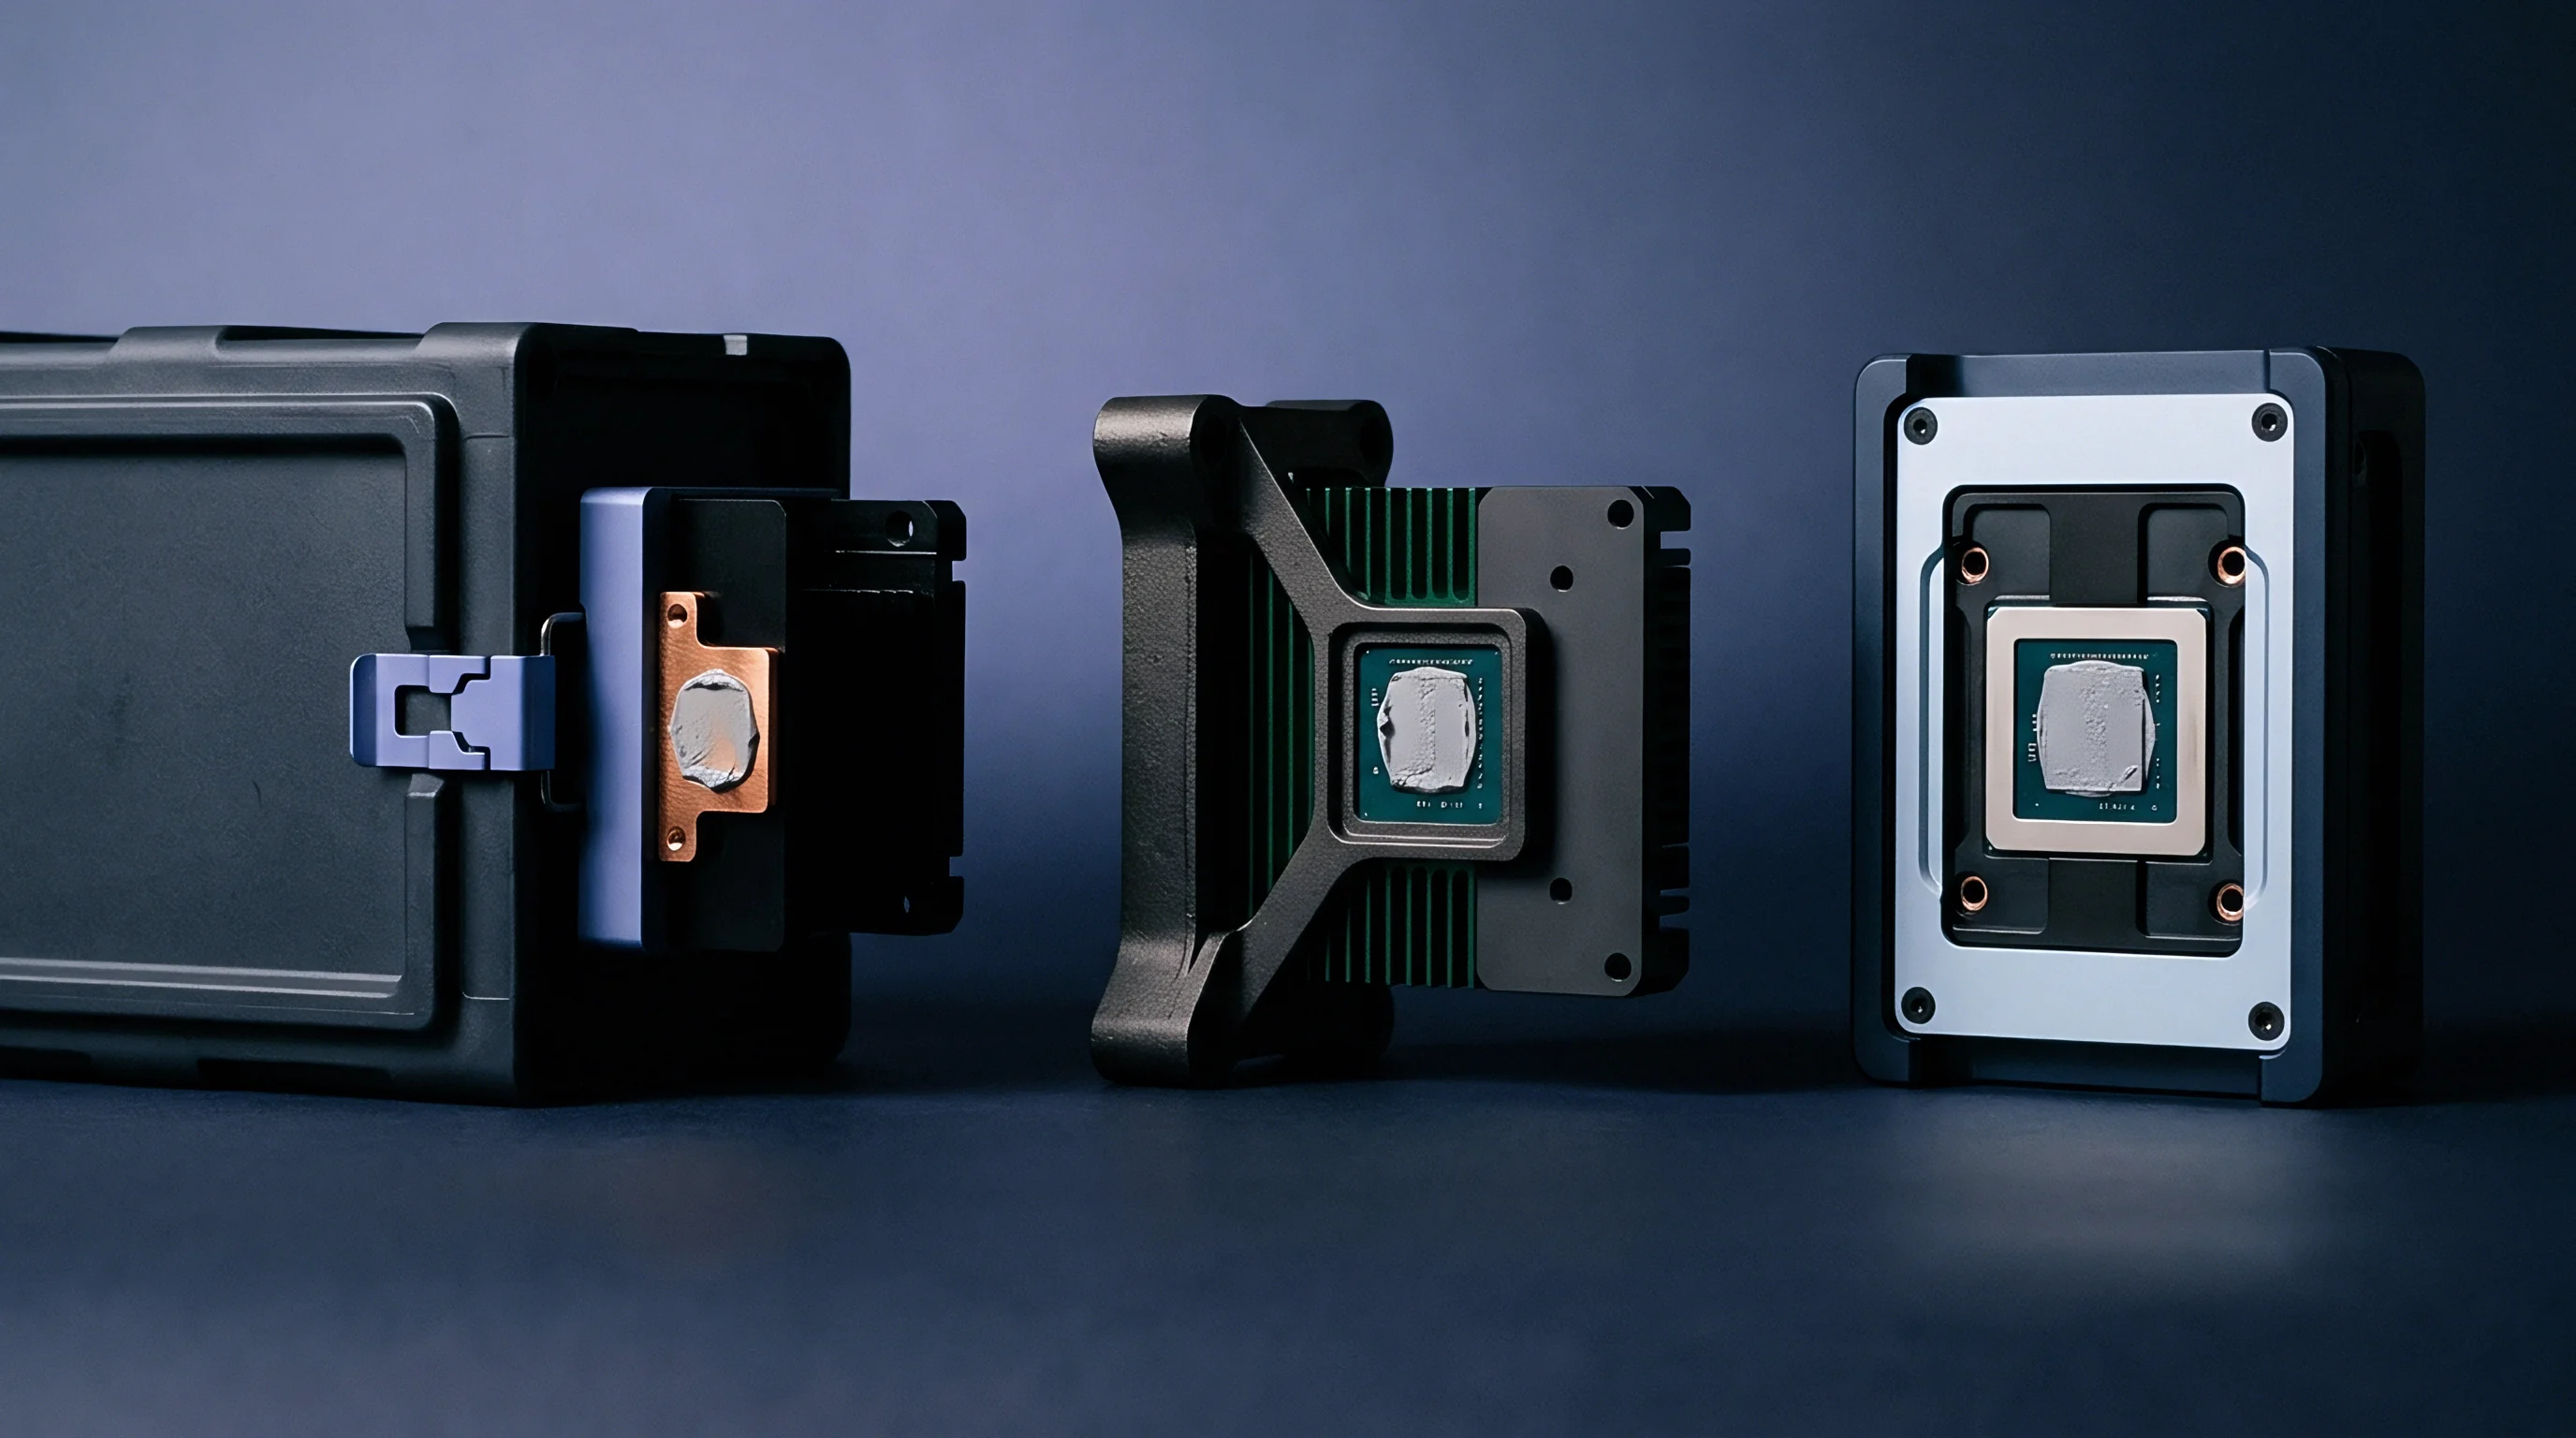
Evaluating planar dielectric specimens between 24 GHz and 81 GHz sets the baseline transmission and reflection coefficients for protective radio enclosures. At millimeter-wave frequencies, electromagnetic fields interact directly with a polymer matrix’s molecular structure. Inside the dielectric, phase velocity drops with the square root of real permittivity, while energy dissipates through relaxation mechanisms captured by imaginary permittivity ~ the loss tangent.
Designing a radome wall comes down to matching physical thickness to this internal wave velocity so signal phases do not cancel across the antenna aperture.
Characterizing complex relative permittivity requires separating real phase storage from imaginary loss. Low-frequency capacitance bridges and 1 GHz impedance analyzers cannot predict how materials respond in the 76 GHz to 81 GHz automotive radar band. Polymer chains undergo distinct relaxation modes below gigahertz frequencies, while polar additives and micro-moisture introduce frequency-dependent dispersion.
Relying on low-frequency data sheets for raw resins introduces substantial error into calculated radome transmission efficiency.
A radome wall functions as an impedance transformer between free space and the antenna feed structure. For a single-layer half-wavelength design, calculating optical thickness depends on accurate dielectric extraction. At normal incidence, the fundamental thickness equation for zero reflection relies directly on real permittivity:
d = m c0 / (2 f sqrt(e’))
Here d represents physical wall thickness in meters, m represents integer order, c0 represents speed of light in vacuum, f represents operating center frequency in Hertz, and e’ represents real relative permittivity. A shift in measured e’ from 2.80 to 2.95 at 77 GHz reduces optimal thickness by 28 micrometers. Because mechanical manufacturing tolerances often fall in this exact range, accurate permittivity extraction is critical to radome structural design.
| Material Grade | Test Frequency (GHz) | Real Permittivity (e’) | Loss Tangent (tan d) | Moisture Absorption (% wt) | Thermal Expansion (ppm/K) |
|---|---|---|---|---|---|
| Polybutylene Terephthalate 30% Glass | 77.0 | 3.12 | 0.0075 | 0.15 | 35 |
| Polycarbonate Unfilled | 77.0 | 2.82 | 0.0092 | 0.20 | 65 |
| Acrylonitrile Butadiene Styrene | 77.0 | 2.68 | 0.0140 | 0.30 | 85 |
| Liquid Crystal Polymer 30% Glass | 77.0 | 3.45 | 0.0038 | 0.04 | 12 |
| Polytetrafluoroethylene Unfilled | 77.0 | 2.06 | 0.0004 | 0.01 | 130 |
| Automotive Polyurethane Basecoat Layer | 77.0 | 4.25 | 0.0450 | 1.10 | 110 |
Selecting materials involves balancing RF transparency against mechanical rigidity and environmental durability. Glass-fiber-reinforced polybutylene terephthalate provides the structural stability needed for front bumper mounting, though fiber alignment causes local variations in permittivity. Liquid crystal polymers achieve exceptionally low loss tangents at 77 GHz, but high resin costs limit high-volume use.
Unfilled polycarbonate offers consistent isotropic performance over wide scan angles, though moisture absorbed in the field raises baseline dielectric loss.
A nominal dielectric constant shift from 2.80 to 2.95 at 77 GHz increases wall reflection by 4.2 dB for a 1.12 millimeter PBT slab.
Phase velocity drops in higher-permittivity media, where thicker walls store reactive energy and standing waves introduce ripple across antenna passbands. Reflections back into radar transceivers degrade both transmitter spectrum purity and receiver noise floor performance. Molding radome housings without measured permittivity data risks severe beam misalignment, leading to field returns and costly late-stage tooling revisions.

Resonance
Quasi-optical free-space systems and electromagnetic cavity resonators isolate dielectric properties through different physical mechanisms. Choosing between them depends on sample geometry, operational frequency, and whether loss tangent or real permittivity dominates the error budget. Free-space methods measure scattering parameters across broad frequency sweeps, whereas cavity resonators track frequency shifts and quality factor changes at discrete resonant modes.
Free-space reflection and transmission testing uses focused horn antennas equipped with dielectric lenses. A vector network analyzer records complex scattering parameters S11 and S21 across waveguide bands like WR-15 (50 to 75 GHz) or WR-10 (75 to 110 GHz). Conversion models like the Nicolson-Ross-Weir routine transform magnitude and phase measurements into complex permittivity, though these algorithms suffer numerical phase instability when sample thickness approaches integer multiples of the internal half-wavelength.
Unwrapping routines resolve these divergence points to keep phase jumps from corrupting the extracted data.
Measurement Precision at 77 GHz
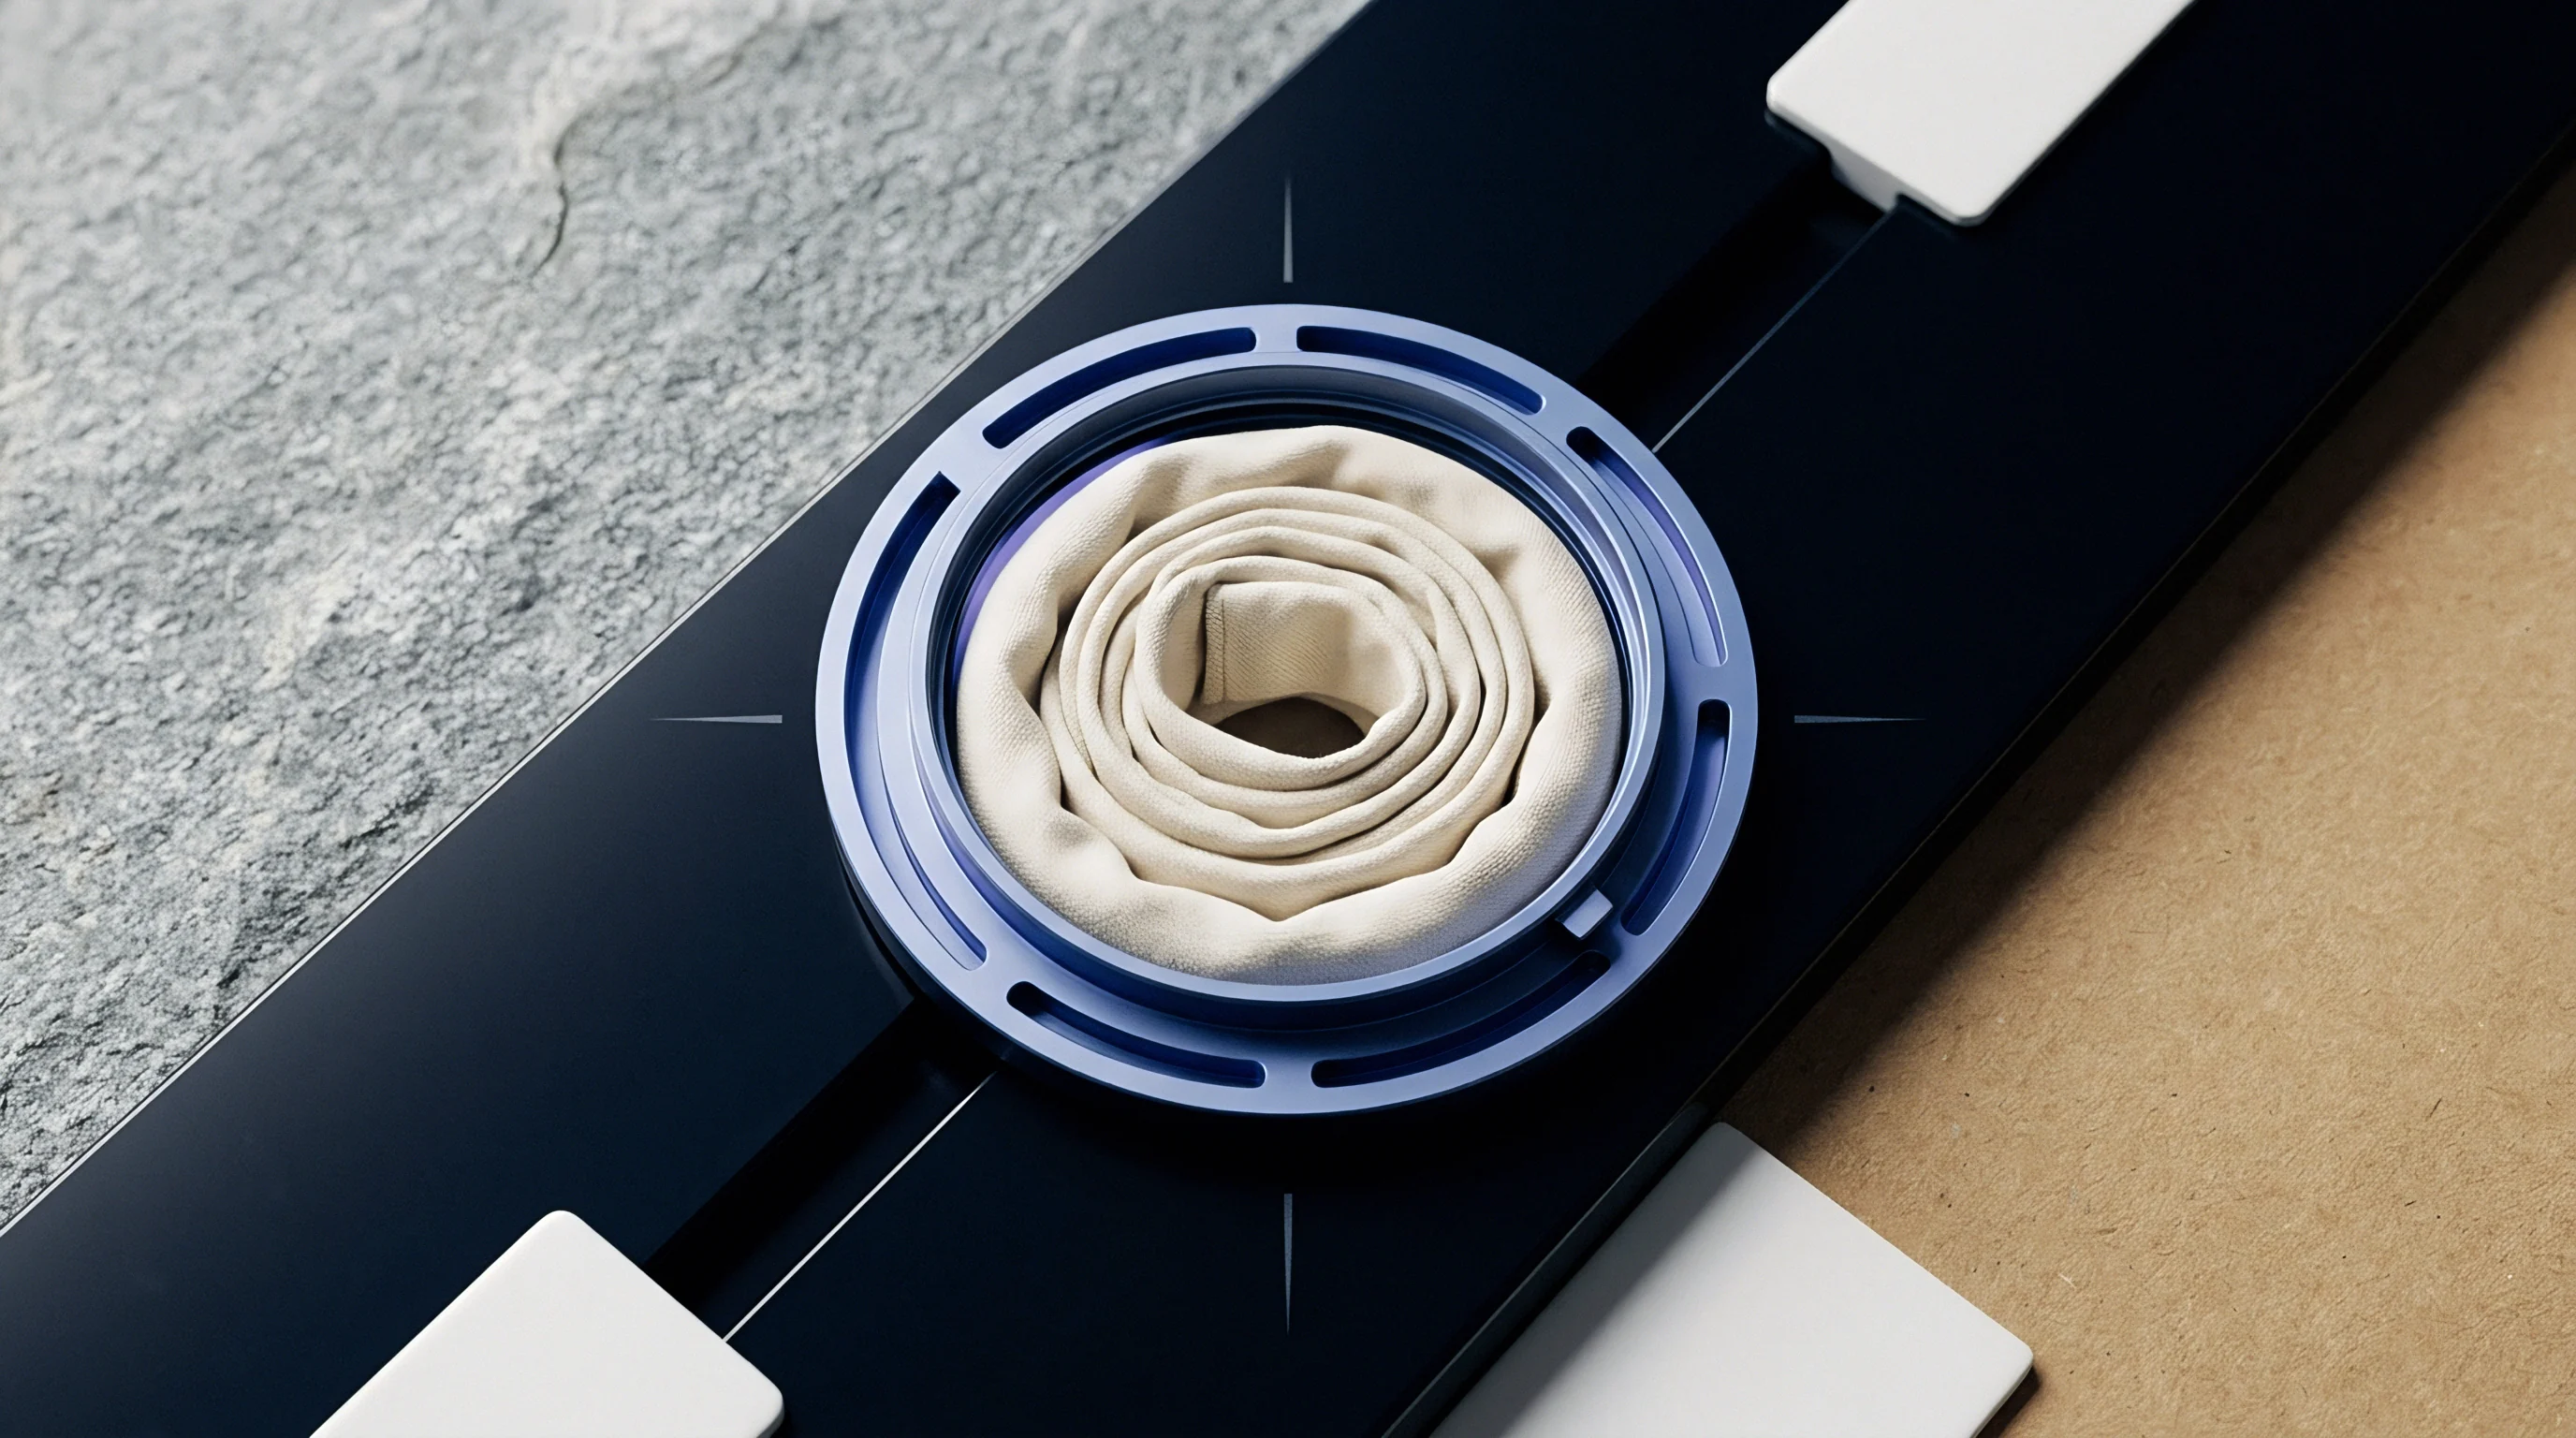
Split-cylinder cavity resonators deliver high precision when evaluating low-loss materials. Operating in TE011 circular cavity modes, the system determines dielectric properties by measuring shifts in resonant frequency and quality factor upon inserting a coupon. Frequency drop yields real permittivity e’, while Q-factor degradation indicates loss tangent tan d.
With loss tangent resolution reaching 0.0001, split-cylinder cavities outperform free-space benches by an order of magnitude on thin planar specimens.
- Calibrated Scattering Vector Acquisition captures complex reflection and transmission matrices over target millimeter-wave sweeps inside an anechoic chamber.
- Phase Unwrap and Root Selection resolves integer phase ambiguities that arise when sample thickness exceeds half the internal wavelength.
- Iterative Conversion Processing solves non-linear wave propagation equations to extract complex permittivity without mathematical singularities.
- Time Domain Gating Filter removes parasitic multipath reflections caused by lens fixtures and chamber walls.
- Uncertainty Matrix Evaluation combines thickness measurement error with network analyzer phase drift into overall tolerance bounds.
Fabry-Pérot open resonators extend cavity-level accuracy into W-band and D-band ranges. Using a pair of mirrors ~ one spherical and one flat ~ they operate at higher-order Gaussian modes, focusing field energy at the center of the sample. Confining the field within the Gaussian beam waist eliminates edge diffraction.
Because open resonators require no physical contact between coupon edges and metallic cavity walls, they avoid the air-gap errors common to closed waveguides.
Thicker radome walls store reactive energy, narrowing operational bandwidth and compounding phase sensitivity.
Closed waveguide fixtures require precise machining of test coupons. A 10-micrometer air gap between a polymer specimen and a WR-10 waveguide wall causes significant electric field depolarization, underreporting real permittivity by 12 percent. Free-space optical setups avoid custom coupon cutting by accommodating larger panels, though beam spot size constrains low-frequency measurement limits.
If sample size falls below three times the focused beam waist diameter, edge diffraction corrupts the data. Ultimately, cavity methods offer better loss tangent precision for small coupons, while free-space benches are better suited for testing complete, finished radome panels over wide frequency sweeps.

Bench
Achieving sub-millimeter phase accuracy requires rigid mechanical fixtures and stable climate control in the lab. Vector network analyzers running at 77 GHz drift when ambient temperatures swing or coaxial cables flex. Extending reference calibration planes directly to the antenna horn faces requires Thru-Reflect-Line or Line-Reflect-Line calibration standards tailored for free-space benches.
Focusing lenses concentrate RF energy into a localized Gaussian spot. Lens geometry dictates both Rayleigh length and beam waist location. Positioning coupons directly at the beam waist preserves planar phase fronts across the specimen surface.
A tilt misalignment of just 0.5 degrees relative to the propagation axis shifts the phase delay vector, distorting the calculated real permittivity.
Thickness Sensitivity in Permittivity Extraction
Physical thickness uncertainty contributes more to extraction error than any other variable. At 77 GHz in air, wavelength is 3.896 millimeters; inside a polymer with e’ of 3.0, it shrinks to 2.249 millimeters. An error of just 10 micrometers in thickness measurement causes a 1.6 percent error in real permittivity.
Using digital micrometers fitted with spherical ball-anvils prevents soft polymer compression during pre-test verification.
| Error Mechanism | Dominant Parameter Affected | Typical Extraction Impact | Bench Mitigation Strategy |
|---|---|---|---|
| Air Gap at Waveguide Interface | Real Permittivity (e’) | -8% to -15% artificial drop | Precision CNC sample milling with optical edge inspection |
| Coupon Angular Misalignment | Transmission Phase Vector | +1.2% to +3.5% e’ shift | Kinematic optical stages with laser auto-collimation |
| Beam Spot Edge Diffraction | Loss Tangent (tan d) | +0.0050 loss overestimation | Absorptive aperture masking and beam spot ratio control |
| Thermal Cable Phase Drift | S21 Phase Stability | 4.5 degrees phase error at 77 GHz | Phase-stable semi-rigid cabling and thermal chamber stabilization |
| Moisture Content Absorption | Loss Tangent (tan d) | +0.0035 per 0.1% water weight | Controlled humidity desiccators and sample baking protocols |
Time-domain gating isolates primary transmission paths from unwanted parasitic reflections. Network analyzers capture wideband frequency responses, convert the data into the time domain, gate the direct transmit pulse, and transform the result back into frequency-domain S-parameters. This suppresses reflection spikes caused by horn flanges, mounting hardware, and chamber boundaries.
- Air Gap Displacement reduces capacitance across waveguide interfaces, artificially depressing measured real permittivity values.
- Beam Spot Truncation causes parasitic diffraction along specimen edges, distorting high-frequency transmission spectra.
- Thermal Chamber Drift alters antenna geometry and shifts phase reference planes during temperature sweeps.
- Phase Cable Deformation introduces phase noise during sample handling, corrupting calibration integrity.
Ambient lab conditions directly alter dielectric behavior during testing. Polymers absorb atmospheric humidity, driving up loss tangents because water molecules have a strong dipole moment at millimeter wavelengths. Keeping relative humidity between 45 and 50 percent stabilizes sample moisture levels, while controlling temperature prevents thermal expansion from altering coupon thickness and polymer chain density.
Calibration establishes the reference plane, but nominal low-frequency data sheets fail for millimeter-wave design by ignoring dispersion and moisture-induced shifts.
Compliance under ETSI EN 302 264 Clause 7.1 invalidates test reports where radome physical housing substitutions exceed declared permittivity tolerances.
Tolerance
Molding variations, multi-coat paint applications, and uneven filler distribution alter the intended phase front of millimeter-wave radar beams. Radomes must keep beam pointing accuracy within narrow limits. Boresight error ~ the angular difference between the mechanical axis and the peak electromagnetic beam ~ increases when raw resin dielectric constant shifts, disrupting phase distribution across the aperture and degrading vehicle tracking algorithms.
Multi-coat automotive finishes add complex dielectric layers over the structural substrate. Metallic flakes in clear-coats and basecoats act as conductive inclusions that align with mold flow lines, creating anisotropic dielectric loss. Aluminum-pigmented basecoats can reach effective real permittivity values over 6.0 and loss tangents up to 0.080 at 77 GHz.
Even a 5-micrometer variation in paint thickness alters phase delay across the radome, steering the antenna main-lobe pattern off target.
Consider a 77 GHz radar operating behind a polybutylene terephthalate (PBT) bumper fascia with nominal thickness d of 1.125 millimeters, real permittivity e’ of 2.85, and loss tangent tan d of 0.008 at 77 GHz. Free-space wavelength is 3.893 millimeters, shrinking to an internal wavelength of 2.306 millimeters inside the PBT. Under these baseline conditions, wall thickness equals 0.488 internal wavelengths, delivering 90.2 percent single-pass transmission efficiency (-0.45 dB insertion loss) with a phase delay of 175.6 degrees.
If raw resin permittivity shifts upward by 7.0 percent to e’ = 3.05 while mold wall thickness drifts by 60 micrometers to d = 1.185 millimeters, the internal wavelength contracts to 2.229 millimeters. Fascia thickness becomes 0.531 internal wavelengths, detuning the half-wavelength matching condition. Transmission efficiency drops to 52.5 percent (-2.80 dB insertion loss) ~ an added 2.35 dB loss on the transmit path ~ while return loss degrades from -22.0 dB to -7.5 dB, reflecting substantial RF energy back into the patch array.
Phase delay through the fascia climbs to 191.2 degrees, creating a 15.6-degree localized phase shift across the transmission aperture. On a phased array antenna with a 10-millimeter aperture width, this distortion shifts the main-lobe pointing angle by 1.4 degrees. Boresight error increases as main-lobe gain drops, contracting maximum radar detection range by 12.6 percent and pushing radiated field strength below certified limits, invalidating type approval baseline declarations.
- Batch Dielectric Verification confirms raw resin complex permittivity stays within design limits across incoming shipments.
- Thickness Distribution Mapping checks wall thickness uniformity across the full antenna radiation aperture.
- Paint System Attenuation Scanning quantifies insertion loss added by multi-coat automotive finishes.
- Environmental Moisture Exposure Testing evaluates dielectric drift following thermal and humidity aging cycles.
Re-certification triggers depend on regulatory threshold breaches. When shifts in material permittivity alter radiated field strength or spurious emission levels, existing Grants of Authorization no longer cover the integrated host assembly. Changing resin suppliers or paint formulations requires evaluation under permissive change rules.
Under FCC Part 2 Section 2.1043, a permittivity shift that degrades field strength beyond allowable limits triggers a formal Class II permissive change filing rather than a simple internal engineering record entry.
Metallic paint flakes align along moulding flow lines, introducing severe dielectric anisotropy across radar beam apertures.

Audit
Regulatory compliance filings submitted to spectrum authorities rely directly on documented dielectric characterization. Radome-integrated transceivers operating in the 76 GHz to 81 GHz band require type approval across major international markets, with regulatory bodies mandating compliance under standards like FCC Part 95M (US), ETSI EN 302 264 and ETSI EN 301 091-1 (Europe), MIC Ordinance 49-20 (Japan), and SRRC radar regulations (China).
Accredited test reports document peak equivalent isotropically radiated power, occupied bandwidth, and radiated spurious emissions. Mounting a radar module behind an unapproved housing alters radiation patterns, affecting peak gain and side-lobe suppression. Regulators evaluate whether the radome functions as an integral antenna element or merely a protective enclosure; if it alters directivity, test labs must evaluate the transceiver and housing as a single unit.
| Target Region | Regulatory Authority | Governing Standard | Sample Requirements | Standard Chamber Testing Lead Time | Filing Fee Range (USD) |
|---|---|---|---|---|---|
| United States | FCC | Part 95M / KDB 996369 | 3 Complete Host Assemblies with Radome | 2 to 3 Weeks | 4,500 to 7,500 |
| European Union | Notified Body / RED | ETSI EN 302 264 / EN 301 489-51 | 2 Conducted, 2 Radiated Assemblies | 3 to 4 Weeks | 6,000 to 10,000 |
| Japan | MIC / Telec | Ordinance 49-20 / Annex 42 | 2 Sealed Final Units with Paint Finish | 3 to 5 Weeks | 5,500 to 8,500 |
| China | SRRC | SRRC Radar Type Approval Rules | 4 Complete Finished Product Samples | 6 to 8 Weeks | 9,000 to 14,000 |
| South Korea | RRA / KC | KS X 3123 / Radar Clause | 2 Units with In-Country Testing | 4 to 6 Weeks | 7,000 to 11,000 |
Chamber availability dictates product launch timing. Securing millimeter-wave test slots requires 6 to 10 weeks advance booking during peak qualification quarters, making failed tests expensive and keeping unapproved modules tied up in warehouses. Failing a radiated spurious emission scan from unexpected radome harmonic generation can delay market launch by up to 14 weeks once chamber re-booking lead times and housing tooling revisions are factored in.
Verifying compliance documentation upfront avoids enforcement actions later. Certificates claiming module pre-approval often cover only the bare OEM circuit board, not the radome assembly. Installing that module behind a painted bumper or custom fascia invalidates original grant parameters.
Procurement teams should require accredited test dossiers verifying compliance behind the exact material, wall thickness, and paint specification used in production.
Commercial contracts should require consistent raw material permittivity across all production lots. Quality control protocols ought to mandate split-cylinder resonator verification for incoming resin batches, tying supplier payment milestones to dielectric validation reports. Whether spectrum regulators will eventually mandate non-destructive in situ testing for painted bumper assemblies remains an open question for international type approval bodies.