Quantifying Polymer Dielectric Loss at Millimeter Wave Radar Frequencies
Dielectric loss quantification at 77 GHz demands Fabry-Perot resonator testing to prevent radome signal attenuation and regulatory EIRP filing failures.
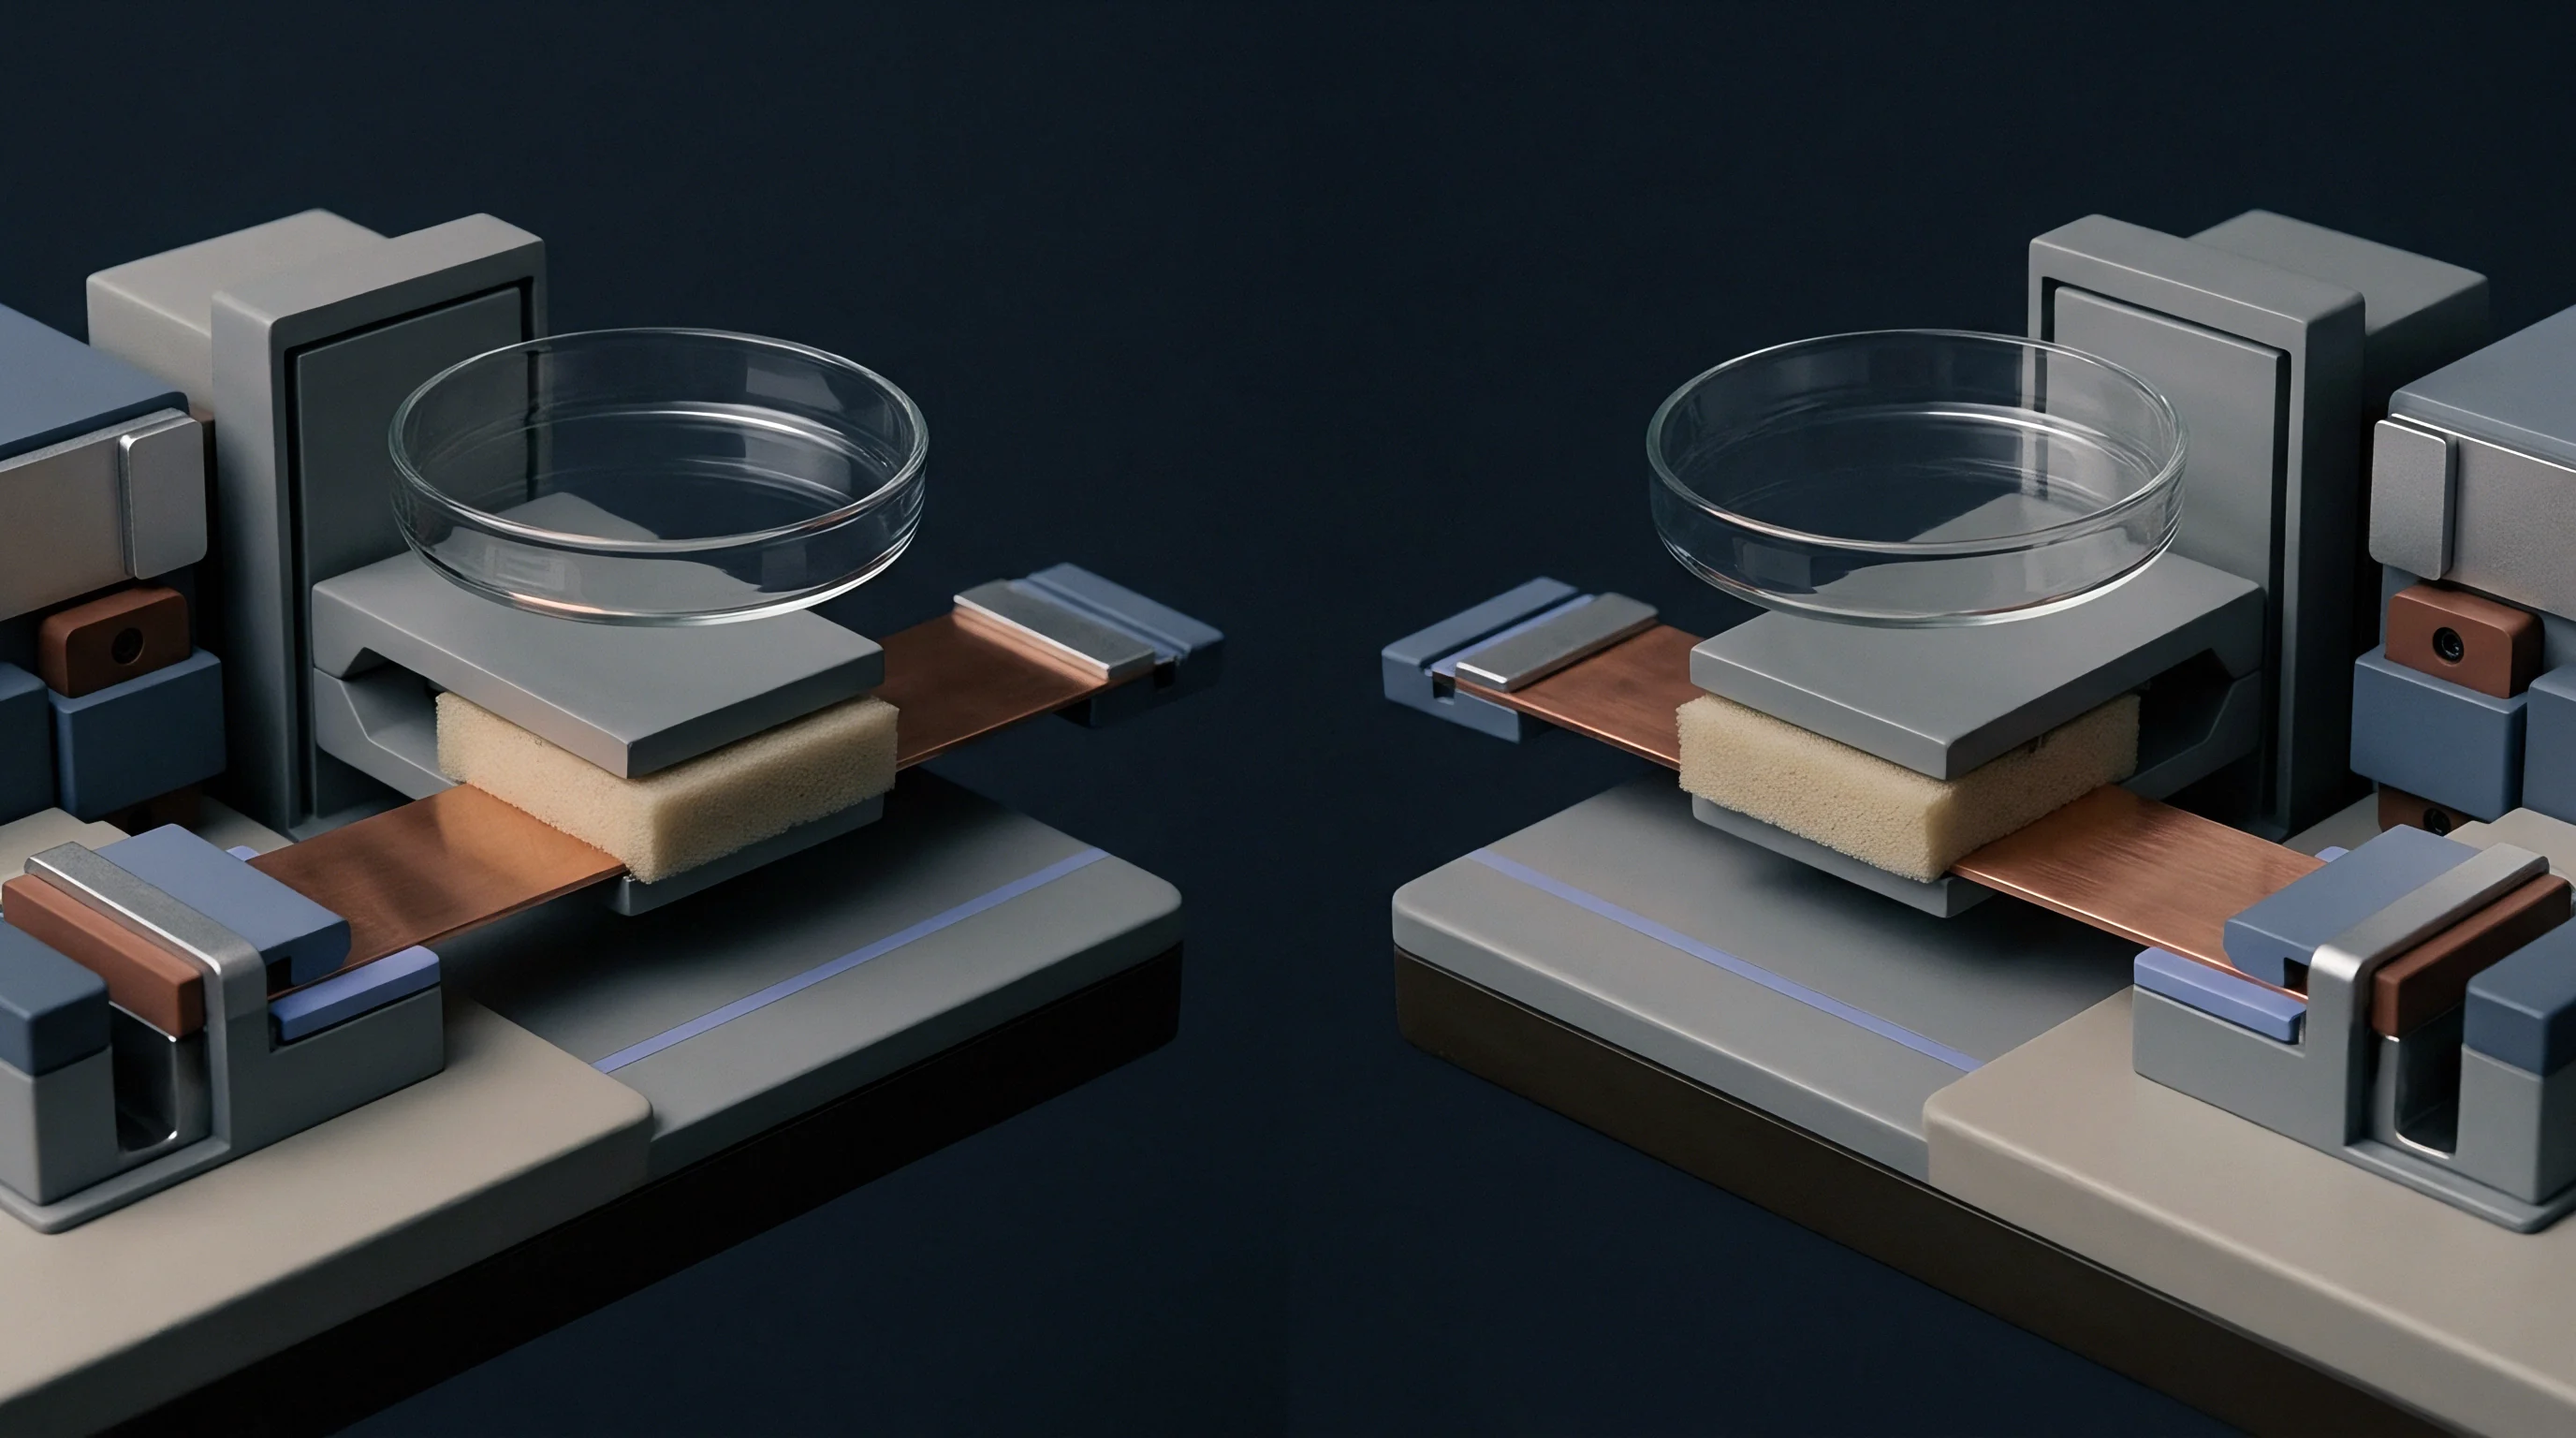

Cavity
Precision dielectric measurements in the 76 GHz to 81 GHz automotive radar spectrum require electromagnetic resonance containment systems designed for sub-millimeter wavelengths. Standard coaxial probes and microstrip transmission lines introduce radiation leaks, conductor attenuation, and severe calibration uncertainties at frequencies above 30 GHz. Quantifying the complex relative permittivity and dissipation factor, commonly designated as dielectric loss tangent or loss factor, demands specialized resonant fixtures that isolate material losses from system copper losses.
Dielectric loss tangent reflects the ratio of imaginary permittivity to real permittivity within a polymer matrix. At millimeter-wave frequencies, electromagnetic energy excites rotational and vibrational modes within macromolecular chains, converting high-frequency radio waves directly into thermal energy. High dissipation factors attenuate transmitted signals, broaden radar antenna beamwidths, and reduce range detection accuracy.
Phase errors destroy range resolution.

Fabry Perot Open Resonator Physics
Spherical mirror configurations operating at millimeter frequencies establish highly localized standing wave patterns within a defined beam waist. A Fabry-Perot open resonator uses two highly polished metallic mirrors, typically spherical or planar concave, separated by a precise distance to form a Gaussian beam mode. Placing a planar polymer sample at the cavity center alters the resonant frequency and depresses the quality factor of the cavity mode.
Vector network analyzers coupled to wave-guide feed horns sweep through TEM-00-q Gaussian modes from 75 GHz to 110 GHz. The shift in resonant frequency directly yields the real relative permittivity, while the change in the inverse quality factor isolated from mirror ohmic losses yields the dissipation factor. Because electromagnetic fields concentrate within the central waist of the Gaussian beam, open resonators eliminate edge diffractions and contact resistance issues.
This method achieves loss tangent resolution down to 0.0001, making it the primary reference standard for low-loss automotive radar housing materials.
Measuring a 1.5 millimeter polybutylene terephthalate plaque at 77 GHz in a Fabry-Perot open resonator yields a real permittivity of 2.74 and a loss tangent of 0.0038 under controlled conditions at 23 degrees Celsius.

Split Post and Quasi Optical Alternatives
Narrowband fixture geometries face physical limitations when dimensions drop below standard substrate thicknesses. Split-post dielectric resonators operate effectively up to 20 GHz, but high-frequency scaling requires microscopic cavity dimensions that are difficult to machine and load. Consequently, free-space quasi-optical systems provide a viable alternative for wideband continuous frequency sweeps between 60 GHz and 110 GHz.
Quasi-optical benches employ horn antennas combined with dielectric lenses to focus a collimated electromagnetic wave onto a large polymer plaque. Spot size control prevents diffraction around sample edges. Time-domain gating inside the vector network analyzer isolates primary transmission paths from multi-path reflections inside the test environment.
While quasi-optical free-space systems offer continuous broadband permittivity maps, their sensitivity floor for loss tangent remains around 0.001, which is ten times less sensitive than a high-Q Fabry-Perot cavity.
Microstrip ring resonators integrated onto printed circuit boards represent a planar evaluation route. While useful for substrate characterization, ring resonators blend dielectric loss with conductor surface roughness loss. Removing copper foil effects requires complex mathematical deembedding models, introducing measurement uncertainties that obscure small material loss differences.
| Measurement Technique | Loss Tangent Sensitivity Floor | Real Permittivity Uncertainty | Sample Thickness Constraint | Primary Operational Constraint |
|---|---|---|---|---|
| Fabry-Perot Open Resonator | 0.0001 | +/- 0.5% | 0.5 mm to 3.0 mm | Requires plane-parallel surface polish |
| Quasi-Optical Free Space | 0.0010 | +/- 1.5% | 1.0 mm to 6.0 mm | Demands large sample area to avoid edge diffraction |
| Split-Cavity Resonator | 0.0003 | +/- 1.0% | 0.2 mm to 1.0 mm | Fixed single-frequency measurement point |
| Microstrip Ring Resonator | 0.0020 | +/- 3.0% | 0.1 mm to 0.8 mm | Conductor surface roughness masks dielectric loss |
Uncertainty Budgets in High Frequency Loss Tangent Calculation
Small dissipation factors below 0.001 demand stringent drift limits on vector network analyzer source stability and thermal ambient controls. Minute changes in laboratory ambient temperature alter cavity dimensions, masking true material absorption. Sample thickness precision represents the single largest contributor to permittivity calculation error.
An error of 10 micrometers in sample thickness measurement propagates into a two percent error in calculated real permittivity at 77 GHz.
Measurement laboratories quantify systemic measurement risks by constructing explicit uncertainty budgets. Unmodeled air gaps, specimen non-parallelism, and moisture adsorption during testing distort quality factor curves. Thick samples distort the measurement.
Test fixture setup errors corrupt high-frequency material evaluation campaigns through several repeatable physical mechanisms:
- Specimen edge diffractions alter the quality factor of the resonant mode when sample diameter falls below twice the Gaussian beam waist diameter.
- Thermal expansion variances shift cavity dimensions during extended test sweeps, creating false shifts in resonant frequency.
- Air gap inclusions between substrate layers and calibration plates introduce false low readings in real dielectric constant calculations.
- Surface anisotropy created during injection molding yields directional permittivity discrepancies between parallel and perpendicular polarization planes.
Whether higher order modes generated inside sub-millimeter cavities at 140 GHz can be suppressed without resort to destructive sample shaping remains an unaddressed barrier for next generation automotive radar platforms.
Hydration
Absorbed atmospheric moisture alters the molecular polarizability of engineering thermoplastics exposed to operational field environments. Water molecules possess a high permanent dipole moment, displaying a static real permittivity of approximately 80 at room temperature and a broad dielectric relaxation peak in the microwave spectrum. When polymers absorb water, absorbed polar molecules aggregate within free volume pockets or form hydrogen bonds with polymer side chains.
Even small mass fractions of absorbed water cause measurable increases in high-frequency dielectric loss. Automotive radar radomes mounted behind vehicle bumpers experience constant humidity fluctuations, rain immersion, and wash-down cycles. Quantifying dielectric loss tangent degradation requires conditioning polymer samples under controlled humidity regimes prior to high-frequency resonator testing.

Damp Heat Exposure and Dissipation Factor Degradation
Polar water molecules trapped inside a polymer matrix introduce high dielectric relaxation losses around 77 GHz. As ambient relative humidity rises from 20 percent to 85 percent, polybutylene terephthalate and polyamide compounds exhibit significant permittivity drift. Liquid crystal polymers and cyclo-olefin copolymers retain minimal water, maintaining stable dielectric profiles across environmental transitions.
Damp heat testing standard IEC 60068-2-78 subjects material specimens to 40 degrees Celsius and 93 percent relative humidity for extended durations. Material evaluation campaigns track complex permittivity changes at regular exposure intervals. Polybutylene terephthalate blends exposed to damp heat for 1000 hours exhibit up to a 40 percent increase in loss tangent at 77 GHz, moving from a dry baseline of 0.0035 to a saturated state of 0.0049.
Permittivity drift shifts the frequency. Moisture shifts the resonant peak.
Water absorption of 0.5 percent by weight in an engineering thermoplastic increases the 77 GHz dielectric loss tangent by more than thirty percent.
Polymer Chemistry and Water Ingress Mechanics
Non-polar molecular structures like polyolefins and fluoropolymers maintain stable dielectric profiles under severe humidity saturation. The presence of ester, amide, or hydroxyl functional groups in polymer backbones increases affinity for water adsorption. Polymer morphology also dictates ingress kinetics, as crystalline domains restrict water diffusion while amorphous regions accommodate polar penetrants.
Evaluating dielectric stability requires a systematic environmental conditioning and measurement procedure:
- Bake sample specimens in a dry oven at 80 degrees Celsius for 24 hours to remove baseline moisture content.
- Transfer samples into a desiccator chamber until temperature stabilizes at 23 degrees Celsius.
- Record initial dry mass on a calibrated analytical balance with 0.1 milligram resolution.
- Mount specimen inside the open resonator and record dielectric loss tangent across 76 GHz to 81 GHz.
- Place specimen in an environmental chamber at 85 degrees Celsius and 85 percent relative humidity for 1000 hours.
- Re-measure complex permittivity within fifteen minutes of removal from environmental conditioning.
| Polymer Family | Equilibrium Water Absorption (% Weight) | Baseline Permittivity (Dry, 77 GHz) | Baseline Loss Tangent (Dry, 77 GHz) | Saturated Loss Tangent (85/85, 77 GHz) |
|---|---|---|---|---|
| Polybutylene Terephthalate (PBT) | 0.45% | 2.72 | 0.0036 | 0.0051 |
| Polycarbonate (PC) | 0.35% | 2.81 | 0.0058 | 0.0074 |
| Polypropylene (PP Compound) | 0.02% | 2.26 | 0.0006 | 0.0007 |
| Liquid Crystal Polymer (LCP) | 0.04% | 3.15 | 0.0018 | 0.0020 |
| Polytetrafluoroethylene (PTFE) | 0.01% | 2.08 | 0.0004 | 0.0004 |
Resins that absorb moisture rapidly always suffer dielectric loss drift before completing accelerated thermal exposure cycles.

Attenuation
Electromagnetic energy passing through a protective housing undergoes dielectric reflection, absorption, and refraction before entering free space. Power loss across a planar dielectric wall scales directly with frequency, wall thickness, material loss tangent, and the square root of real permittivity. At 77 GHz, wavelength inside a polymer housing with a real permittivity of 2.5 measures approximately 2.47 millimeters.
When radome wall thickness equals an integer multiple of half the internal wavelength, reflections from the front and back interfaces undergo destructive interference, maximizing transmission. However, dielectric absorption loss remains independent of destructive interference conditions. Dissipation factor drives the irreversible attenuation of millimeter-wave signal power within the material bulk.

Why Do Lossy Radomes Distort Radar Beam Patterns?
Phase delays produced by non-uniform material thickness or localized loss gradients distort the phase front across planar antenna arrays. Phase errors destroy range resolution. In automotive radar, directional accuracy relies on precise phase relationships between receiving array channels.
When local dissipation factor variations alter signal amplitude unequally across array elements, side-lobe levels increase and main-lobe directivity drops.
Increased side-lobe power creates phantom targets in adjacent traffic lanes. Dielectric loss attenuates target reflections, reducing maximum object detection distance. Radome geometry causes reflection ripple.
Impedance mismatches multiply power loss.
EIRP Compliance Boundaries under ETSI and FCC Rules
Transmitter power limits mandated by European standard ETSI EN 302 264 and United States FCC Part 95M leave narrow margins for unmodeled housing absorption. FCC Part 95M sets maximum Equivalent Isotropically Radiated Power (EIRP) limits for automotive radar systems operating in the 76 GHz to 81 GHz band at +55 dBm peak and +50 dBm average. ETSI EN 302 264 Clause 7.3 defines equivalent radiated power thresholds and spectral mask limits across member states.
System designers allocate strict attenuation budgets to radome enclosures. Standard loss budgets limit radome double-pass signal attenuation to less than 1.5 dB. Unintended loss tangent increases directly reduce radiated field strength, pushing EIRP below declared compliance levels or forcing radar transceivers to draw additional power, increasing thermal dissipation demand.
Compliance under ETSI EN 302 264 Clause 7.3 requires radiated emission power checks with the final product radome installed in its production orientation.
Consider a practical engineering construction evaluating a 77 GHz radar transmitter housing. Assume a transmitter output power of +12 dBm feeding a microstrip patch array antenna with a nominal boresight gain of +18 dBi, yielding an unshielded boresight EIRP of +30 dBm. The protective radome housing uses a polybutylene terephthalate planar wall with a nominal thickness of 2.47 millimeters, corresponding to a single half-wavelength resonance at 77 GHz.
In Case A, the material remains fully dry, exhibiting a loss tangent of 0.0035 and a real permittivity of 2.70. Calculated two-way power transmission efficiency through the resonant wall equals 92.4 percent, resulting in a two-way radome insertion loss of 0.34 dB. Net radiated EIRP measures +29.66 dBm, comfortably satisfying internal system requirements and meeting FCC Part 95M limits.
In Case B, extended field operation under high humidity elevates material moisture content, causing loss tangent to rise to 0.0085 while real permittivity shifts to 2.78. The permittivity shift moves the resonant half-wavelength frequency away from 77 GHz, while elevated absorption reduces one-way transmission efficiency to 80.1 percent. Total two-way insertion loss increases to 1.93 dB.
Radiated EIRP drops to +28.07 dBm. The 1.59 dB power loss reduces radar target detection range by approximately 8.7 percent according to the radar range equation, while increased reflections distort antenna phase fronts and elevate side-lobe levels above class compliance thresholds.
| Radome Material State | Nominal Loss Tangent | Real Permittivity | One-Way Attenuation (dB/mm) | Two-Way Insertion Loss (dB) | Boresight EIRP (dBm) |
|---|---|---|---|---|---|
| Optimized Polypropylene (Dry) | 0.0006 | 2.26 | 0.095 | 0.12 | +29.88 |
| PBT Thermoplastic (Baseline Dry) | 0.0035 | 2.70 | 0.285 | 0.34 | +29.66 |
| PBT Thermoplastic (Moisture Saturated) | 0.0085 | 2.78 | 0.710 | 1.93 | +28.07 |
| High-Loss Polycarbonate (Degraded) | 0.0120 | 2.85 | 1.020 | 2.68 | +27.32 |
Material buyers and housing designers evaluate raw resin formulations using a structured decision checklist:
- Dissipation factor threshold maintains overall radiated signal strength within design margins under maximum moisture exposure.
- Hydrophobic chemistry prevents moisture absorption from degrading beam sharpness during field service.
- Coefficient of thermal expansion tracking minimizes dimensional distortion across operational temperatures.
- Injection molding stability ensures uniform wall thickness without internal void formation.
Underestimating dielectric absorption across radome enclosures results in radiated emission test failures, cancelled compliance filings, and delayed product releases.

Dossier
Regulatory bodies demand verifiable proof of material consistency and RF performance across production batches. Approvals desks do not evaluate raw resin chemistry directly. Laboratory test reports, ISO 17025 accreditation certificates, and technical construction files form the primary basis for regulatory compliance filings.
When submitting radio equipment for CE marking under the EU Radio Equipment Directive (2014/53/EU) or FCC grant certification in the United States, radome material characteristics directly influence antenna pattern compliance. An unaccredited test report documenting material permittivity invites immediate challenge during technical dossier reviews.
ISO 17025 Test Report Execution Requirements
Accredited measurement facilities document specimen geometry, thermal history, environmental humidity, and exact measurement frequency sweeps. Test reports supporting approval filings state measurement uncertainty bounds calculated according to ISO/IEC Guide 98-3. Standard commercial datasheets providing single-frequency dielectric values at 1 MHz or 1 GHz carry zero standing in 77 GHz regulatory approval filings.
Technical compliance dossiers include full measurement traces spanning the entire operating frequency band from 76 GHz to 81 GHz. Generating valid evidence requires calibration certificates for vector network analyzers, open resonators, and environmental conditioning chambers attached directly to the primary test dossier.
Test reports lacking explicit ISO 17025 accreditation logos and measurement uncertainty statements are routinely rejected by Telecommunication Certification Bodies during FCC Part 95M grant reviews.
Permissive Change Filings for Substrate Substitutions
Modifications to housing materials alter radiated power and spurious emissions, forcing compliance reviews under FCC Class II rules. If an automotive radar manufacturer alters the radome resin formulation from low-loss polybutylene terephthalate to a cheaper recycled compound, the original equipment authorization becomes invalid unless supported by comparative test data.
Under FCC rules, a Class II Permissive Change filing requires re-testing radiated power, beam pattern distortion, and out-of-band emissions. Replacing radome material without submitting updated compliance filings exposes manufacturers to border holds, product recalls, and severe regulatory fines.
A complete regulatory compliance file contains a specific set of verified documents:
- Specimen calibration certificates confirm exact physical dimensions and density measurements of evaluated material samples.
- Chamber thermal logs verify ambient humidity and temperature stability during RF sweeps.
- Vector network analyzer calibration files document system directivity and source power levels across the evaluated spectrum.
- Supplier material datasheets provide lot traceability and raw resin formulation parameters.
Specifying compliance under ETSI EN 302 264 Clause 7.3 obligates suppliers to maintain lot-level permittivity tolerances within two percent of declared nominal values.


Tariff
Selecting high-frequency resin formulations introduces direct material surcharges, machining overheads, and certification testing expenditures. High-performance liquid crystal polymers and specialized fluoropolymers command raw material prices four to eight times higher than standard automotive-grade polybutylene terephthalate or polycarbonate blends. Unplanned retests resulting from unmodeled dielectric attenuation rapidly eliminate short-term resin cost savings.
Accredited ISO 17025 laboratory time for Fabry-Perot open resonator characterization costs between 300 USD and 500 USD per hour. A complete dielectric evaluation sweep across temperature and humidity variations requires up to 40 chamber hours per resin candidate. Spending 20,000 USD on upfront material characterization avoids late-stage radiated retest failures that cost over 100,000 USD in delayed vehicle launch slots and emergency re-tooling.

Retest Costs and Schedule Slippage Mechanics
Failing an initial radiated compliance scan due to unexpected radome loss forces immediate schedule holds at the testing facility. Radiated chamber bookings at accredited test houses carry lead times ranging from four to twelve weeks. Missing a scheduled compliance window delays FCC grant issuance and CE mark declarations, holding finished vehicle components inside assembly warehouses while assembly lines await certified parts.
A six-week filing delay converts directly into landed cost surcharges, expedited air freight fees, and contract failure penalties imposed by automotive tier-one buyers. Procurement teams must integrate dielectric verification steps directly into raw material purchase contracts, forcing resin compounders to guarantee high-frequency loss tangent limits before accepting mass production deliveries.
Suppliers frequently state that unexpected batch permittivity shifts stem entirely from unannounced base polymer resin supply variations beyond raw material manufacturing control.