Polymer Enclosure Attenuation Measurement under Millimeter Wave Radar Frequencies
Characterizing polymer permittivity and loss tangent under free-space conditions ensures radar enclosure attenuation remains within strict type-approval limits.


Dielectrics
At 77 GHz, millimeter-wave signals pass through composite housings with phase shifts driven by real permittivity and attenuation dictated by loss tangents. Across the 24 GHz to 81 GHz band, small variations in resin chemistry or physical density create measurable attenuation spikes. Signal decay in polymers scales directly: the attenuation coefficient alpha (in nepers per meter) increases linearly with frequency and the square root of the dielectric constant, multiplied by the loss tangent.
Choosing polymers for radomes and sensor enclosures requires balancing how the material affects both wave amplitude and phase.
Real permittivity sets wave velocity through the material and determines the impedance mismatch at the polymer-to-air interface. When a 77 GHz radar wave hits a high-permittivity plastic, a fraction of the energy reflects back toward the transmit array, cutting forward power and causing internal multipath interference inside the sensor cavity. Designers size wall thickness to half the in-dielectric wavelength to cancel reflections through destructive interference, but maintaining this condition across wider bandwidths requires strict control over resin formulations.
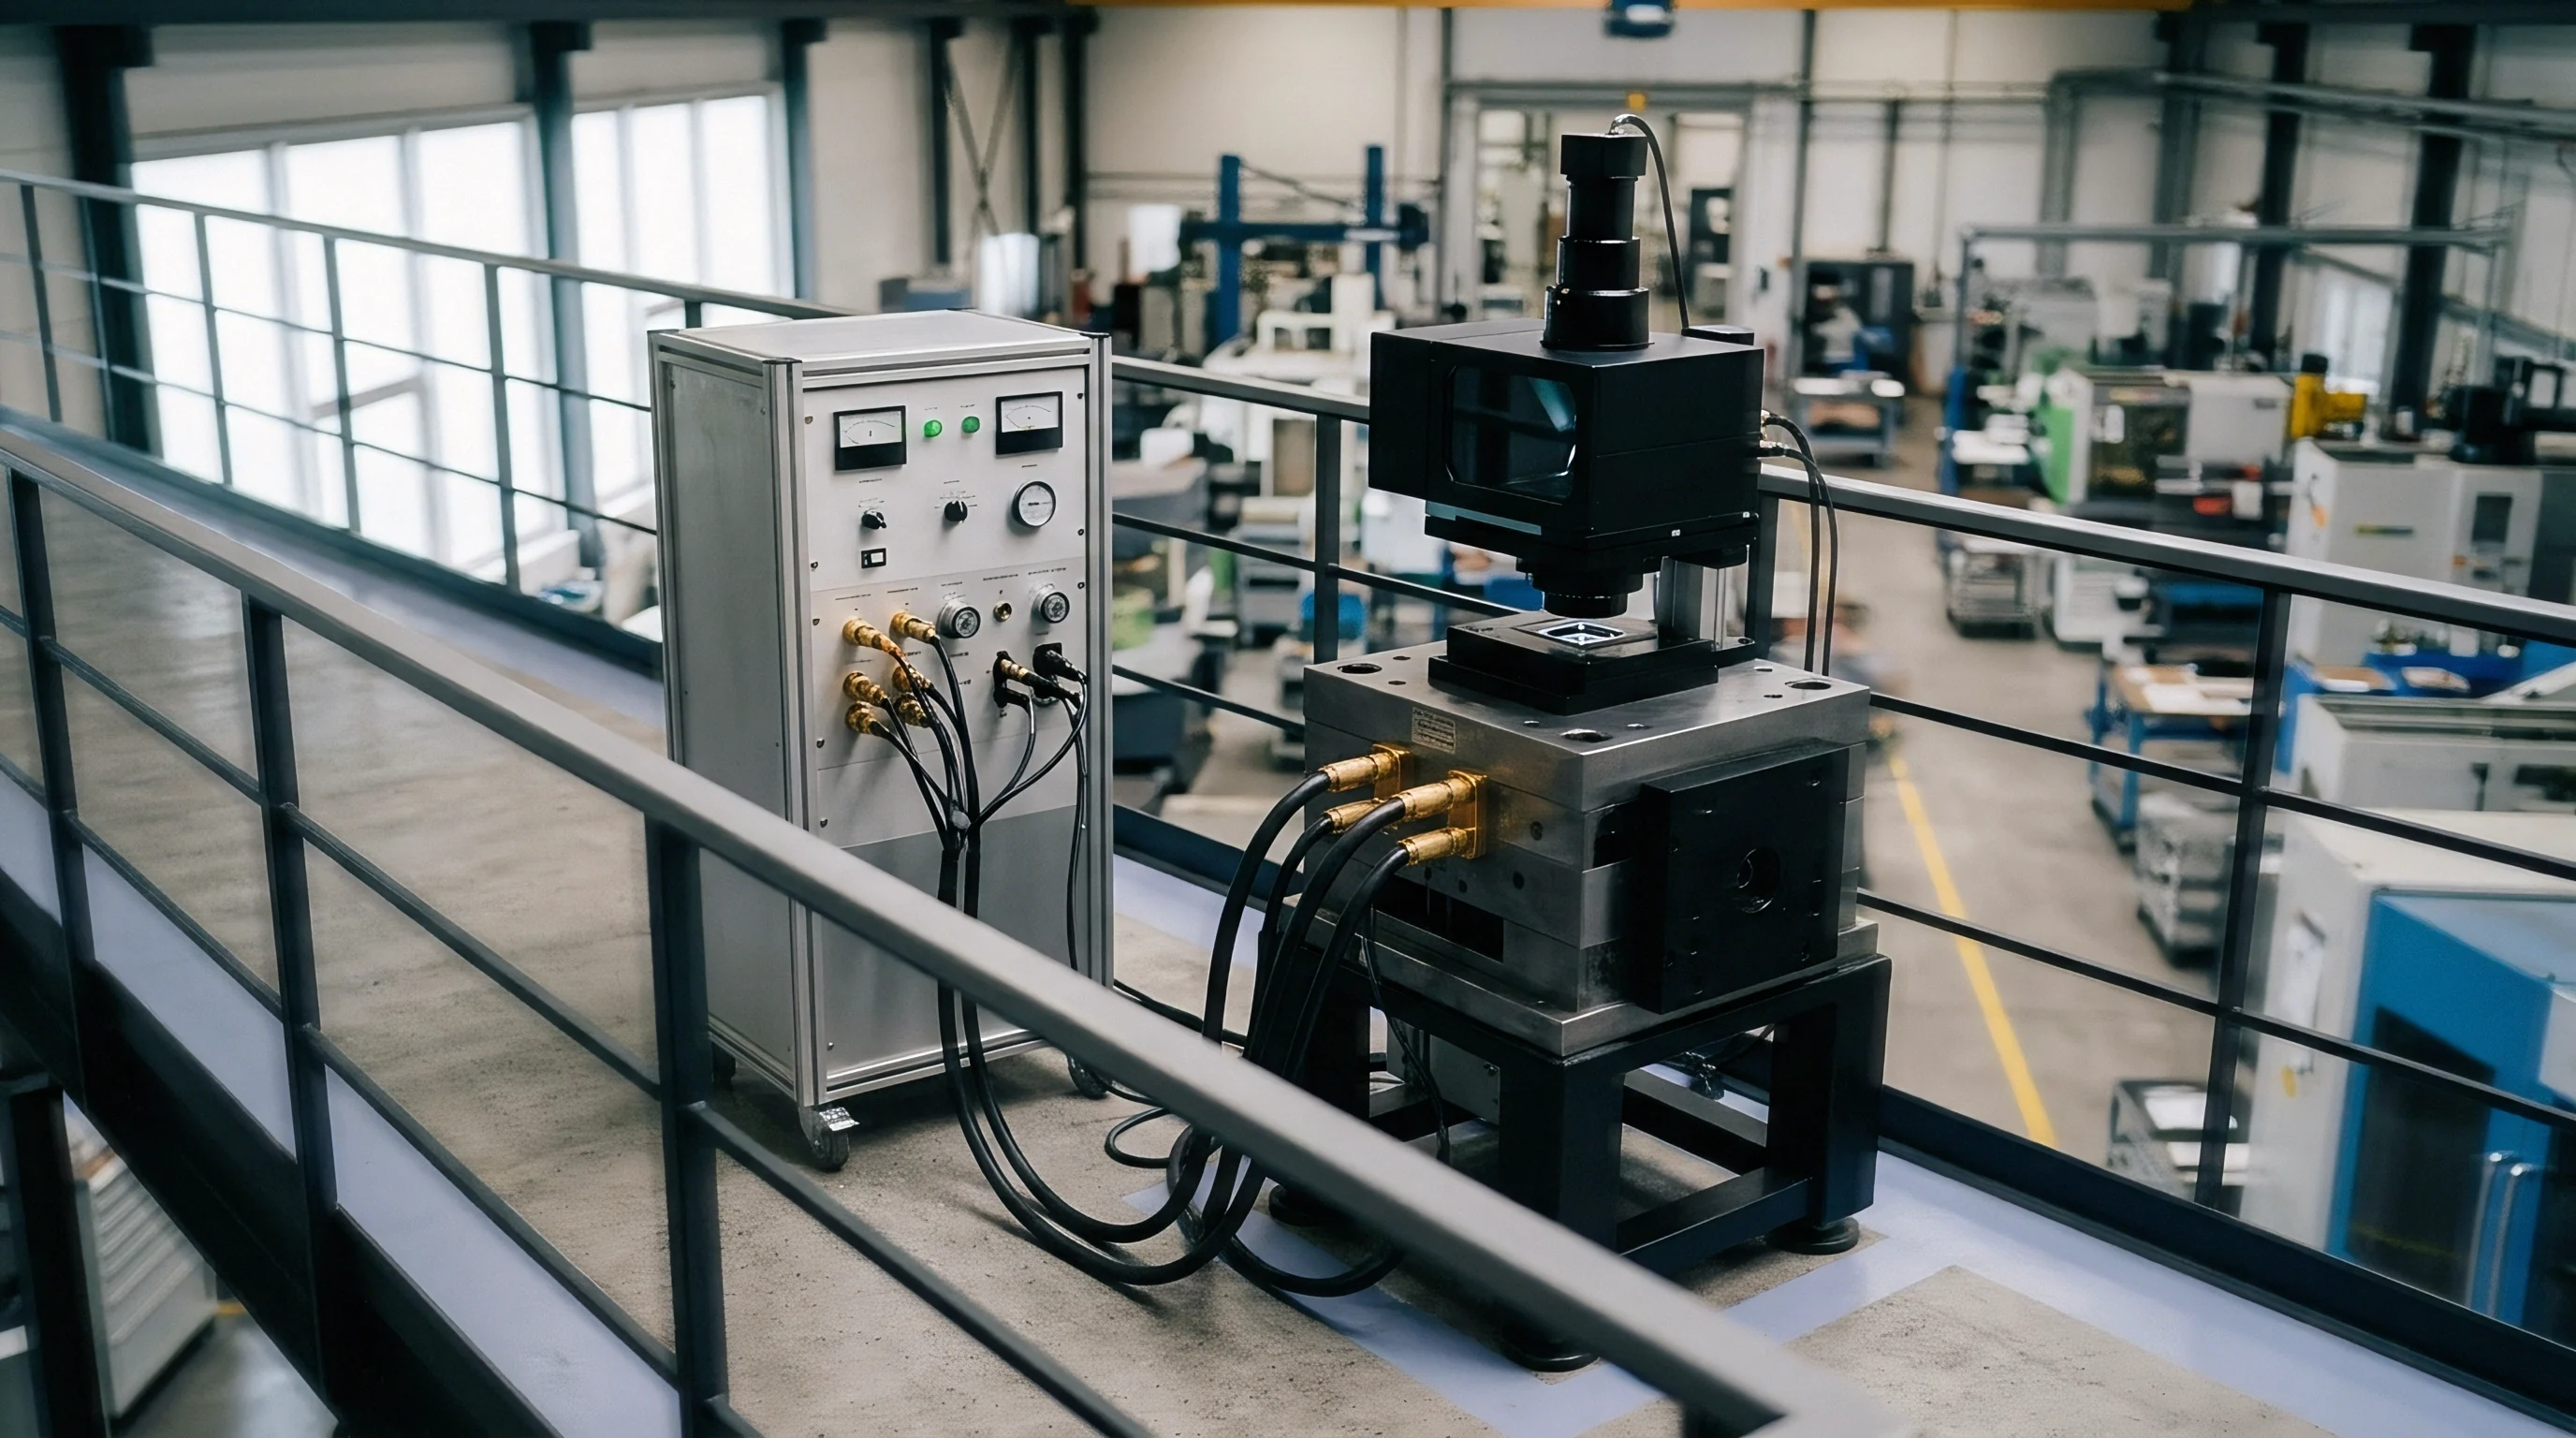
Permittivity and Reflection Mechanics
Impedance matching between 76 GHz and 81 GHz leaves tight mechanical margins. Unfilled polybutylene terephthalate with a relative permittivity of 3.1 gives an in-material wavelength of roughly 2.2 millimeters at 77 GHz, placing the half-wavelength wall thickness at exactly 1.1 millimeters. A mold or thickness deviation of just 50 micrometers shifts the reflection minimum outside the active band, increasing insertion loss by up to 3 dB.
Adding flame retardants, glass fibers, or pigments to base resins shifts the dielectric constant further.
Glass fiber reinforcement adds rigidity but increases permittivity significantly. Unfilled polycarbonate sits at a relative permittivity near 2.8 at 77 GHz, whereas a 30 percent glass-filled variant rises to 3.4. That change alters propagation speed and degrades the half-wavelength match.
Mineral fillers like talc or calcium carbonate induce comparable drift. Because dielectric constants exhibit dispersion between 24 GHz and 81 GHz, resins require characterization at the target operating frequency rather than reliance on standard data sheet values measured at 1 MHz or 1 GHz.
| Polymer Matrix | Filler Content | Permittivity at 24 GHz | Loss Tangent at 24 GHz | Permittivity at 77 GHz | Loss Tangent at 77 GHz |
|---|---|---|---|---|---|
| Polycarbonate (PC) | Unfilled | 2.82 | 0.0060 | 2.80 | 0.0095 |
| Polybutylene Terephthalate (PBT) | Unfilled | 3.12 | 0.0075 | 3.08 | 0.0120 |
| PBT + Polyethylene Terephthalate | 30% Glass Fiber | 3.55 | 0.0090 | 3.48 | 0.0165 |
| Polyetherimide (PEI) | Unfilled | 3.05 | 0.0025 | 3.02 | 0.0050 |
| Polyphenylene Sulfide (PPS) | 40% Glass/Mineral | 3.80 | 0.0040 | 3.72 | 0.0080 |
| Cyclic Olefin Copolymer (COC) | Unfilled | 2.35 | 0.0002 | 2.34 | 0.0006 |

Loss Tangent and Absorption Dynamics
Absorption within the polymer matrix converts RF energy into heat. The loss tangent ~ the ratio of imaginary to real permittivity ~ measures intrinsic dissipation in the polymer chains. Polar polymers exhibit higher loss tangents at millimeter-wave frequencies due to dipole relaxation.
Polyamides, for instance, exceed loss tangents of 0.020 at 77 GHz, making them unsuitable for low-power radar housings despite strong mechanical properties.
Non-polar materials like cyclic olefin copolymers maintain loss tangents below 0.001 across the millimeter-wave spectrum. Selecting a low-loss matrix preserves signal strength along the propagation path. High loss tangents attenuate signal amplitude and distort phase fronts across antenna arrays, reducing detection range and angular resolution in imaging radars.
Carbon black added for UV protection or coloring introduces conductive losses that sharply increase loss tangents even at loading levels below one percent by weight.
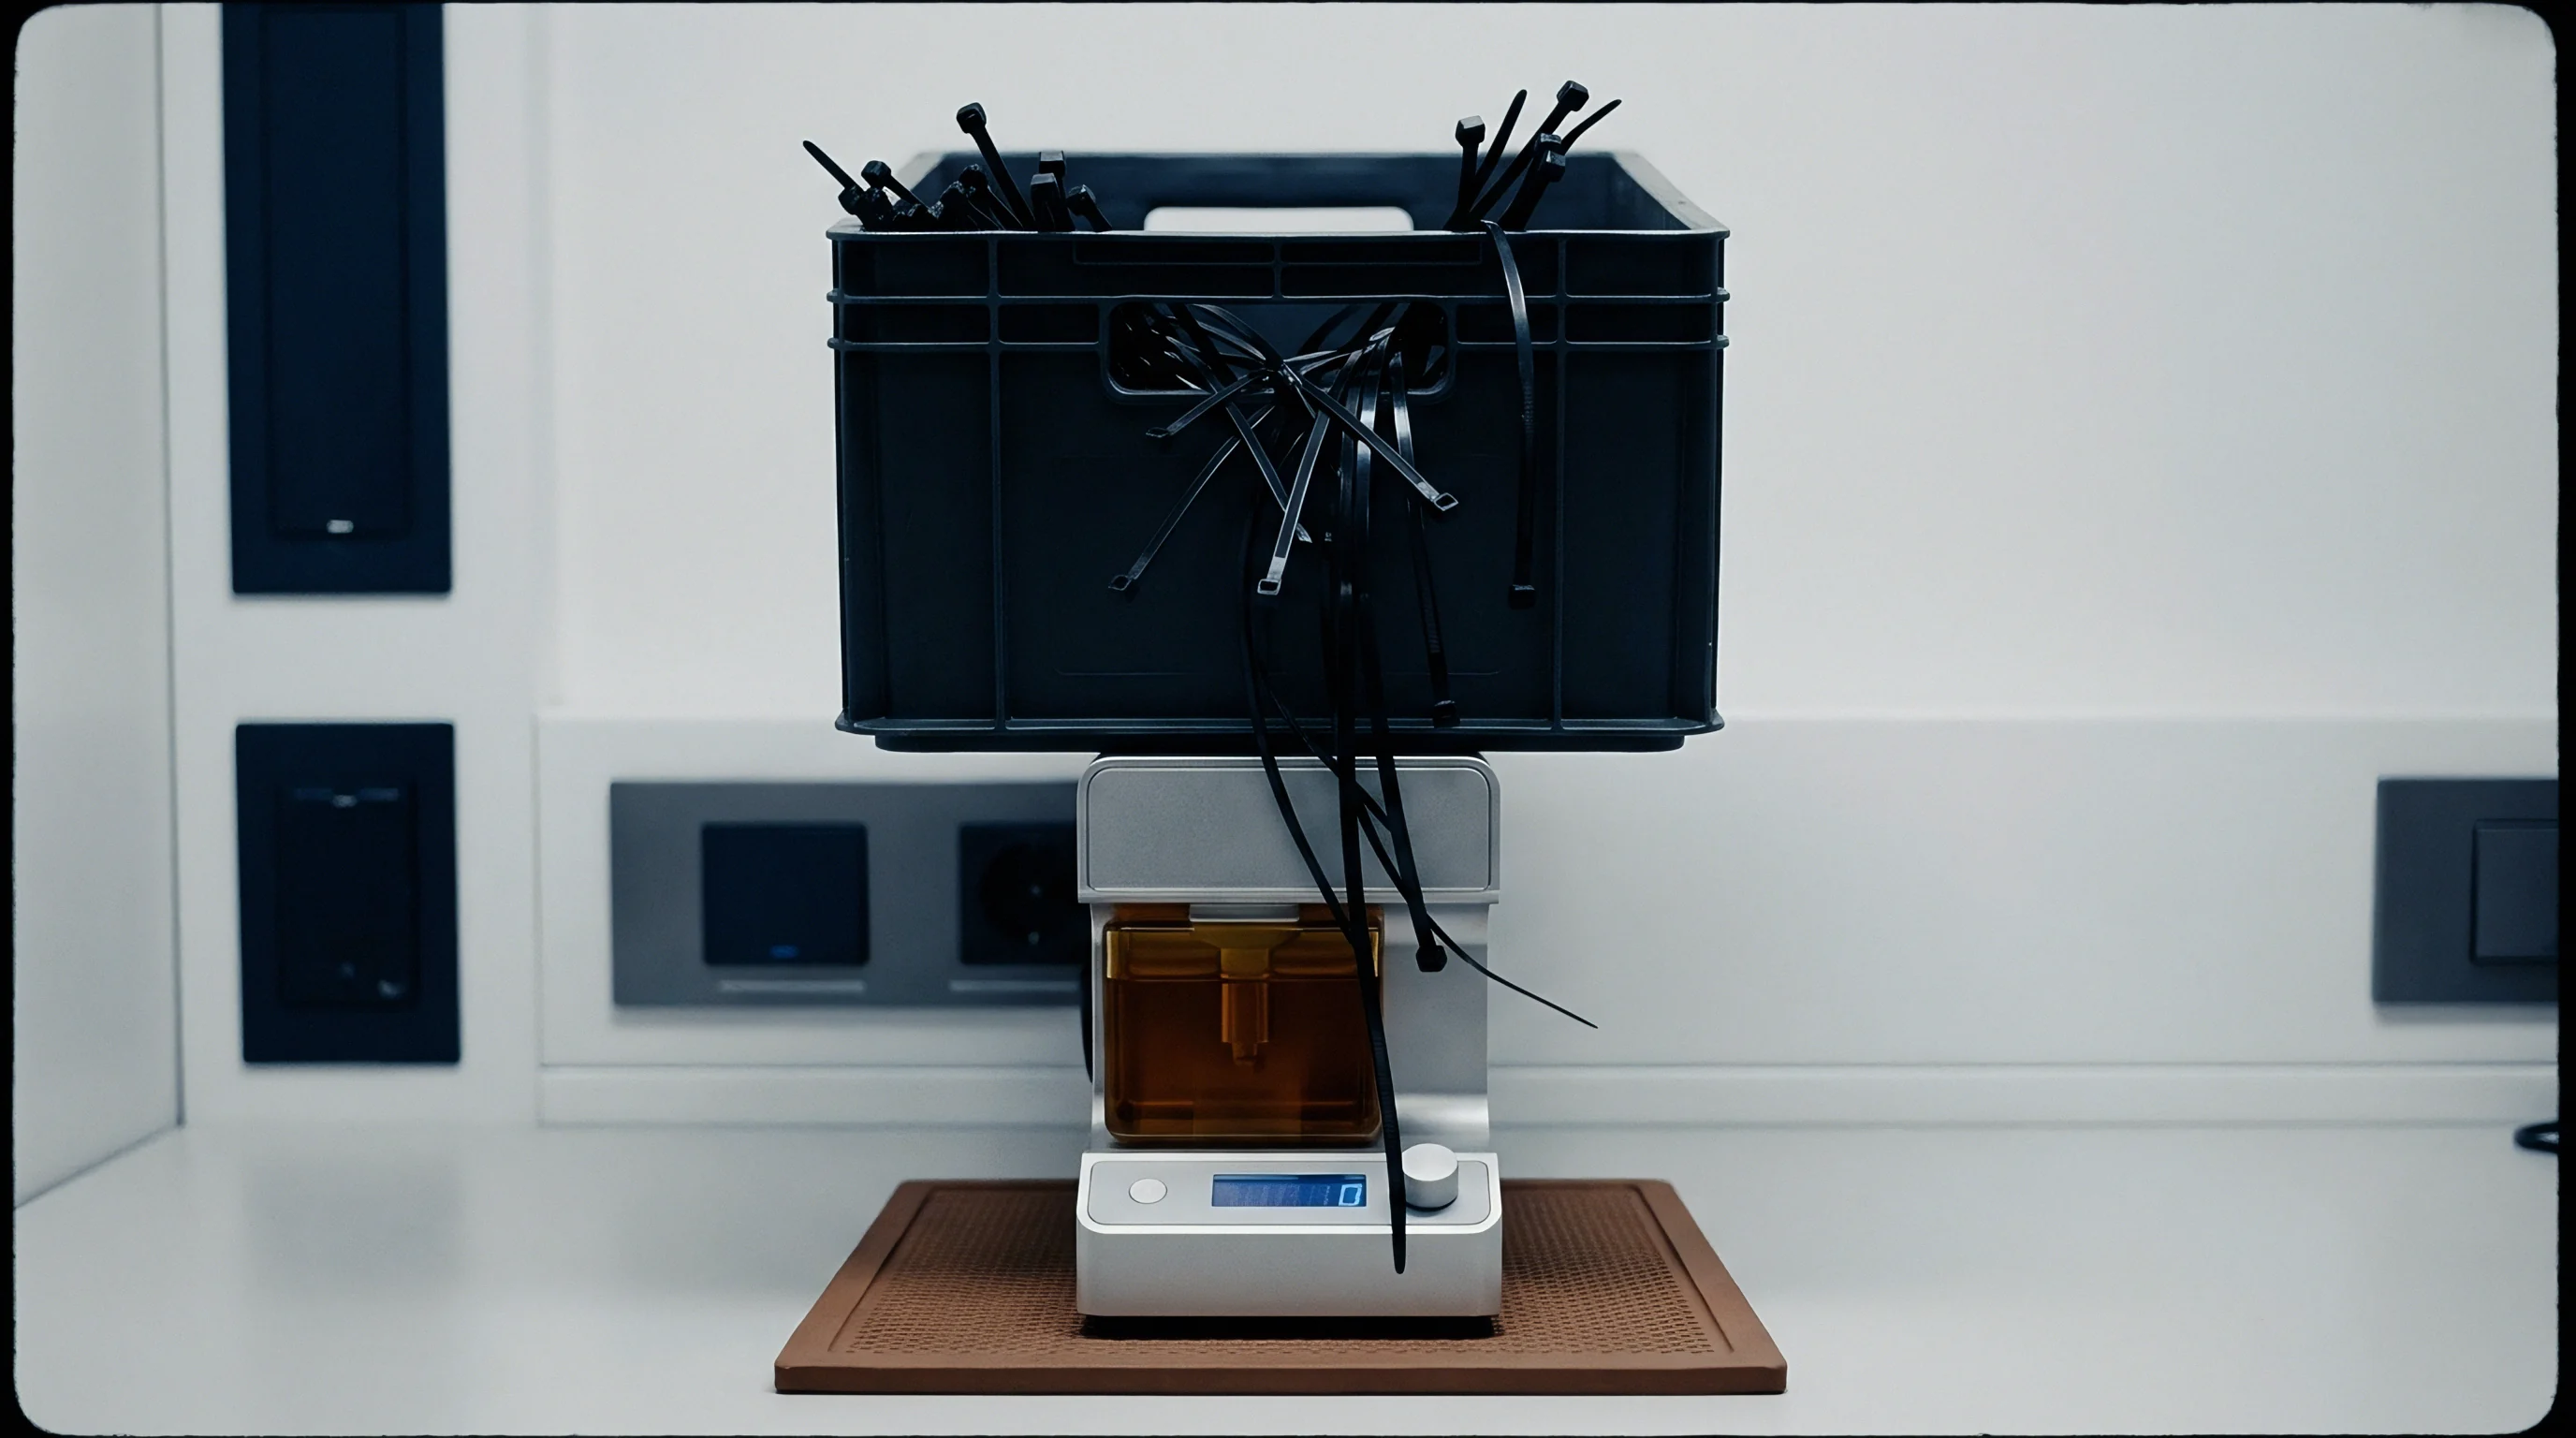
Moisture Sensitivity and Environmental Shift
Atmospheric moisture poses a consistent risk to dielectric stability. Water carries a relative permittivity near 34 and a loss tangent around 0.40 at 77 GHz. When hygroscopic polymers like nylon or polybutylene terephthalate absorb moisture, water molecules trapped within the matrix alter bulk dielectric properties even at low concentrations.
Radome wall thickness shifts exceeding ten percent of the in-material wavelength destroy destructive interference conditions and double reflected energy back into the sensor.
Environmental cycling at 85 percent relative humidity produces a 2.4 dB attenuation spike across batch samples. Polybutylene terephthalate housings absorb up to 0.4 percent water by weight when saturated, raising bulk permittivity from 3.08 to 3.22 and dropping the optimal phase-matching frequency by nearly 3 GHz. Bumper-mounted radar housings also encounter direct road spray, introducing thin-film surface reflections alongside volumetric absorption.
Characterization must evaluate material behavior across dry, humid, and fully saturated states.
Thicker housing walls increase cumulative signal loss along the propagation path. Thin walls minimize absorption but reduce structural impact resistance, requiring a trade-off between electrical performance, rigidity, and moldability. Hydrophobic additives can limit water absorption and stabilize attenuation over environmental cycles.
A wall dimensioned solely for dry resin will drift out of transmission specification once moisture saturation occurs.

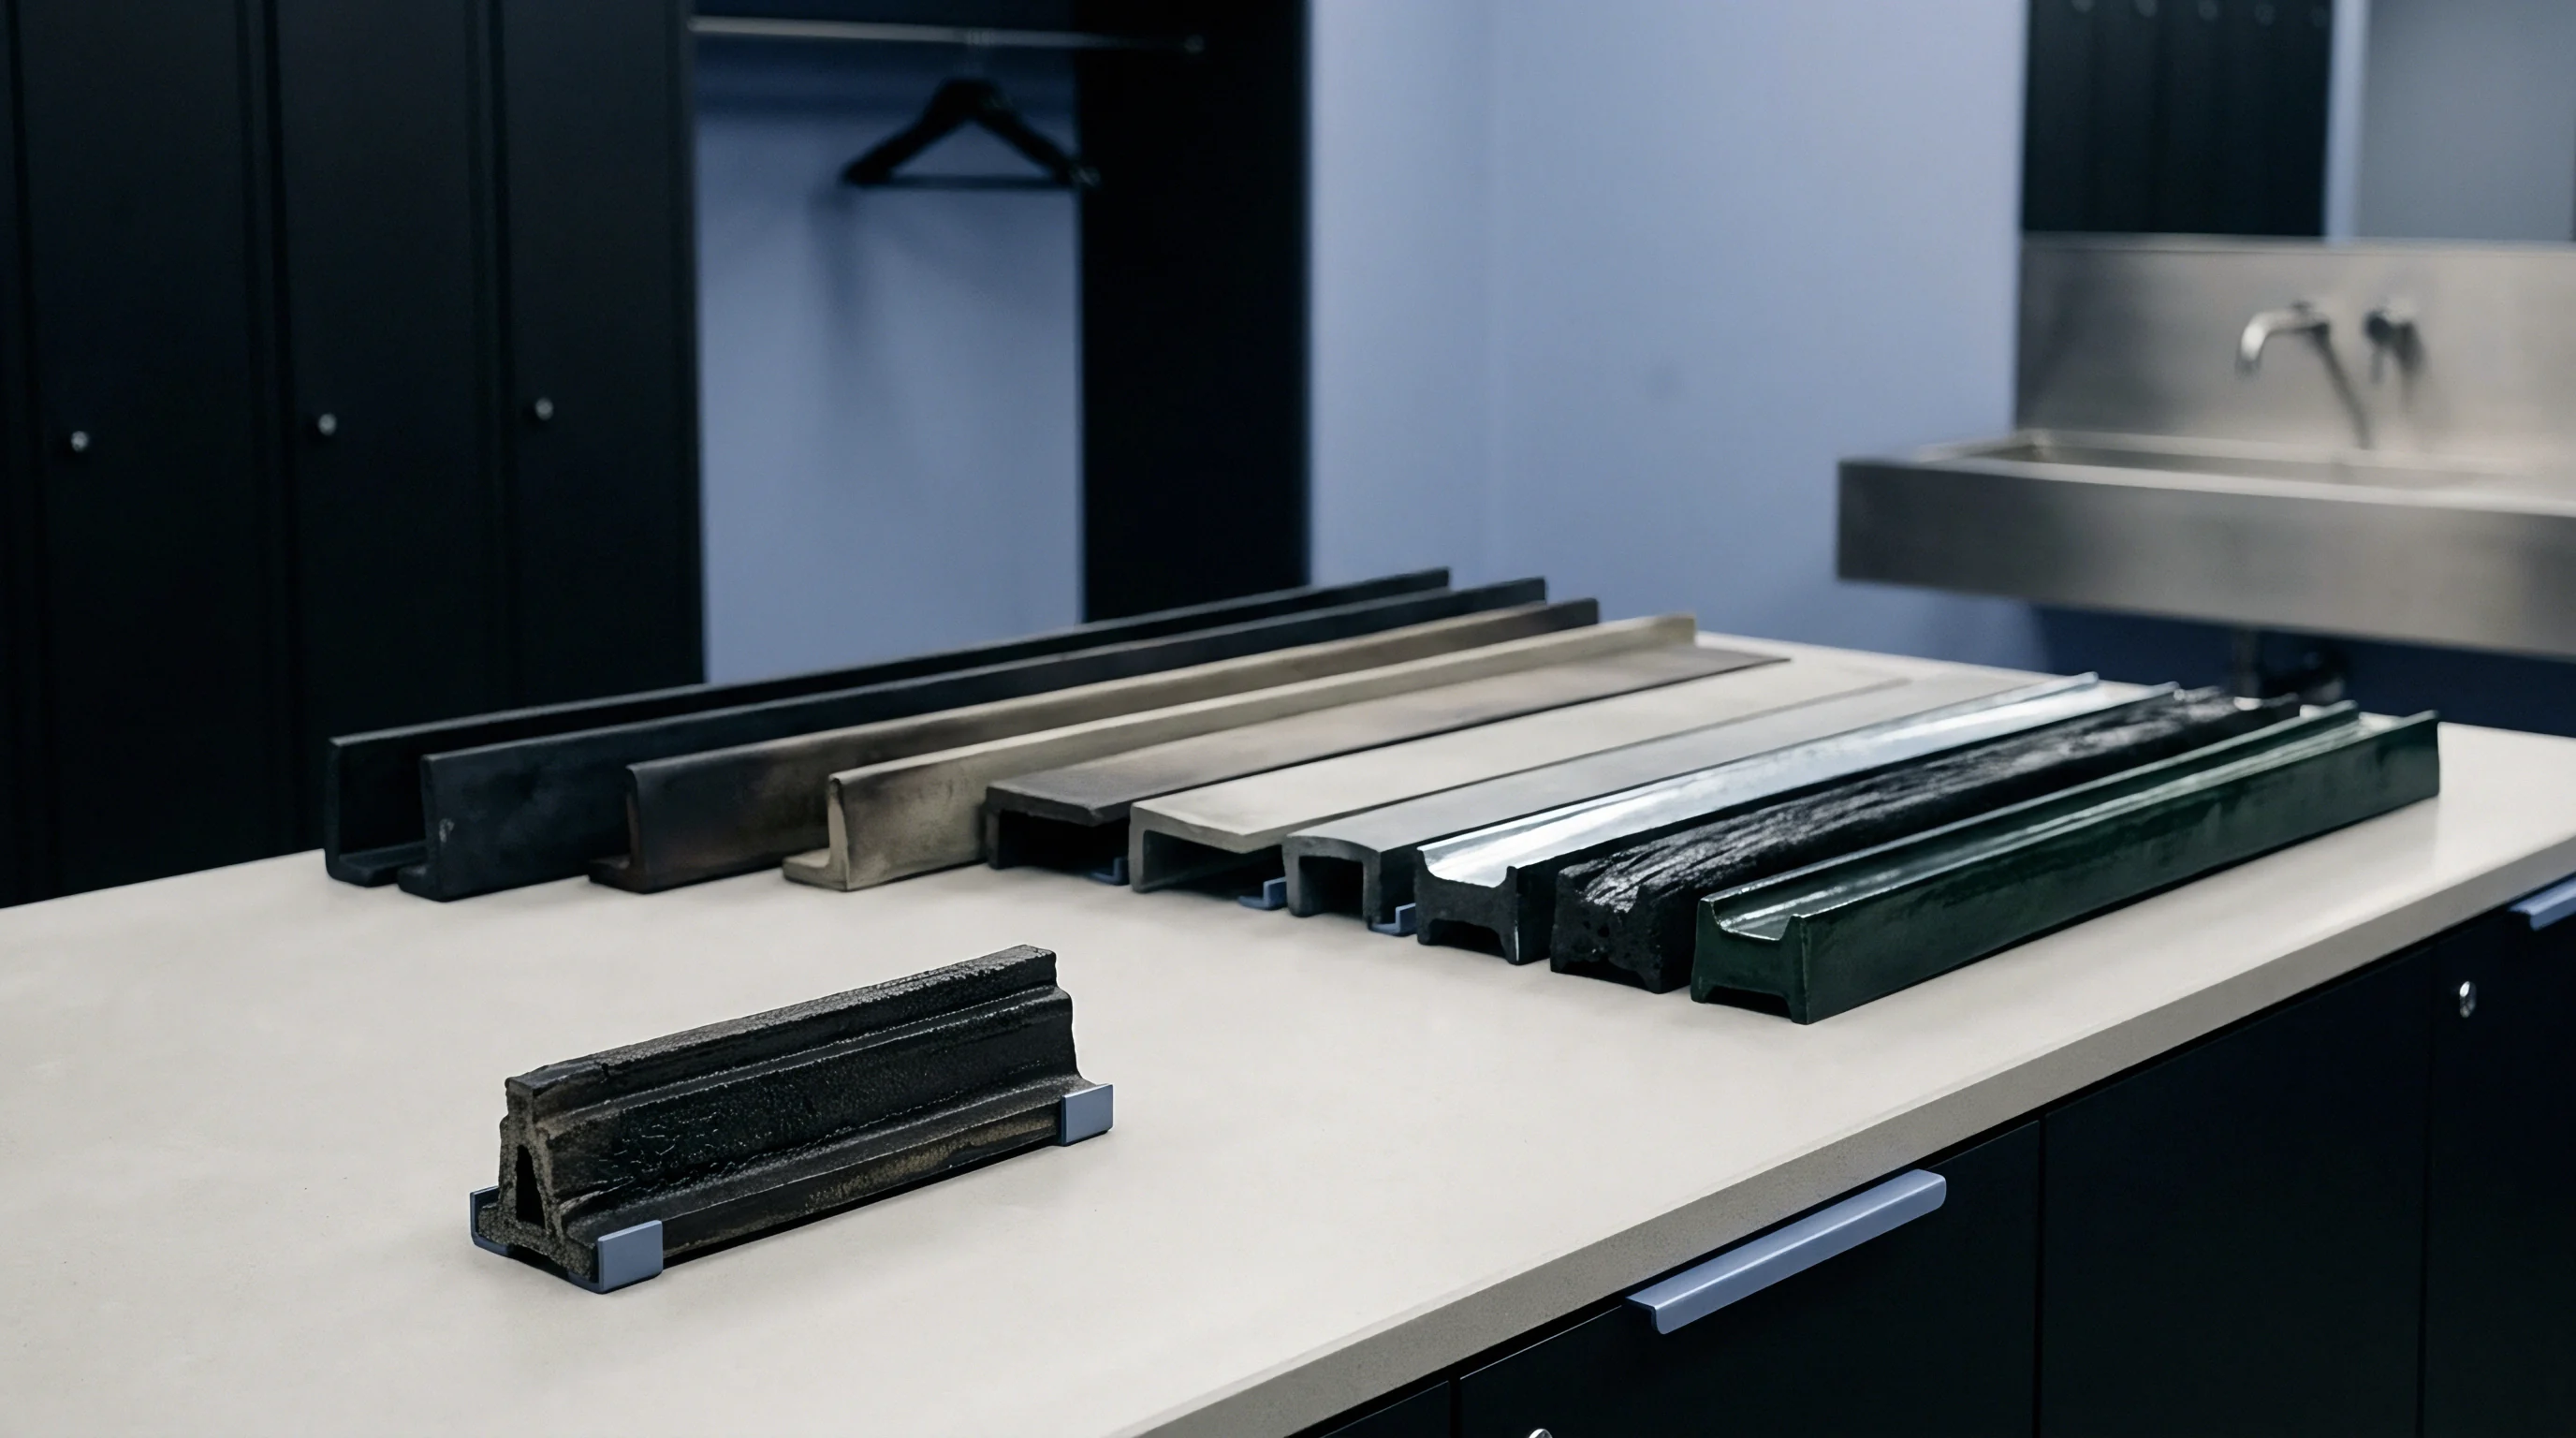
Apparatus
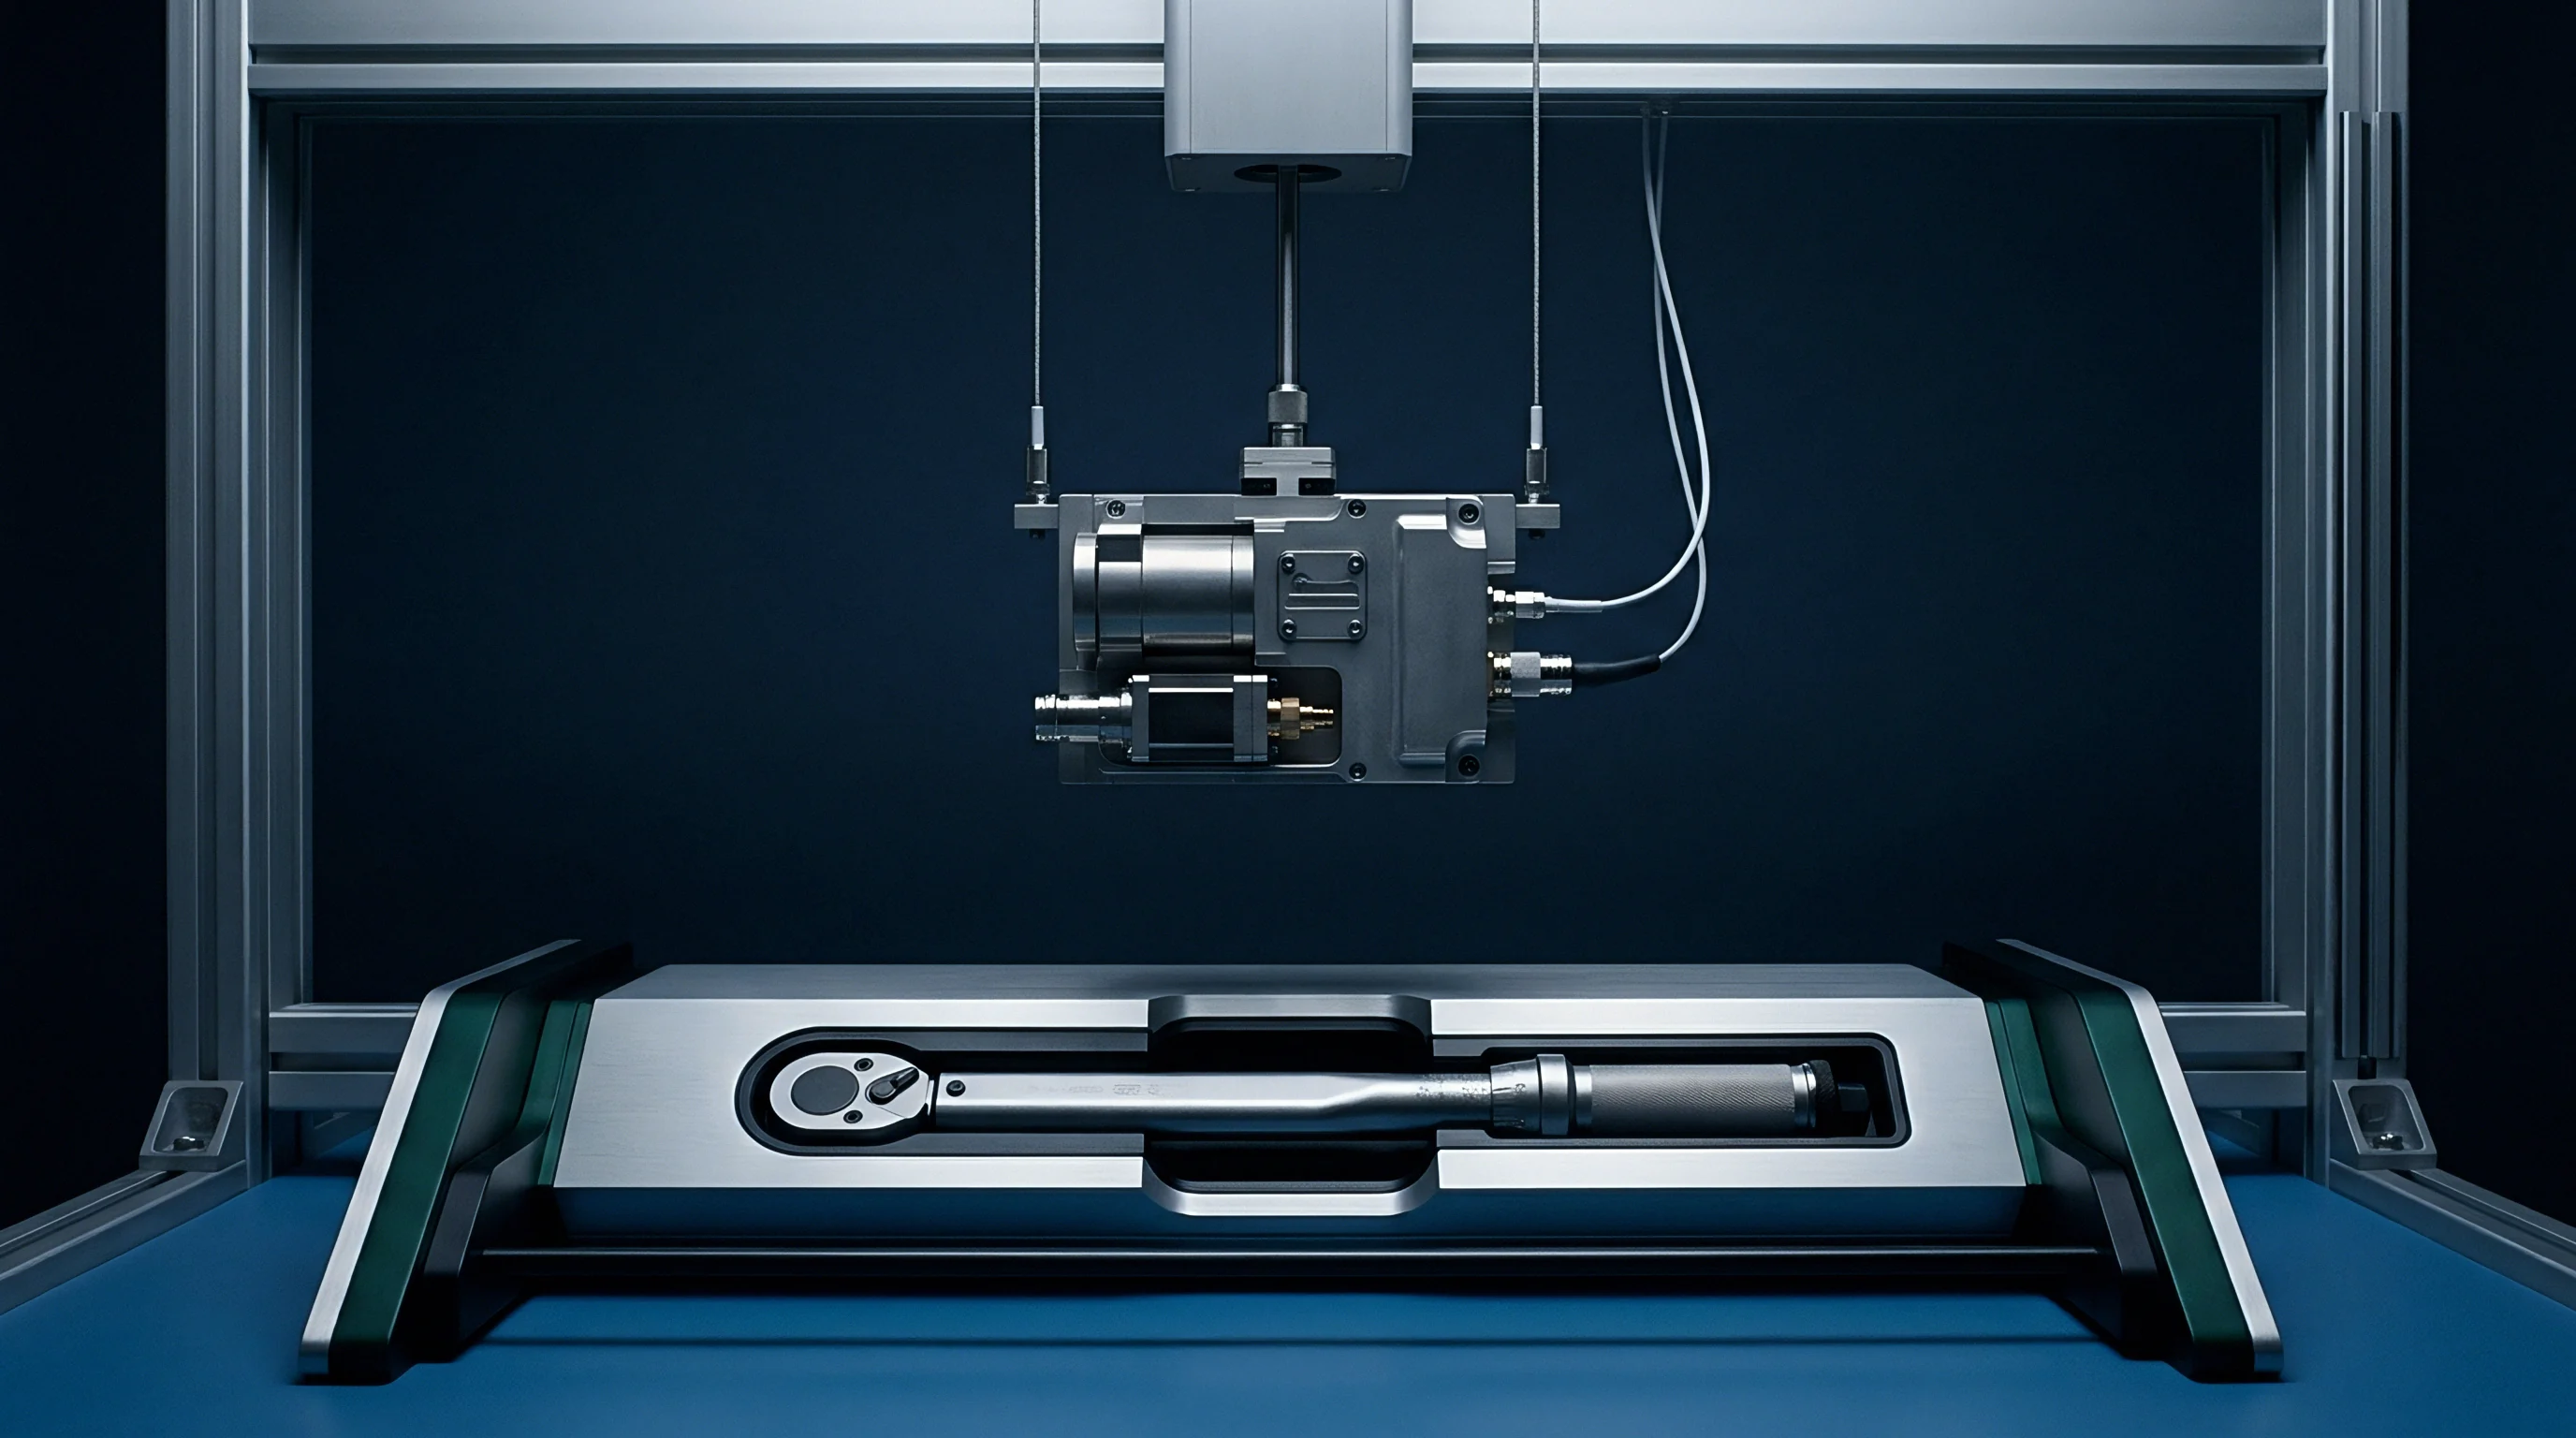
Free-space transmission benches measure insertion loss across 76 GHz to 81 GHz using matched spot-lens horn antennas. Non-contact measurement prevents physical deformation of thin test plaques and avoids air gaps common to contact fixtures. A vector network analyzer coupled to millimeter-wave frequency extenders directs a focused Gaussian beam through a flat plaque located at the beam waist.
Controlling spot size prevents edge diffraction from corrupting extracted dielectric properties.
Measurement precision relies on establishing a stable reference plane and eliminating internal bench reflections. Pair-matched spot-focusing horn antennas fitted with planoconvex dielectric lenses focus diverging RF energy into a narrow waist where power density peaks and wavefronts flatten. Placing the polymer sample at this focal plane ensures normal plane-wave illumination consistent with free-space analytical models.

Quasi Optical Free Space Benches
Quasi-optical benches align transmitting extenders, focusing lenses, sample mounts, and receiving extenders along a single optical axis. Frequency extenders expand network analyzer coverage into WR-15 and WR-12 waveguide bands (50 GHz to 110 GHz). Linear positioners set lens spacing to keep the beam waist smaller than the plaque footprint, preventing edge illumination from creating spurious diffraction in transmission measurements.
Standing waves between antenna apertures and sample surfaces introduce periodic ripple into scattering parameters. Network analyzer time-domain gating removes these multipath components by isolating the main transmission pulse in time. Truncating signals outside the primary pulse window suppresses secondary reflections bouncing between sample faces and feed horns.
Resolving these reflections requires broad frequency sweeps, making full 76 GHz to 81 GHz spans necessary for effective signal separation.
| Measurement Technique | Frequency Range | Sample Requirements | Measurement Accuracy | Primary Limitation |
|---|---|---|---|---|
| Free-Space Focused Beam | 18 GHz to 110 GHz | Flat plaque (100×100 mm) | High (+/- 2% Permittivity) | Requires time-domain gating |
| Split-Cavity Resonator | 10 GHz to 40 GHz | Thin flat sheet (< 1 mm) | Very High (+/- 0.5%) | Single-frequency operation |
| Waveguide Flange Holder | 8 GHz to 110 GHz | Precision machined plug | Moderate (+/- 5%) | Air gaps introduce large errors |
| Open Fabry-Perot Cavity | 30 GHz to 300 GHz | Flat disc (50 mm dia) | Extreme (+/- 0.2%) | Complex alignment, high cost |
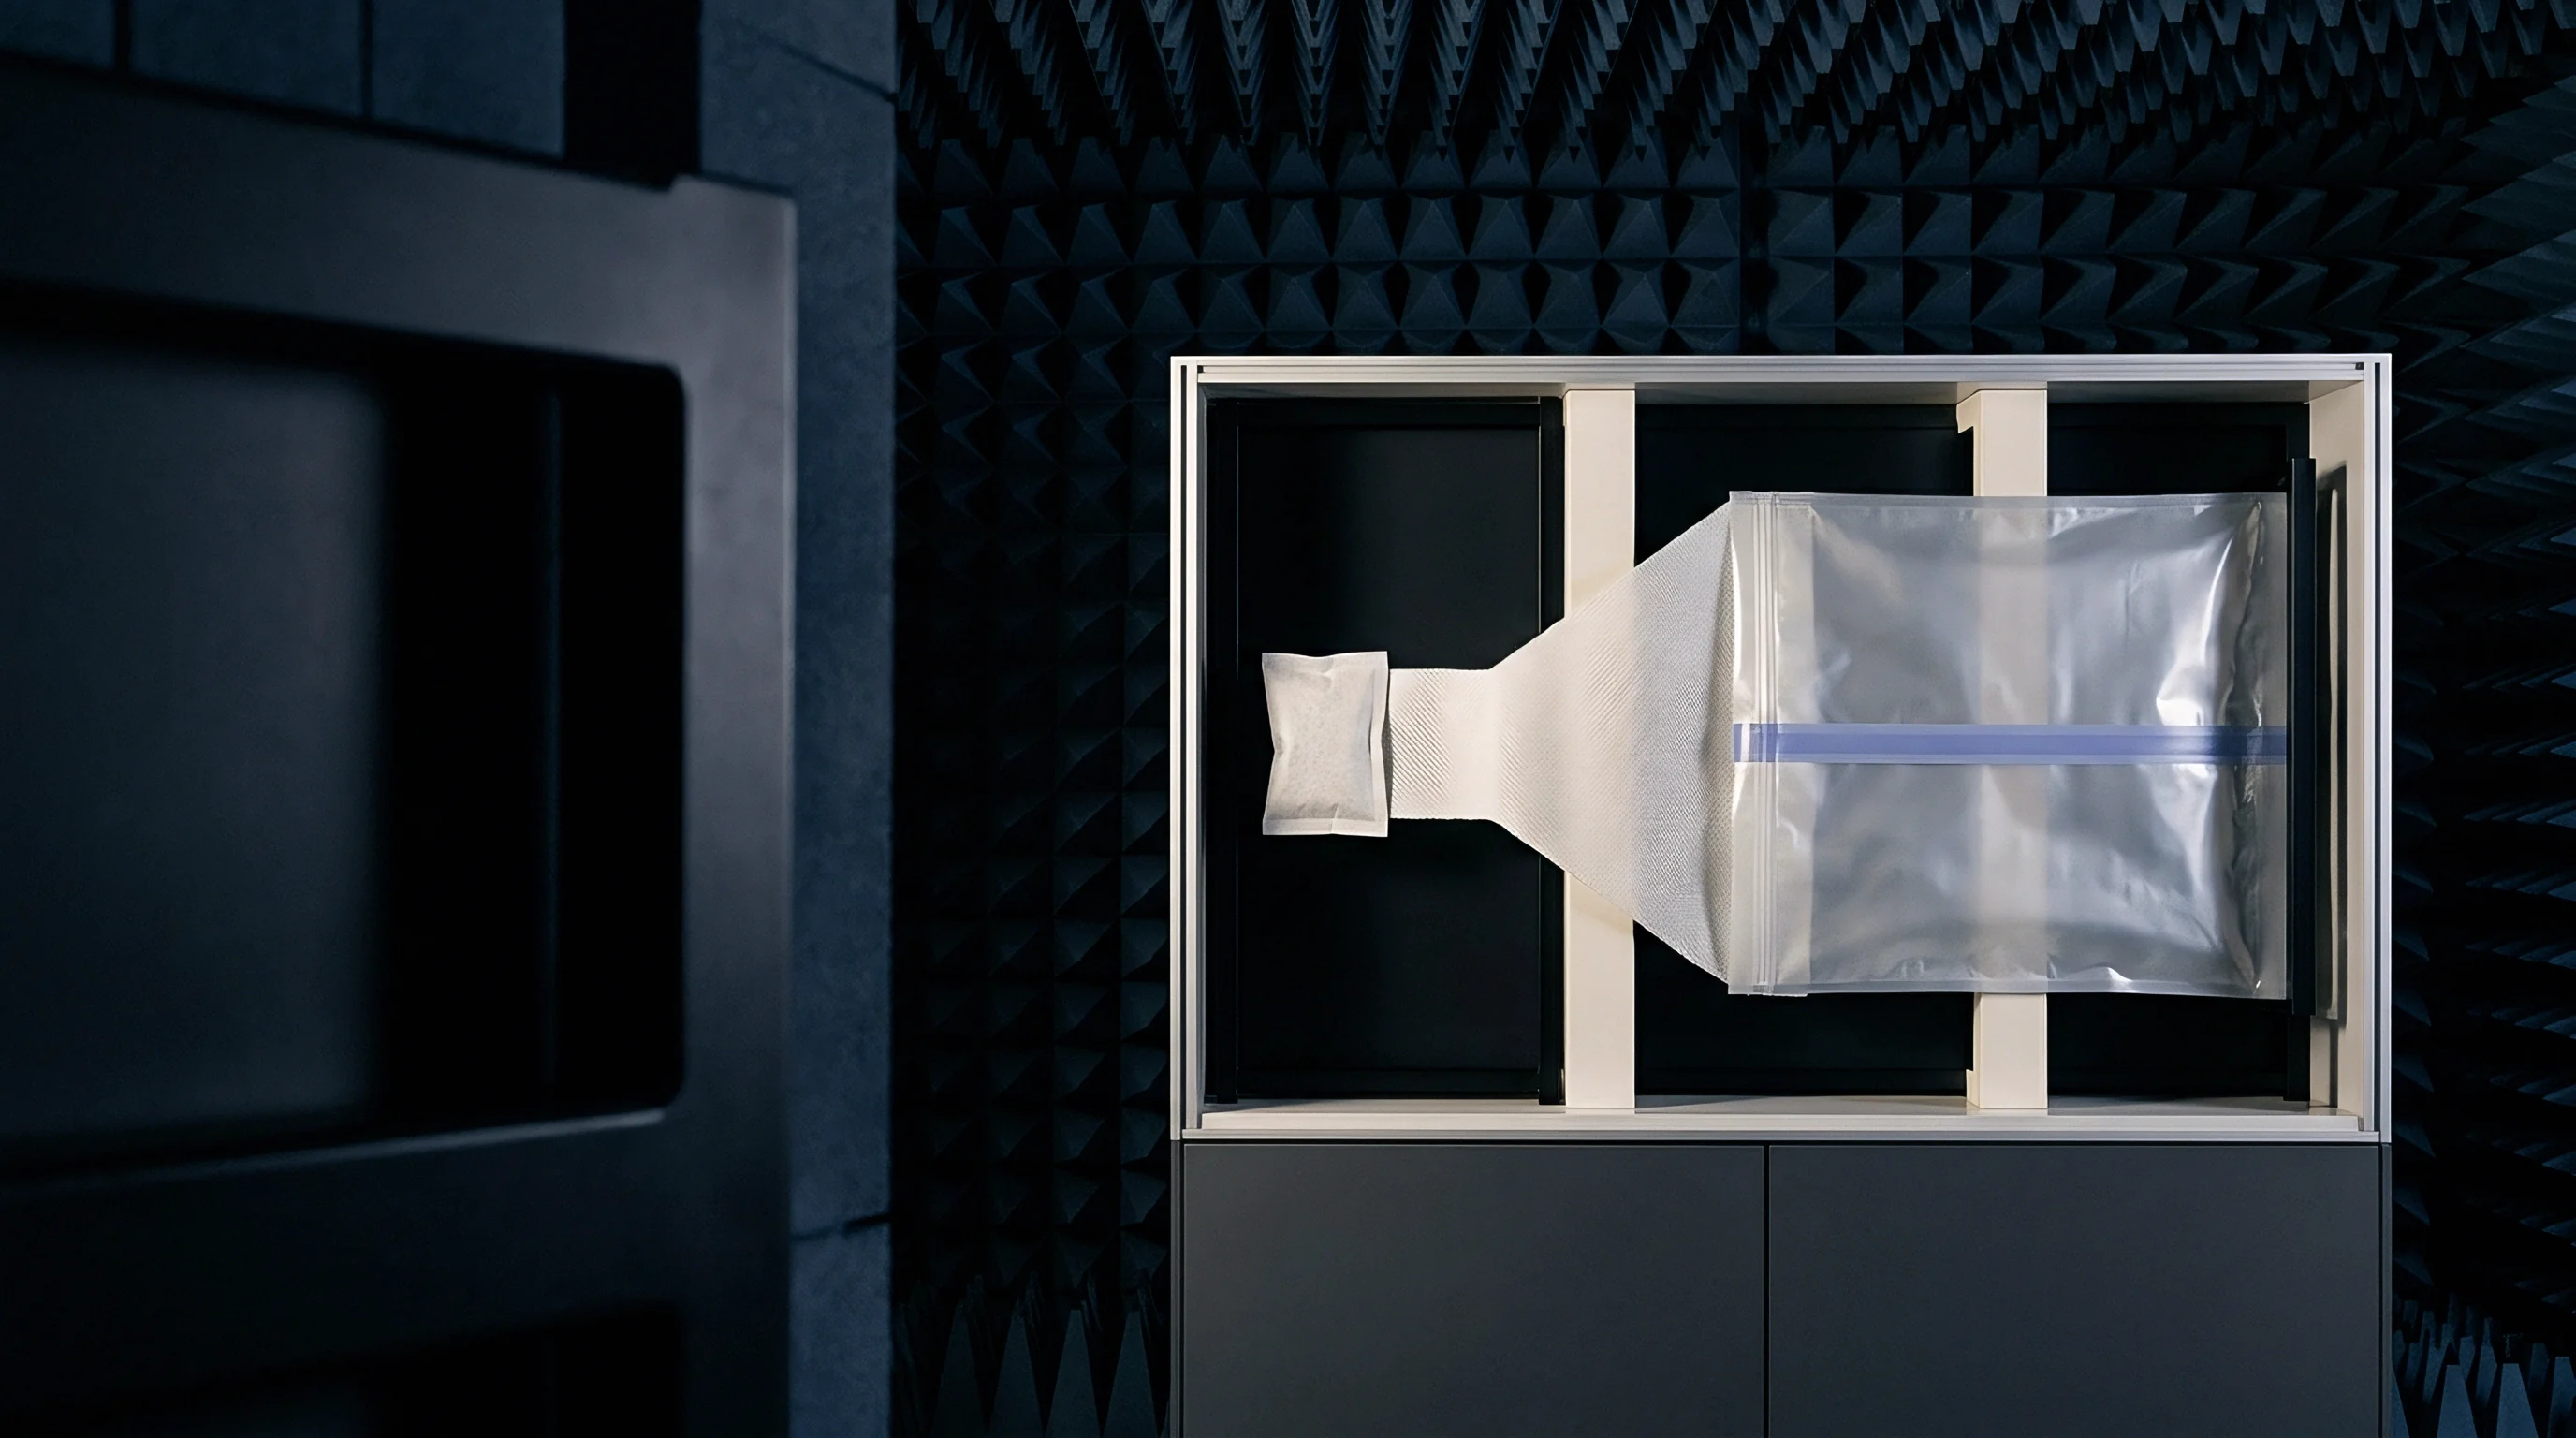
Calibration Architecture and Time Domain Gating
Free-space bench calibration uses Thru-Reflect-Line or Thru-Reflect-Match protocols adapted for unguided propagation. Establishing reference planes involves measuring an open air path, placing a flat metal reflector at the focal plane, and displacing one antenna by a known fraction of a wavelength. This procedure removes system errors, cable attenuation, and antenna transfer functions, allowing dielectric property extraction across the 76 GHz to 81 GHz band using spot-focused lenses.
Precise sample positioning preserves phase accuracy during frequency sweeps. Aligning plaque surfaces normal to the beam axis avoids refraction and path-length extension through the material, which would artificially inflate measured attenuation. Micrometer tilt mounts allow fine adjustment until reflection phase responses become symmetric.
Maintaining stable ambient temperatures prevents thermal expansion of optical rails from altering horn spacing during extended sweeps.
A free-space bench calibrated across 76 GHz to 81 GHz using Thru-Reflect-Line achieves dielectric constant accuracy within two percent when time-domain gating window length is restricted to 1.2 nanoseconds.
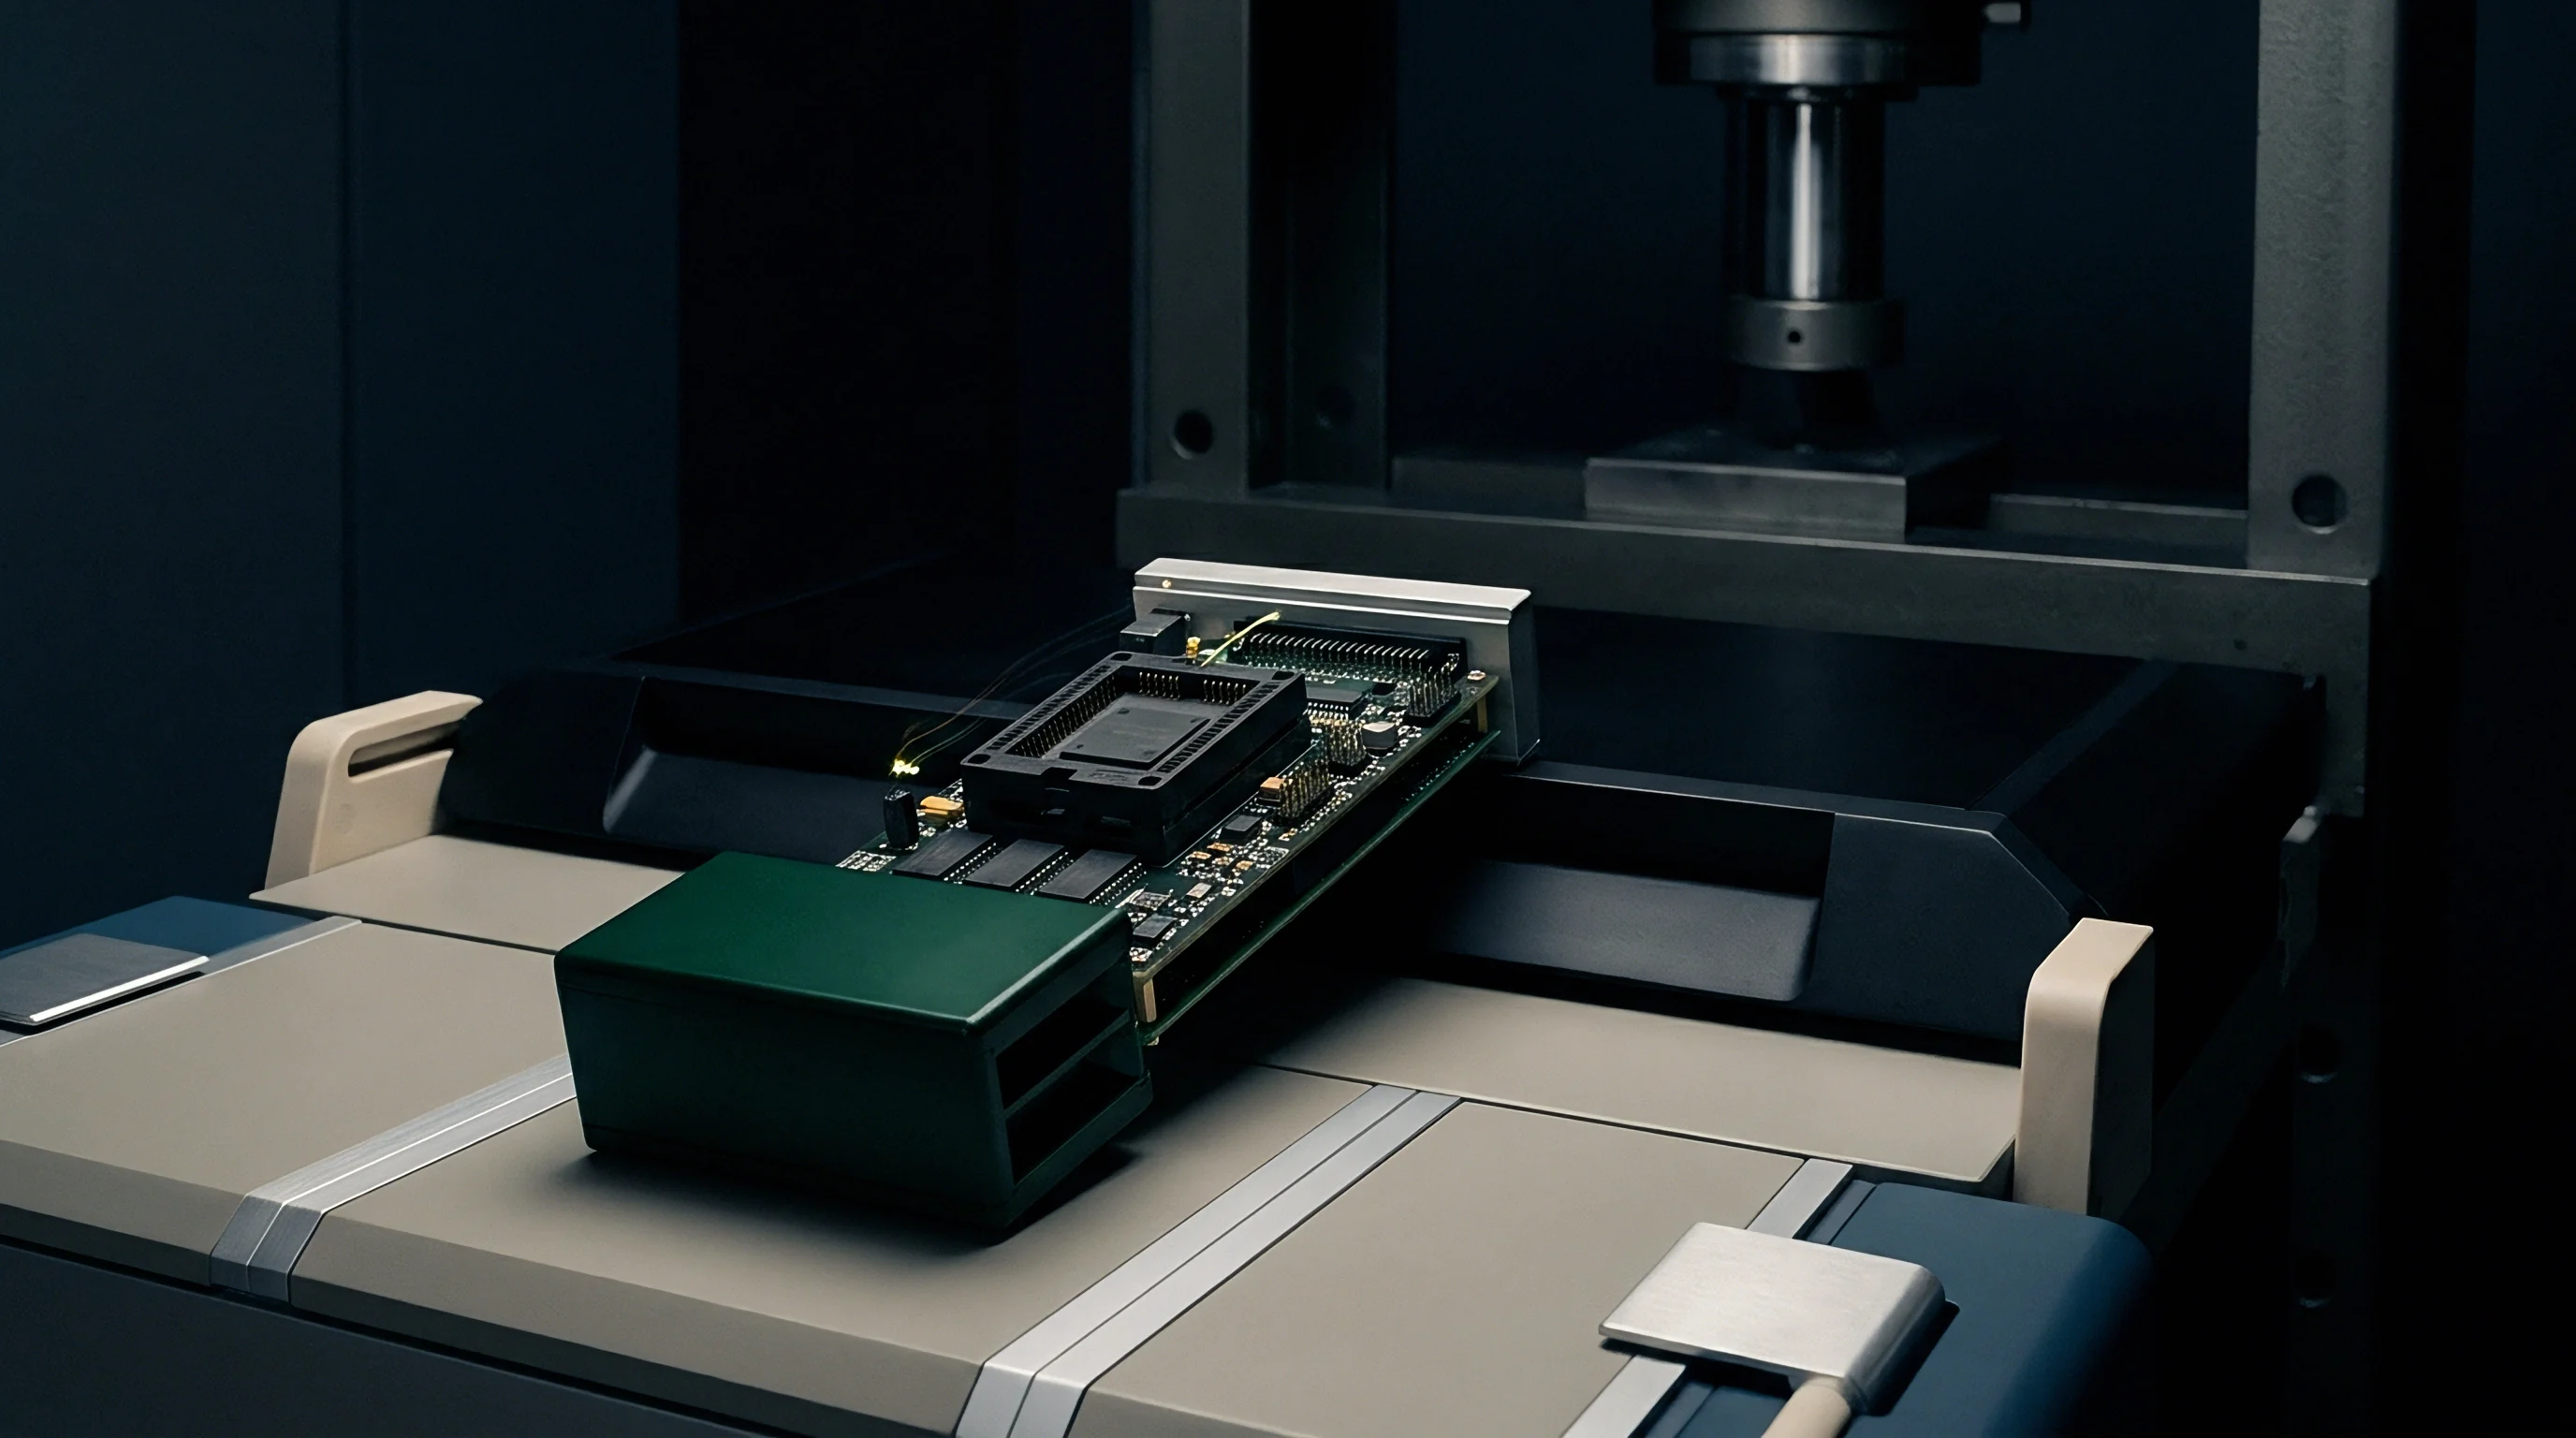
Can Enclosure Moisture Saturation Shift Radar Passbands?
Moisture-saturated polymers exhibit dielectric shifts that alter passband alignment across operating temperatures. Absorbed water elevates loss tangents while pulling peak transmission frequencies downward. Accelerated humidity exposure on polybutylene terephthalate plaques causes a 1.8 GHz downward shift in peak transmission, moving the optimal half-wavelength window away from 77 GHz and increasing path attenuation.
Thermal expansion interacts directly with moisture-induced shifts. Between minus 40 degrees Celsius and 85 degrees Celsius, falling polymer density slightly reduces relative permittivity while physical wall thickness expands. These opposing trends produce temperature-dependent phase shifts across the enclosure face.
Environmental test chambers evaluate these coupled effects by stepping ambient temperature while holding relative humidity stable across test plaques.
Identifying measurement error sources isolates material behavior from bench artifacts. Phase jitter in RF cables, antenna misalignment, plaque surface roughness, and system noise floors contribute to measurement variance. Structured calibration protocols keep total uncertainty below 0.15 dB for insertion loss and under 0.03 for real permittivity across the 76 GHz to 81 GHz band.
Data integrity requires logging setup parameters for every scan: raw time-domain responses, gated frequency spectra, ambient temperature, relative humidity, sample thickness measured across a nine-point grid, and the specific dielectric extraction algorithm applied.
- Sample Edge Diffraction Errors spill beam energy past plaque edges when the spot size exceeds sample dimensions, adding false ripple to transmission curves.
- Phase Cable Instability occurs when flexing extenders or cables changes phase delay while loading samples.
- Sample Non-Parallelism creates thickness gradients across the focal spot, blurring transmission nulls and corrupting loss tangent calculations.
- Standing Wave Multipath persists when time-domain gating windows are too wide, letting chamber wall reflections into the processing trace.
- Environmental Thermal Drift expands aluminum optical rails during long test runs, altering physical spacing between horn antennas.
Omitting routine cable calibration checks resulted in forty hours of re-runs after a damaged phase-stable cable assembly corrupted a full week of qualification data.
Molding
Thermoplastics like polycarbonate and polybutylene terephthalate undergo molecular orientation under cavity shear during injection molding. Flow dynamics govern local resin density, chain alignment, and filler distribution across the radome face, directly affecting RF attenuation and phase uniformity. Internal thickness variations or filler segregation during mold filling quickly turn nominal dielectric targets into inconsistent surfaces.
Injection pressure, melt temperature, and gate location control melt front behavior. High shear near the gate aligns polymer chains parallel to flow, causing dielectric anisotropy. Permittivity along the flow direction can differ by 3 to 5 percent relative to the transverse axis.
In radar arrays, this directional variance introduces spatial phase gradients that compromise angle-of-arrival calculations.

Anisotropy and Fiber Orientation Mechanics
Glass-reinforced compounds exhibit pronounced dielectric anisotropy as high-permittivity fibers align with melt flow. Fibers orient parallel to flow vectors near mold walls while maintaining random orientation in the central core. With glass fibers having a relative permittivity near 6.5 compared to approximately 2.8 for the matrix, fiber-aligned regions exhibit higher local dielectric constants along the orientation axis.
Suboptimal gate placement positions these transition zones over antenna arrays, distorting radiation patterns.
Cavity pressure profiles directly influence fiber orientation distribution within radome walls. Weld lines present another significant dielectric vulnerability: where advancing melt fronts converge, incomplete chain entanglement creates localized regions of lower density and altered orientation. These boundary lines act as dielectric step-changes, imposing phase discontinuities on passing radar waves that scatter energy, generate false targets, or reduce detection range.
Dimensional Tolerances and Wall Thickness Ripple
Tooling design governs dimensional uniformity across molding cycles. Wall thickness variations across a radome generate spatial shifts in RF transmission. A 30-micrometer variance in a 1.2 millimeter polybutylene terephthalate wall shifts 77 GHz insertion loss by 1.2 dB.
Sink marks over internal ribs or mounting bosses thin the wall locally, producing phase errors directly above radiating elements.
Mold wall temperature distribution governs crystallization kinetics in semi-crystalline polymers such as polybutylene terephthalate and polyphenylene sulfide. Cool mold zones freeze the polymer rapidly, reducing local crystallinity and density, while hotter regions permit fuller crystallization and higher permittivity. Maintaining uniform cooling across complex radome geometries prevents localized dielectric drift across production lots.
Conformal cooling channels assist in maintaining balanced temperature fields.
Uniform mold cavity wall temperatures across production runs prevent localized resin density variations that skew millimeter wave transmission profiles.
Incorporating regrind introduces material variability into the molding stream. Thermal re-processing degrades polymer chains, elevating loss tangents and generating microscopic degradation products. Gels and particulates act as internal scattering centers within the wall.
Limiting regrind content to defined maximum thresholds preserves dielectric performance across extended production runs.
- Verify raw polymer lot density and melt flow index through incoming quality audits before loading tools.
- Monitor cavity wall temperatures across four quadrant points using embedded thermocouples during runs.
- Measure plaque wall thickness across a nine-point grid with ultrasonic gauges to confirm dimensional uniformity.
- Scan molded plaques on a free-space optical bench to map spatial attenuation variations across the aperture.
- Examine cross-sections under polarized light microscopy to assess glass fiber alignment and core-to-skin ratios.
Varying regrind content between ten and thirty percent can introduce up to a 1.8 dB attenuation discrepancy across production batches, despite being treated in some operations as a standard processing tolerance.
Compliance
Type approval certifications for 79 GHz automotive radar systems bind output power limits to the complete enclosure assembly. Regulatory bodies like the FCC and ETSI establish maximum Equivalent Isotropically Radiated Power thresholds and spurious emission masks. Because the radome forms part of the RF path, changing resin formulations or wall dimensions alters total radiated field strength, necessitating regulatory reassessment.
Modular approvals allow suppliers to certify radar modules independently, but regulatory coverage ends at the antenna plane. Integrating an approved module behind a custom polymer bumper or housing creates a new host system. The integrator must confirm that the outer enclosure does not excessively attenuate fundamental emissions or generate harmonic spurs from non-linear dielectric response.

Modular Approvals and Host Enclosure Rules
FCC Part 95M rules regulate radar operation from 76 GHz to 81 GHz. While modular grants cover standalone RF units, mounting them behind untested plastic radomes alters field patterns and radiated power. A 3 dB housing attenuation reduces effective detection range by approximately 16 percent according to radar range equations.
Conversely, radome geometries that focus radiation risk exceeding regulatory EIRP caps or exposure limits.
European compliance under ETSI EN 302 264 mandates testing on fully integrated assemblies, including final radomes. Evaluation covers field strength, frequency stability across temperature range, and spurious emissions up to 220 GHz. Unvalidated polymer enclosures can reflect energy back into transmitter power amplifiers, pulling oscillator frequency and violating spectral mask limits.
| Regulatory Body | Standard / Rule | Max Peak EIRP | Max Average EIRP | Out-of-Band Limit | Enclosure Test Requirement |
|---|---|---|---|---|---|
| FCC (USA) | Part 95M | 55 dBm | 50 dBm | -30 dBm/MHz | Host validation required if radome altered |
| ETSI (Europe) | EN 302 264 | 55 dBm | 50 dBm | -30 dBm/MHz | Full radiated testing on final housing assembly |
| SRRC (China) | Radio Type Approval | 55 dBm | 50 dBm | -30 dBm/MHz | In-country sample test with production enclosure |
| ISED (Canada) | RSS-251 Issue 2 | 55 dBm | 50 dBm | -30 dBm/MHz | Re-assessment if housing alters antenna pattern |
Permissive Change Triggers across Major Markets
Altering enclosure materials on certified radar hardware triggers regulatory re-classification. Under FCC rules, changing resin matrices or shifting wall thickness beyond prescribed limits mandates a Class II Permissive Change filing supported by accredited laboratory radiated test data demonstrating performance equivalence. Non-compliance exposes products to market holds or enforcement action.
European regulations under Radio Equipment Directive 2014/53/EU place responsibility on the final Declaration of Conformity. Substituting an approved polymer matrix invalidates the technical construction file, requiring radiated spectrum re-testing before updating CE compliance documentation.
Under FCC Part 95M guidelines, any modification to a radar enclosure wall thickness exceeding five percent of nominal dimensions mandates a Class II Permissive Change filing supported by radiated field intensity measurements.
Compliance verification requires evaluating the combined module and housing inside an accredited anechoic chamber. Full 3D radiation pattern sweeps across azimuth and elevation planes confirm that main-lobe gain, beamwidth, sidelobe suppression, and total radiated power remain within regulatory limits under environmental stress.
- Chemical Matrix Verification confirms that base resin trade names, filler percentages, and color masterbatches match the technical construction file.
- Radiated Spurious Emission Sweeps measure harmonic emissions up to 220 GHz to verify the radome material generates no non-linear spectral components.
- EIRP Mapping verifies that dielectric absorption in the enclosure wall does not pull fundamental power below declared limits.
- Permissive Change Filing Dossier compiles comparative lab data proving performance equivalence following tool or material changes.
Procurement specifications commonly define resin formulations, additive loading, and mold release agents as controlled parameters, where unauthorized supplier modifications require re-qualification before lot acceptance.


Outlay
Budgeting millimeter-wave radar enclosure qualification involves accounting for anechoic chamber time, tooling iterations, and regulatory filing expenses. Sourcing evaluations focused solely on raw resin price per kilogram understate total validation costs. Chamber testing across operating frequency spans and environmental steps represents a substantial portion of overall development outlay.
Tooling revisions add substantial capital expense if material dielectric behavior is misjudged during initial design. Cutting production molds for complex radomes requires significant capital expenditure; discovering late attenuation spikes during chamber validation forces mold modifications or complete re-tooling. Characterizing resin properties on free-space test benches early mitigates the risk of post-tooling design changes.
Chamber Time and Sample Budgeting
Accredited millimeter-wave anechoic chamber time ranges from 2,000 to 4,000 USD per day. Qualification campaigns for automotive enclosures typically require three to five test days to cover radiation patterns, EIRP validation, and spurious emissions across thermal limits. Compliance failures or unexpected insertion loss force test halts and resin re-evaluations, compounding project delays.
Sample preparation logistics form an integral part of early test budgeting. Free-space bench characterization relies on flat test plaques molded between 0.5 millimeters and 3.0 millimeters across multiple resin lots. Evaluating several candidate formulations under varied humidity conditions consumes numerous test plaques and bench hours, but reduces technical risk prior to full chamber qualification.
Regional Filing Timelines and Retest Risks
Approval timelines directly impact commercial launch schedules. European CE mark self-declaration takes two to four weeks once lab documentation is compiled. Conversely, Type Approval through China’s SRRC or Japanese Giteki certification mandates in-country sample testing, adding eight to twelve weeks and 10,000 to 25,000 USD per jurisdiction in testing and administrative fees.
Supply agreements between Tier 1 automotive suppliers and resin compounding vendors incorporate strict change-notification clauses to maintain regulatory compliance. Unannounced modifications to color carriers or release agents risk invalidating certifications, where recall expenses, re-testing costs, and regulatory filings far outweigh material unit-cost savings.
- Base Resin Characterization Fees cover free-space optical bench testing across three plaque thicknesses to extract real permittivity and loss tangent curves.
- Anechoic Chamber Qualification Costs fund full radiated antenna pattern sweeps and EIRP validation across environmental limits.
- Prototype Tooling Revision Reserve allocates capital for mold modifications if physical wall thickness adjustments are needed for impedance matching.
- In Country Regulatory Filing Fees cover local administrative fees, laboratory sample processing, and local agent representation.
- Batch Verification Audit Budget maintains incoming material quality monitoring on production resin shipments over multi-year programs.
Managing global market entry requires balancing direct laboratory expenses against schedule risks associated with potential re-testing. Sourcing plans incorporate schedule buffers to absorb laboratory backlogs or regulatory queries. Rigorous early characterization protects development budgets and launch targets.
A continuing commercial challenge centers on the duration for which resin manufacturers guarantee dielectric tolerances before triggering formal re-qualification under supply agreements.