Calculating Combined Uncertainty Budgets for Analog Module Production Testing
Calculating combined uncertainty budgets pairs Type A repeated testing with Type B instrument specs to derive expanded test limits that limit false accept risk.


Noise
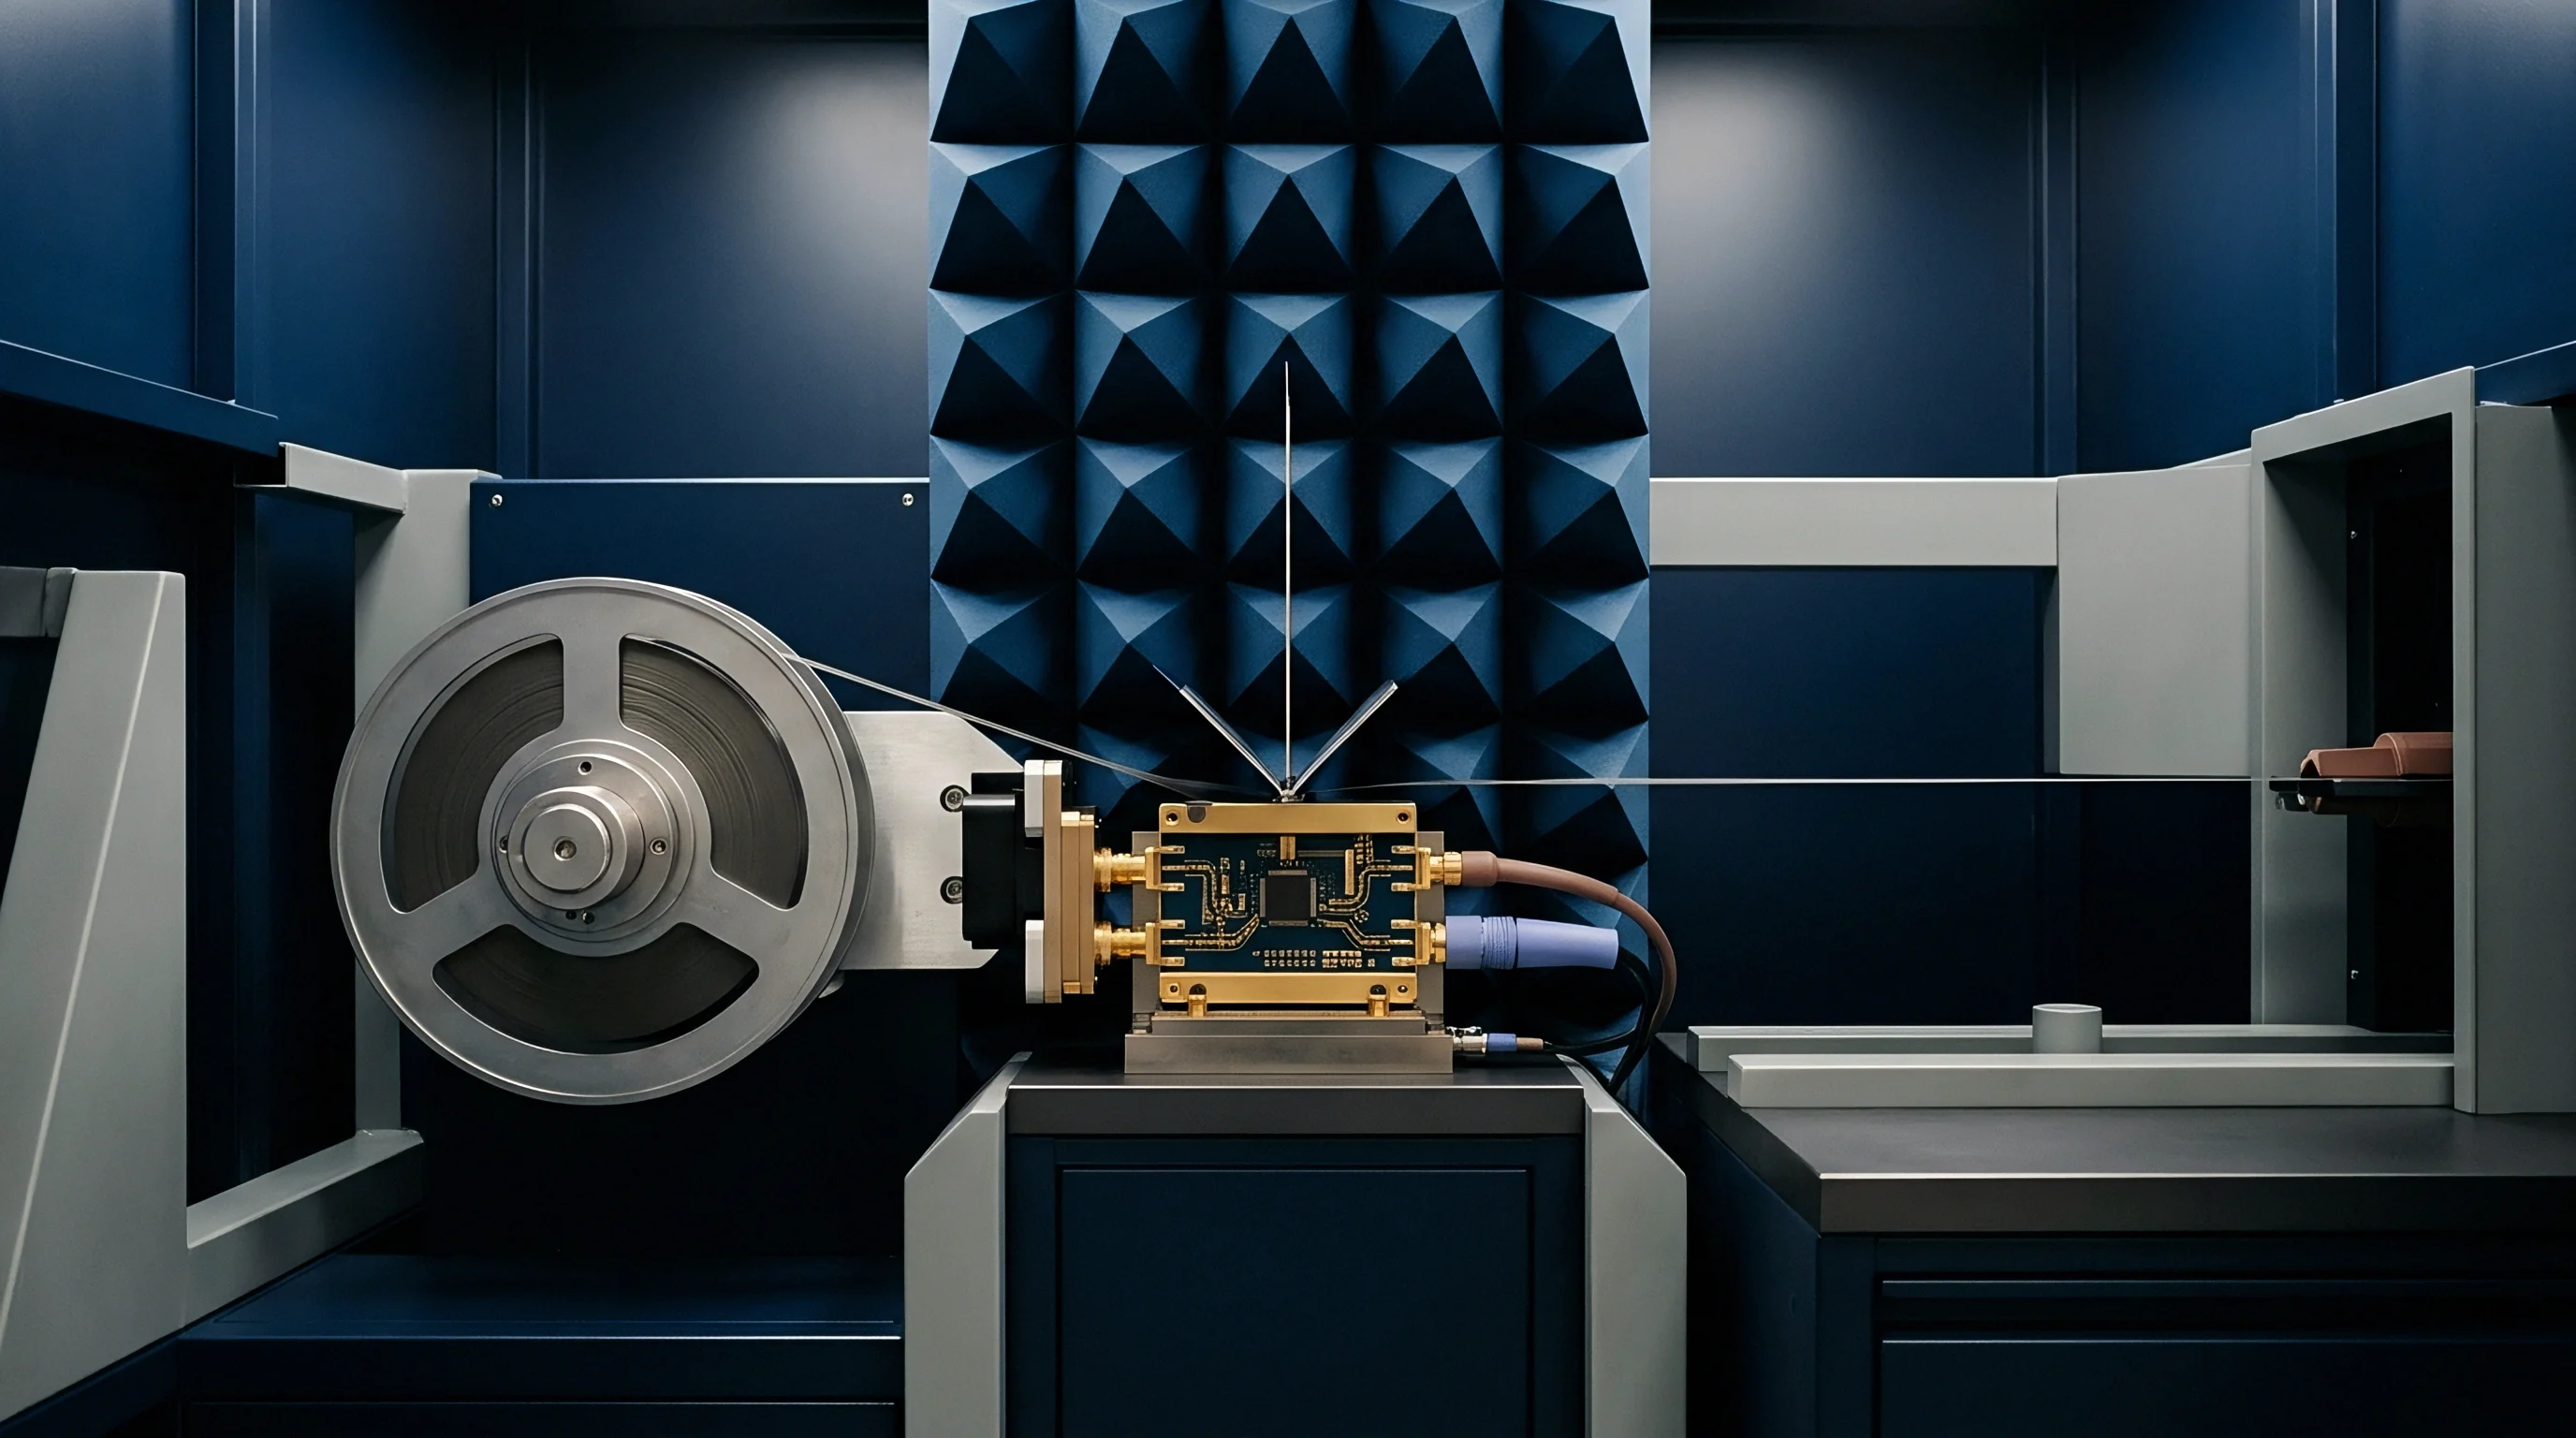
Precision measurement systems on automated production lines operate against physical limits set by thermal dynamics, component aging, and continuous signal degradation. When evaluation boards move from laboratory test benches into automated test equipment jigs, baseline parasitic effects alter test results. A turnkey module specification claiming sub-millivolt accuracy loses validity if the manufacturing test jig introduces unmodeled ground loops, contact resistance variability, or temperature-induced offset drifts.
Production test engineers must account for every energy conversion and potential drop between the Device Under Test (DUT) analog pins and the analog-to-digital converter backplane.
Quantifying these error sources begins with separating random variations from systematic offsets. Random fluctuations come from active semiconductors, thermal excitation in passive networks, and electromagnetic radiation picked up by unshielded cabling. Systematic errors arise from uncalibrated instrument offsets, trace attenuation, and gain non-linearities across signal paths.
Failing to inventory every parasitic contributor distorts the true performance profile of analog sub-assemblies during final acceptance testing.

Instrumentation Baseline Drift Factors
Electrical measurement reference sources experience continuous performance shifts driven by ambient factory changes and operating duty cycles. Voltage references inside Automated Test Equipment (ATE) instrumentation suffer from long-term stability degradation, typically expressed in parts per million over one thousand hours. Thermal coefficients convert ambient temperature swings on the factory floor into voltage baseline shifts.
A test rack operating in an unconditioned environment experiences ambient temperature variations up to fifteen degrees Celsius between morning bring-up and afternoon peak operations, moving internal reference values beyond single-digit microvolt boundaries.
Dynamic line loads on shared test bench power supplies introduce low-frequency ripple into sensitive measurement nodes. Current draw spikes from digital switching circuits alter common ground potentials across analog measurement interfaces, adding voltage offset components to the captured signal. Digital multimeter input bias currents interacting with source impedances generate additional offset voltages that vary directly with signal multiplexer channel selection.
Continuous analog production testing converts uncalibrated sensor drift into systematic test error.

Fixture Interface and Signal Conditioning Contamination
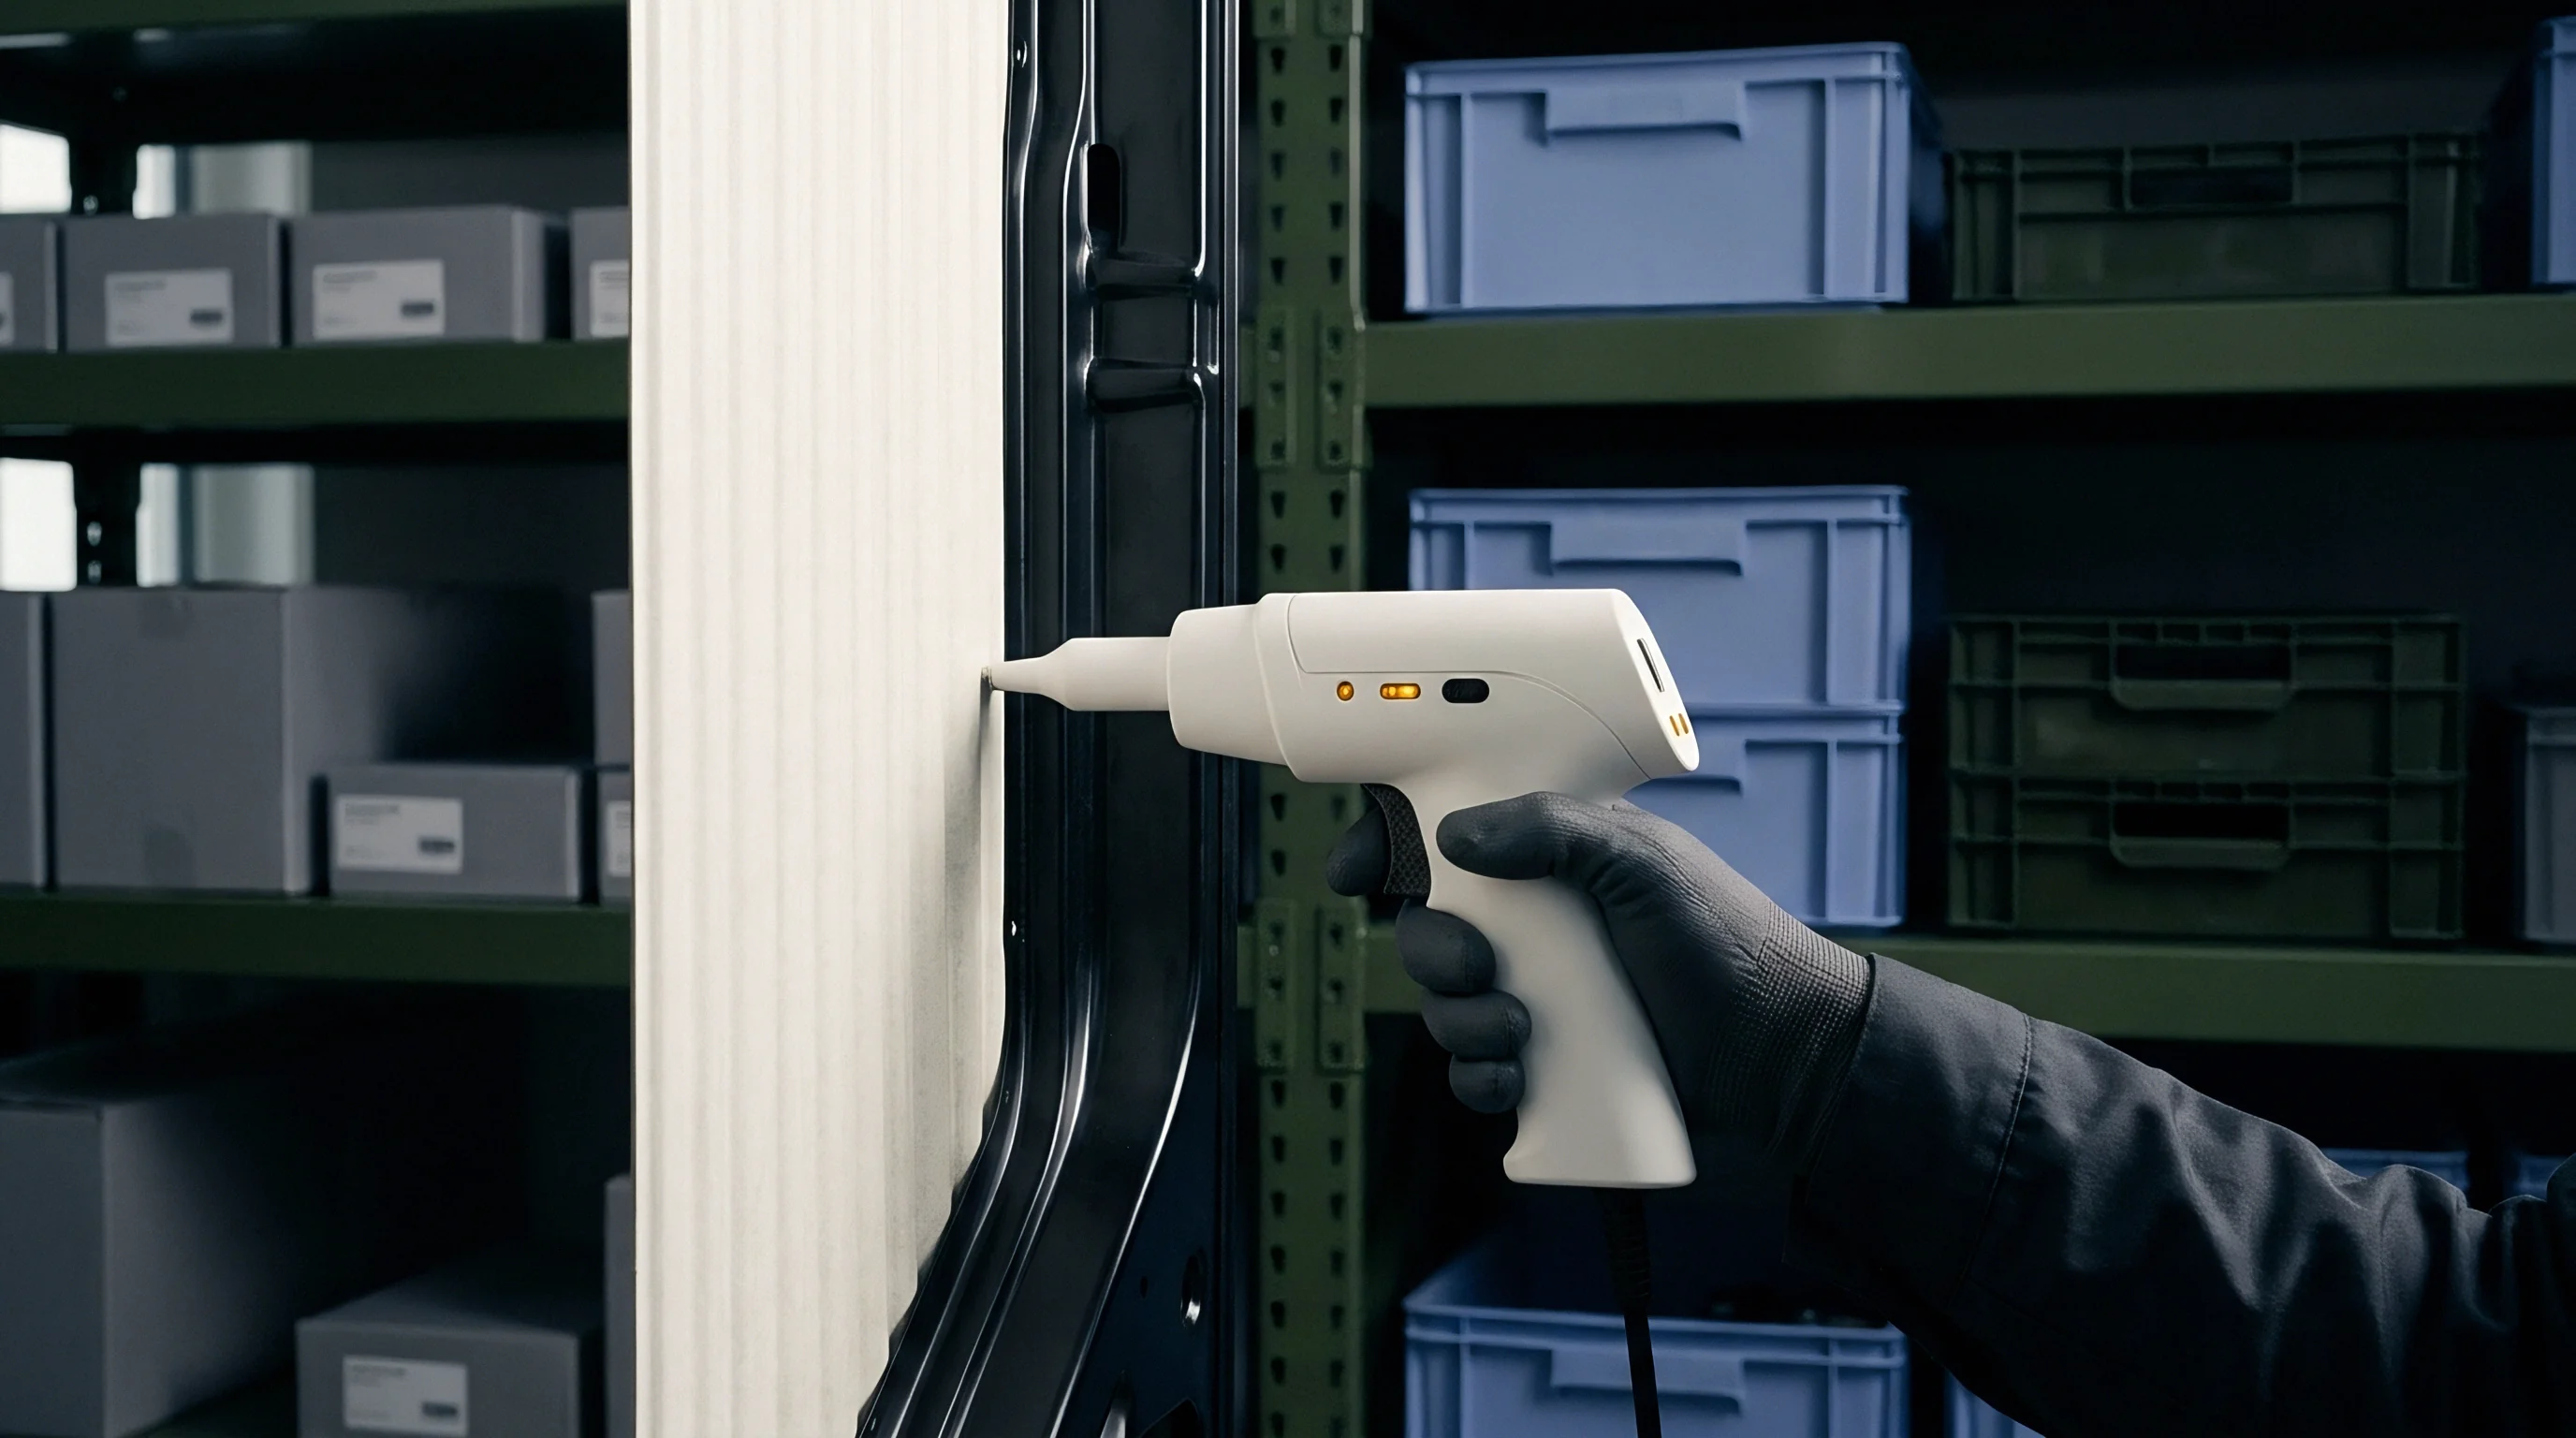
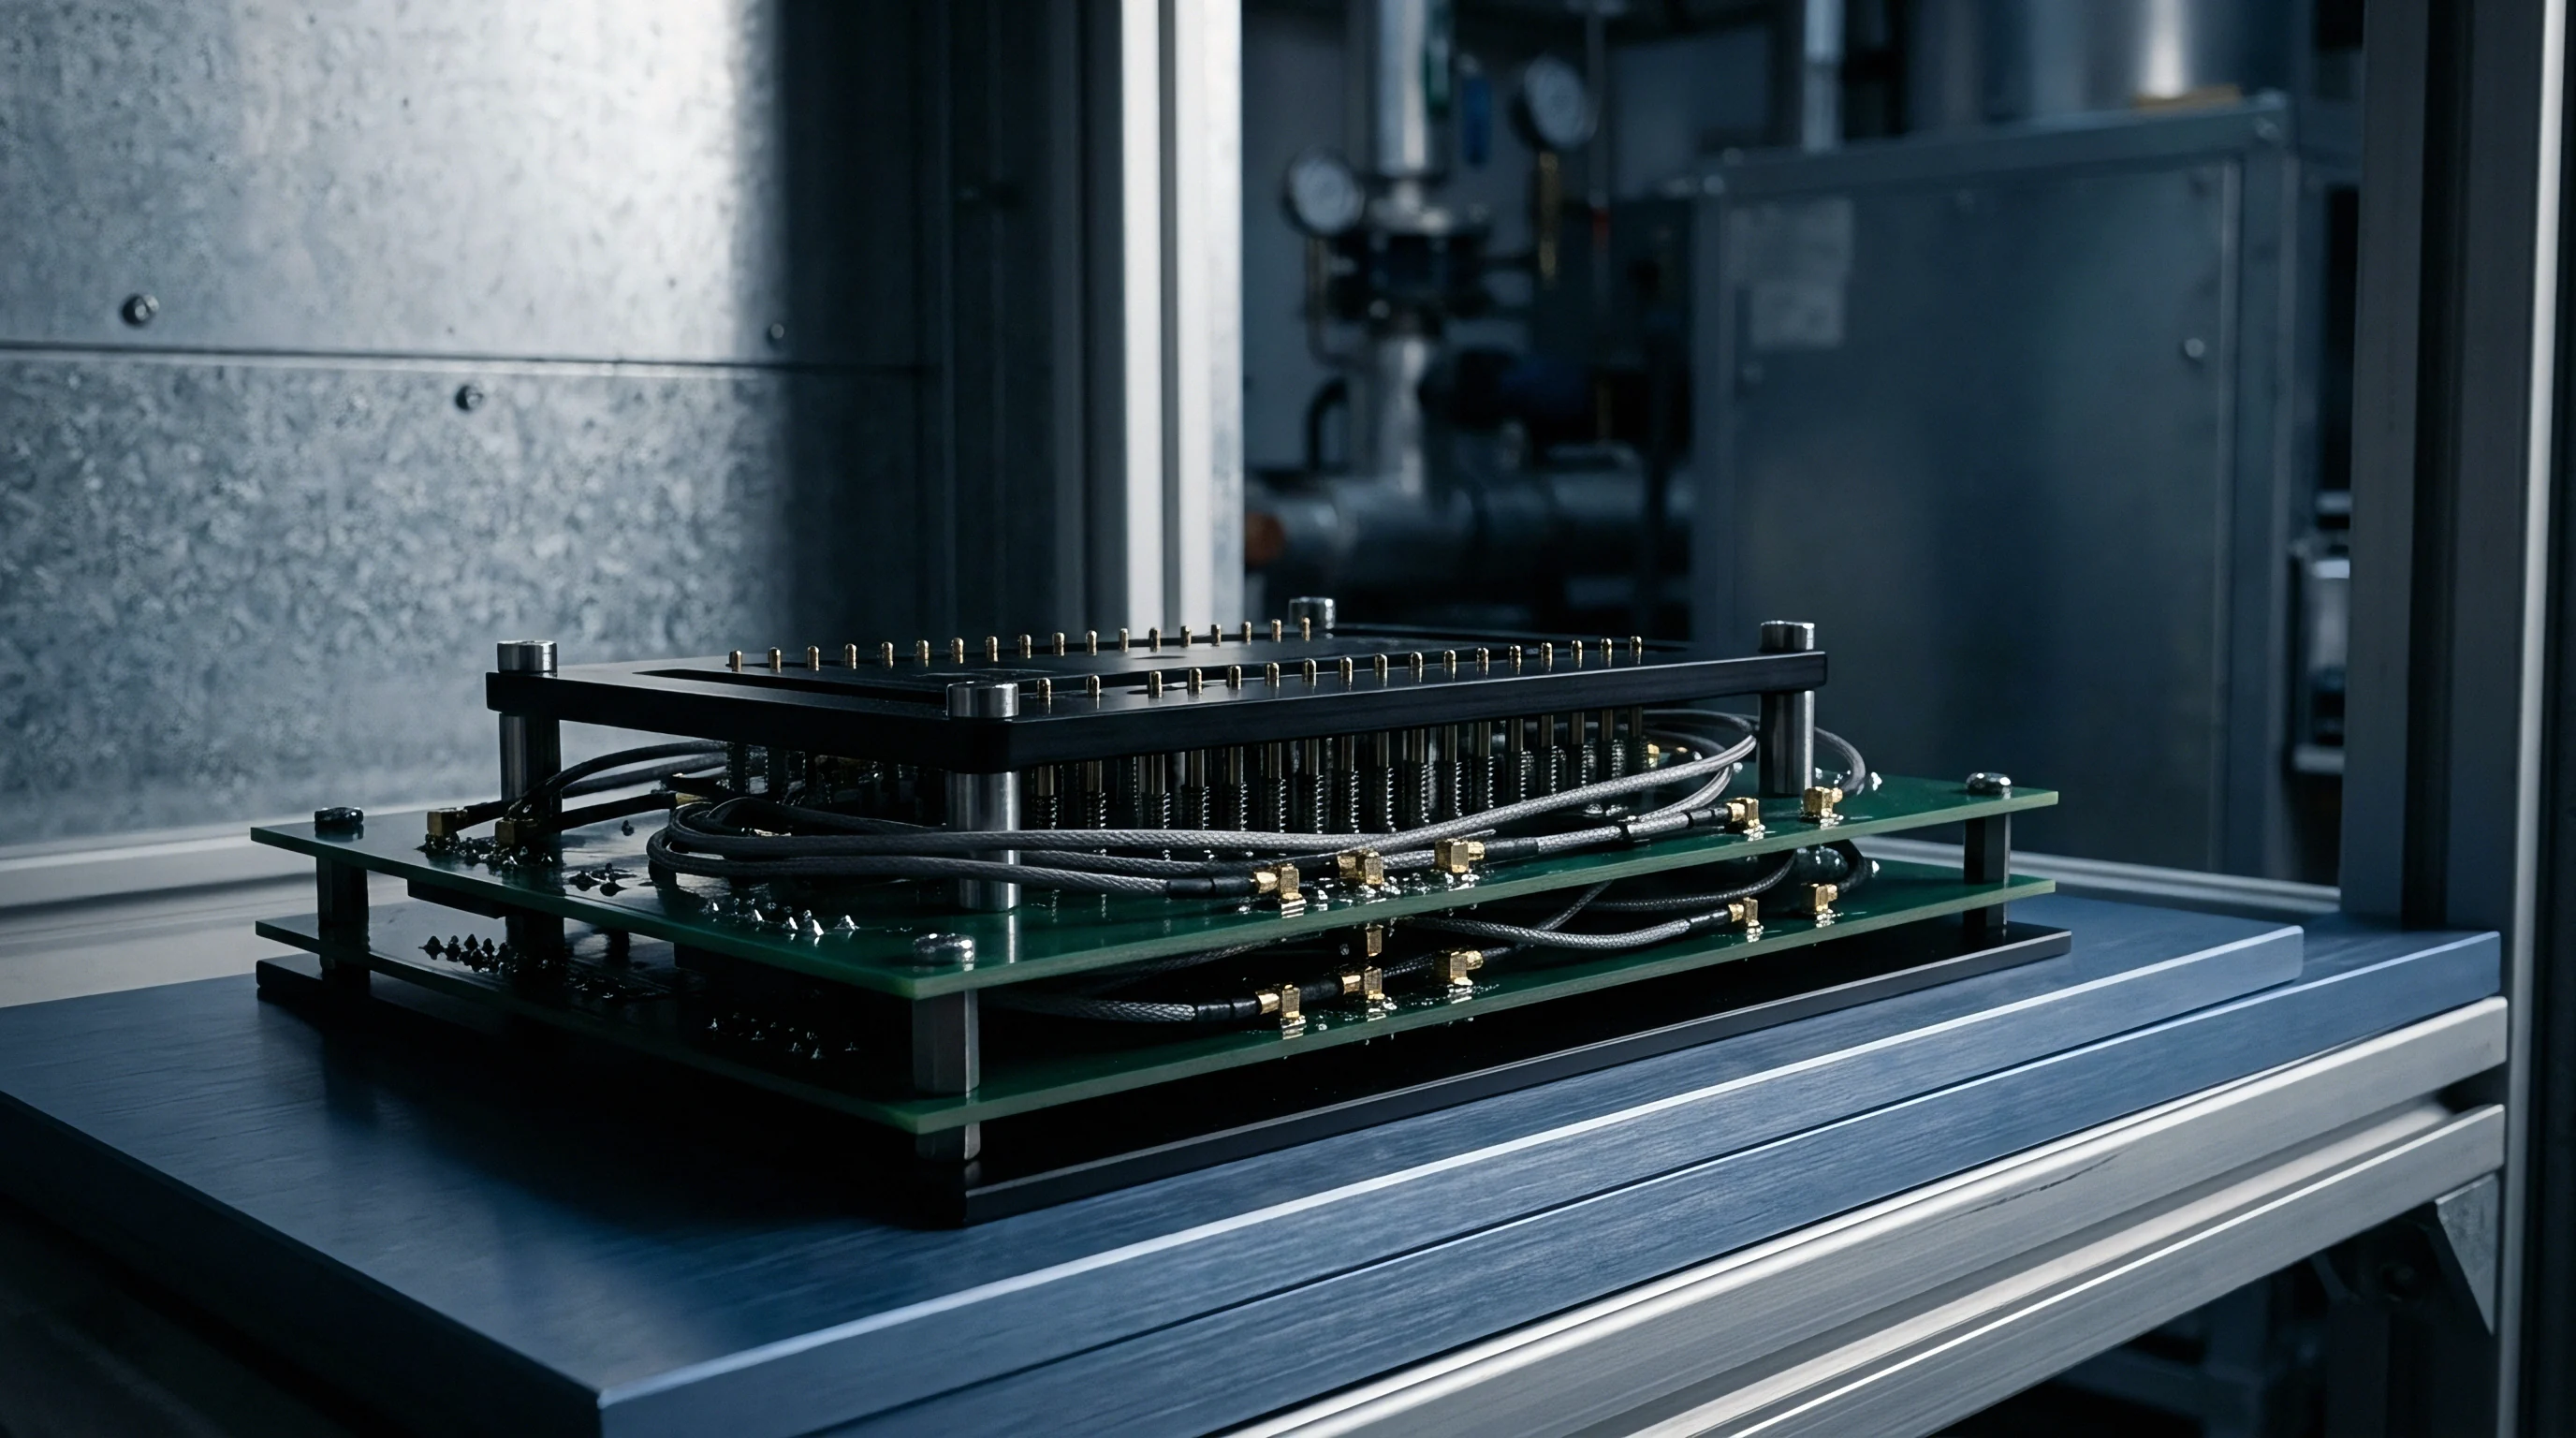
Mechanical interface hardware creates variable impedance nodes along the signal conduction path. Pogo pins contacting test pads on the printed circuit board assembly develop oxide layers, surface contamination, and mechanical spring relaxation over thousands of actuation cycles. Contact resistance across test points fluctuates from tens of milliohms to multiple ohms, generating variable attenuation on low-impedance voltage signals and substantial errors during precision current measurements.
Multiplexing switches on automated fixture interfaces introduce parasitic capacitance, charge injection, and channel-to-channel crosstalk. Semiconductor switch resistance varies non-linearly with signal voltage, adding gain error components to high-speed analog acquisition loops. Shielding boundaries broken near the fixture interface allow ambient factory interference, including industrial motor drives and power lines, to couple directly into high-impedance measurement nodes.
- Pogo Pin Oxide Degradation causes fluctuating series resistance across repeated test fixture engagements, generating unmodeled voltage drops on analog lines.
- Thermal EMF Generation occurs when dissimilar metals join across temperature gradients within the test fixture, creating spurious microvolt-level direct current offsets.
- Multiplexer Leakage Currents bleed current into high-impedance measurement nodes, shifting signal levels prior to analog digitisation.
- Power Rail Ripple Transmission introduces unwanted AC components into low-noise amplification stages during high-throughput parallel module processing.
Ambient temperature swings in contract assembly plants frequently fall outside reference design evaluation conditions.
Sensitivity
Converting disparate physical error sources into unified electrical units requires mathematically defining how each input disturbance affects the final test measurement. The Guide to the Expression of Uncertainty in Measurement (ISO/IEC Guide 98-3) defines standard methodologies for calculating combined budgets. Individual uncertainty components cannot be summed directly when they express different measurement units, statistical distributions, or functional relationships to the measured parameter.
Every error element must be converted into a standard uncertainty equivalent to one standard deviation.
Type A evaluation relies on statistical analysis of repeated observations taken under controlled test conditions. Type B evaluation relies on scientific judgment using external information, including instrument calibration certificates, manufacturer datasheets, physical constants, and historic batch performance trends. Establishing correct statistical distributions for Type B components prevents underestimating measurement variance or unnecessarily restricting production test pass bands.

Distribution Probability Shapes for Input Factors
Manufacturer specification sheets rarely provide raw statistical distribution data for instrumentation parameters. Test engineers apply standard statistical assumptions based on how tolerance boundaries are defined. When a vendor specifies an instrument parameter as an absolute maximum limit without a stated confidence level, a rectangular (uniform) distribution applies.
The standard uncertainty equals the half-width of the tolerance band divided by the square root of three.
Symmetric triangular distributions model error sources where values cluster near the center of the tolerance range, such as environmental room temperature controlled around a set point. The standard uncertainty equals the half-width divided by the square root of six. Gaussian (normal) distributions apply to calibrated standards or repeated measurement series where an expanded uncertainty is quoted alongside a specific coverage factor, typically k equals two for a ninety-five point four five percent confidence level.
U-shaped distributions represent cyclic physical phenomena, including sinusoidally varying temperature profiles or phase-angle modulation errors. For a U-shaped distribution, the standard uncertainty equals the half-width divided by the square root of two. Selecting the correct probability divisor directly changes the calculated standard uncertainty weight for each error source in the budget.

Partial Derivatives in Non Linear Transfer Functions
Functional relationships linking input error sources to the measured output parameter often involve non-linear mathematical equations. Partial derivatives quantify how sensitive the output measurement is to incremental changes in each specific input variable. The resulting partial derivative serves as the sensitivity coefficient, multiplying the standard uncertainty of the input term to yield the weighted uncertainty contribution in output units.
Consider an analog module testing an active current sense loop where output voltage depends on sense resistance, amplifier gain, and input current. The partial derivative of the voltage equation with respect to resistance defines the sensitivity coefficient for sense resistor tolerance. When partial derivatives are difficult to evaluate analytically, numerical differentiation methods calculate incremental output changes resulting from small step changes in individual input parameters.
| Distribution Profile | Assumed Error Behavior | Divisor Formula | Divisor Value | Application Context |
|---|---|---|---|---|
| Rectangular (Uniform) | Equal probability across full tolerance band | sqrt(3) | 1.7321 | Manufacturer maximum spec limits, digital resolution |
| Triangular | Peak probability at center, zero at limits | sqrt(6) | 2.4495 | Environmentally controlled ambient temperature drift |
| Normal (Gaussian) | Central clustering with extended tails | k (Coverage Factor) | 2.0000 | Calibration certificate values quoted at 95.45% confidence |
| U-Shaped | Extreme values more probable than center | sqrt(2) | 1.4142 | Cyclic thermal regulation ripple, phase offset errors |
Whenever an instrument specification sheet fails to state an explicit confidence interval, test engineers treat the stated error boundaries as a uniform rectangular distribution.

Propagation
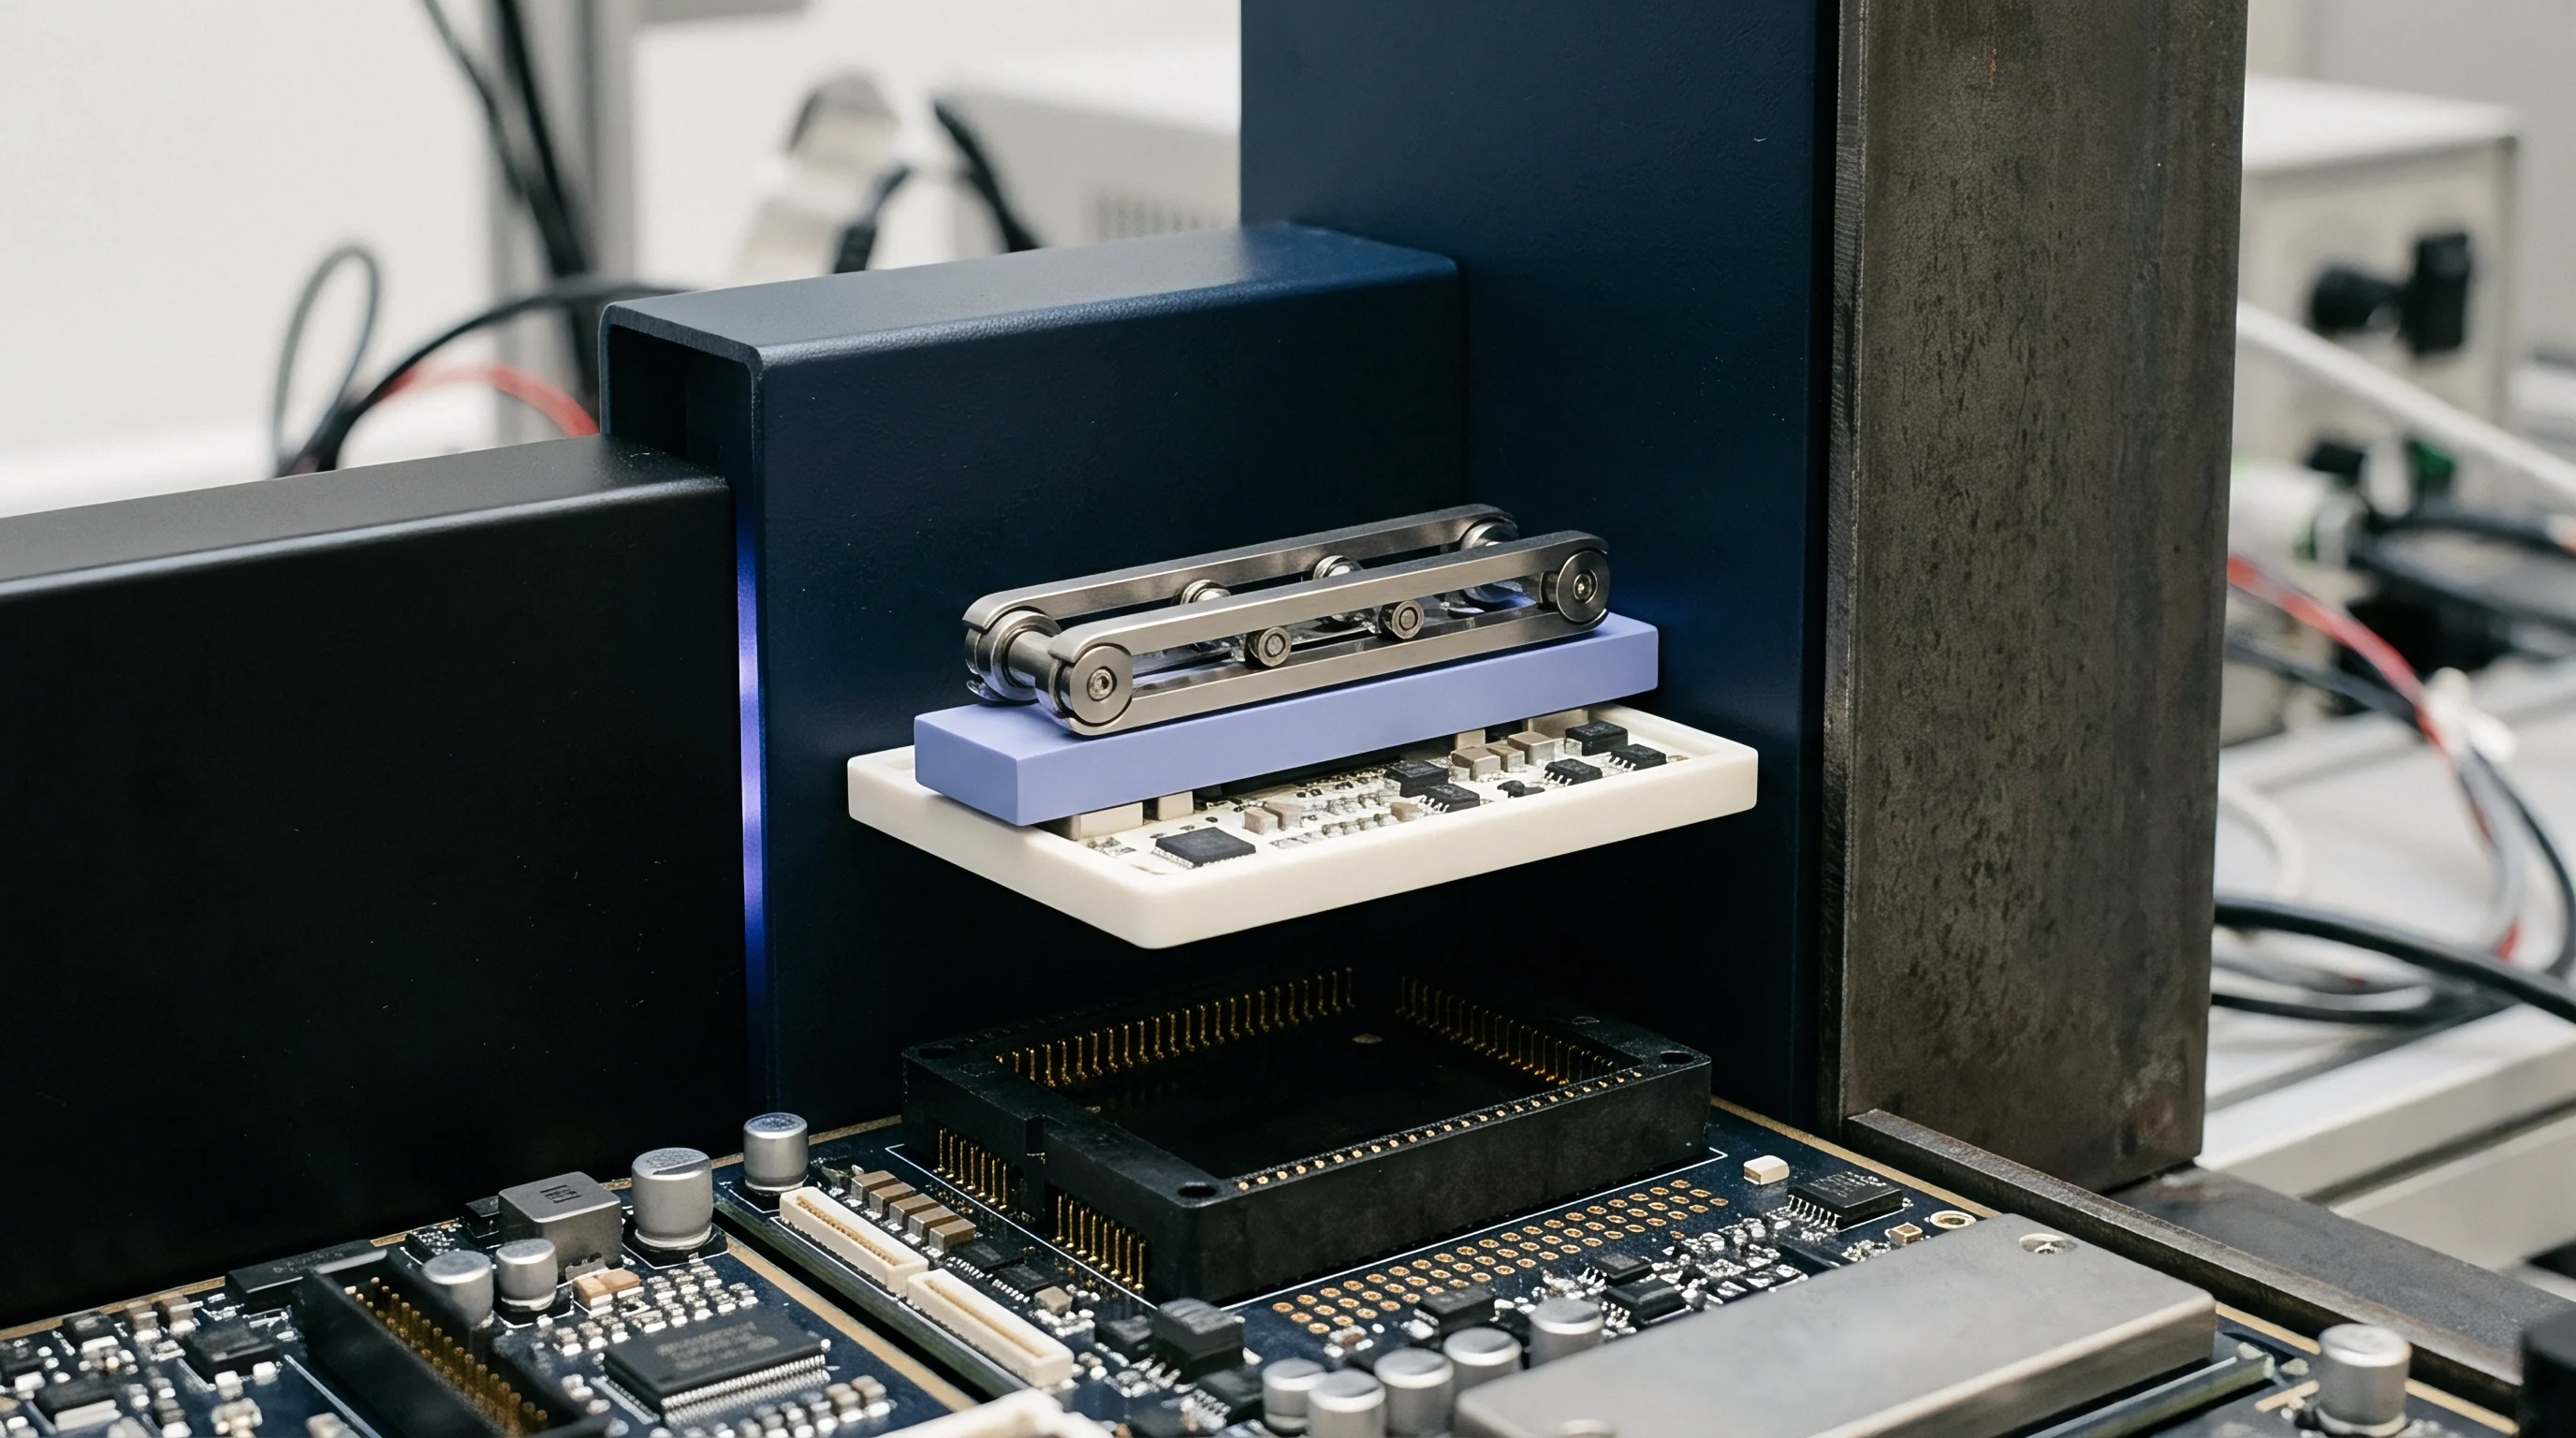
Mathematical combination of individual uncertainty components follows the law of propagation of uncertainty, based on a first-order Taylor series approximation of the measurement system transfer function. Combined standard uncertainty equals the square root of the sum of squared standard uncertainties multiplied by their respective squared sensitivity coefficients. Root-Sum-of-Squares (RSS) combination assumes that individual input uncertainties are completely uncorrelated.
Correlated inputs alter the combination formula by adding covariance terms. When two test signals share a common reference voltage, temperature sensor, or multiplexer ground, changes in one input correlate with changes in the other. Positive correlation increases combined variance, expanding the overall measurement uncertainty, while negative correlation reduces combined variance.
Ignoring covariance when cross-channel correlation exists produces invalid uncertainty budgets that overstate test system capability.

Summation Mechanics for Combined Standard Error
A concrete calculation demonstrates the combination process for an automated analog test jig measuring a high-precision three-volt module output. Assume the test system contains four primary error sources identified during characterisation:
Error Source A involves a digital multimeter DC voltage range with a manufacturer specification of plus or minus fifty microvolts under rectangular distribution. Standard uncertainty equals fifty microvolts divided by the square root of three, yielding twenty-eight point87 microvolts. The sensitivity coefficient equals one point zero.
Error Source B accounts for instrumentation amplifier thermal drift specified at plus or minus twenty microvolts over the local ten degree temperature delta, following a triangular distribution. Standard uncertainty equals twenty microvolts divided by the square root of six, yielding eight point 16 microvolts. The sensitivity coefficient equals one point zero.
Error Source C measures test fixture contact resistance variation, determined through Type A evaluation of thirty repeated engagements. The sample standard deviation equals fifteen microvolts with a sensitivity coefficient of one point zero. Standard uncertainty equals fifteen microvolts directly.
Error Source D represents ADC quantization error for a sixteen-bit digitizer across a five-volt full scale span. Resolution equals seventy-six point two microvolts. Quantization limits equal plus or minus thirty-eight point one microvolts under rectangular distribution.
Standard uncertainty equals thirty-eight point one microvolts divided by the square root of three, yielding twenty-one point 99 microvolts. The sensitivity coefficient equals one point zero.
Squaring individual standard uncertainties yields: Error A variance equals eight hundred thirty-three point four, Error B variance equals sixty-six point six, Error C variance equals two hundred twenty-five point zero, Error D variance equals four hundred eighty-three point six. Summing these variances gives a total variance of one thousand six hundred eight point six square microvolts. Taking the square root delivers a combined standard uncertainty of forty point one one microvolts.
An uncalibrated test jig operating at thirty degrees Celsius increases combined measurement variance by forty percent.
Degrees of Freedom via Welch Satterthwaite Equation
Calculating the coverage factor required to establish a expanded uncertainty at a specific confidence level requires evaluating the effective degrees of freedom for the combined system. Type B evaluations based on absolute datasheet limits effectively carry infinite degrees of freedom because the limits are assumed stable. Type A evaluations carry finite degrees of freedom based on sample size minus one.
The Welch-Satterthwaite equation calculates effective degrees of freedom by dividing the fourth power of the combined standard uncertainty by the sum of individual fourth-power uncertainty contributions divided by their respective degrees of freedom. When Type B uncertainties with infinite degrees of freedom dominate the budget, the effective degrees of freedom approach infinity, allowing the use of a standard coverage factor of k equals two for a ninety-five point four five percent confidence level.
| Error Source Description | Evaluation Type | Input Value (+/-) | Distribution | Standard Uncertainty (u_i) | Sensitivity Coefficient (c_i) | Uncertainty Contribution (u_i c_i) |
|---|---|---|---|---|---|---|
| DMM Reading Accuracy | Type B | 50.0 uV | Rectangular | 28.87 uV | 1.0 | 28.87 uV |
| Amplifier Thermal Drift | Type B | 20.0 uV | Triangular | 8.16 uV | 1.0 | 8.16 uV |
| Fixture Contact Resistance | Type A | 15.0 uV | Normal (n=30) | 15.00 uV | 1.0 | 15.00 uV |
| ADC Quantization Noise | Type B | 38.1 uV | Rectangular | 21.99 uV | 1.0 | 21.99 uV |
Neglecting cross-channel thermal covariance when calculating combined test variance leads directly to shipping out-of-spec mixed-signal modules that trigger field recalls across downstream automotive builds.


Coverage
Expanded uncertainty defines the interval surrounding a test result within which the true value of the measured parameter is expected to lie with a specified level of confidence. Multiplying the combined standard uncertainty by the coverage factor k yields expanded uncertainty U. For normal combined distributions, selecting k equals two yields ninety-five point four five percent coverage, while k equals three yields ninety-nine point seven three percent coverage. In production environments where product performance limits are contractual, expanded uncertainty directly influences factory test yield and customer quality risks.
Guardbanding shrinks product acceptance limits relative to design specification limits by an amount proportional to expanded measurement uncertainty. ISO 14253-1 defines decision rules for proving conformance or non-conformance with specifications. Applying strict guardbands protects the buyer from receiving non-conforming units (consumer risk) while transferring measurement uncertainty costs onto the manufacturing facility as false rejections (producer risk).
What Guardband Factor Prevents False Acceptance?
ANSI/NCSL Z540.3 specifies methods to restrict false accept risk below defined thresholds, typically establishing a target ceiling of two percent false accept risk. Achieving this risk level without guardbanding requires maintaining a Test Uncertainty Ratio (TUR) of four to one or greater, where TUR represents the product specification tolerance divided by the expanded measurement uncertainty. When test hardware limitations push the TUR below four to one, explicit guardbanding must be calculated to narrow test acceptance limits.
Calculating the guardband offset involves selecting a guardband multiplier Z applied to the expanded uncertainty U. A zero guardband (Z equals zero) sets pass limits equal to specification limits, relying entirely on TUR to limit consumer risk. A hundred percent guardband (Z equals one point zero) subtracts full expanded uncertainty from both upper and lower specification limits. Root-sum-square guardbanding offsets limits by the square root of the difference between total measurement variance and allowed target variance.
ISO 14253-1 establishes that test limits shrink by the full expanded measurement uncertainty unless contract terms explicitly allocate measurement risk to the buyer.

Commercial Alignment with Standard Specifications
Establishing test acceptance criteria requires systematic steps across design and production teams to prevent contractual disputes over rejected production lots:
- Compile complete list of measurement instruments, cables, fixtures, and environmental conditions present on the production floor.
- Obtain ISO 17025 accredited calibration reports for all primary reference instruments in the measurement chain.
- Calculate individual standard uncertainties for every identified Type A and Type B component using verified distribution shapes.
- Derive analytical or numerical sensitivity coefficients for non-linear conversion functions linking inputs to test parameters.
- Compute combined standard uncertainty using root-sum-of-squares summation, adding explicit covariance terms where shared references exist.
- Determine effective degrees of freedom via the Welch-Satterthwaite equation to confirm coverage factor selection.
- Multiply combined standard uncertainty by coverage factor k to establish expanded measurement uncertainty.
- Evaluate Test Uncertainty Ratio against specification bounds; if TUR falls below four to one, apply ANSI/NCSL Z540.3 guardband offsets to set automated equipment pass limits.
ANSI/NCSL Z540.3 Clause 5.3 specifies that test processes maintain false acceptance risk below two percent, which shrinks effective pass windows on automated test equipment.


Margin
Production yield models directly link measurement uncertainty calculations to factory unit economics. When combined measurement uncertainty expands test guardbands, marginal production units that fall between the guardband limit and the specification limit are rejected. These false rejections increase scrap costs or demand rework hours, driving up landed unit costs.
An engineering team that underestimates test system uncertainty creates hidden cost penalties through unexpected factory yield drop-offs during mass production volume ramp-up.
In turnkey engineering agreements, responsibility for test jig maintenance, calibration cycles, and fixture wear must be clearly allocated between buyer and contract manufacturer. A turnkey scope definition that transfers design ownership without transferring test uncertainty calculation models leaves the buyer vulnerable to sudden yield collapses when production shifts to a second-source assembly facility.

Transfer Package Deliverables for Production Jigs
A complete design transfer package covering automated production test equipment requires deliverables beyond schematics and test firmware scripts. The transfer dossier must contain the full mathematical uncertainty model in editable format, allowing manufacturing engineers to update parameters when test equipment is re-calibrated or replaced. Without source uncertainty files, contract factories cannot legally modify test software pass criteria when instrumentation models change.
Documentation requirements include calibration certificates for fixture standards, mechanical pin wear tracking guidelines, thermal characterization logs across factory ambient extremes, and statistical validation scripts for automated Type A evaluations. Contract terms must define whether the turnkey supplier or the factory owns non-recurring engineering charges related to fixture re-validation following instrument repair.

Financial Impacts of Yield Loss Calculations
Evaluating the commercial impact of uncertainty calculations involves analyzing how guardband options alter total production costs. Narrowing test limits via aggressive guardbanding eliminates customer return liabilities but increases scrap rates on expensive analog sub-assemblies. Choosing loose test limits improves immediate factory yield figures while exposing the product brand to field failure costs, warranty claims, and recall expenses.
Turnkey pricing models that include yield guarantees explicitly bound allowable measurement uncertainty. If a contract manufacturer commits to a ninety-eight percent line yield, that commitment assumes specific test uncertainty bounds. If the buyer insists on tightening test limits to satisfy ISO 14253-1 guardbanding without altering product silicon tolerances, the manufacturer invalidates the yield guarantee or increases per-unit assembly charges to offset anticipated scrap losses.
The long term balance between real time jig calibration costs and batch acceptance scrap rates remains open to ongoing economic analysis on high volume manufacturing floors.