Atomic Layer Deposition Interface State Dynamics in High Power SubGHz Switch Passivation Stacks
Atomic layer deposition alumina-nitride passivation nanolaminates hold interface trap density below 10^11 cm^-2 eV^-1, preventing high-power RF current collapse.
Film
Saturated surface reactions during self-limiting deposition steps define the physical boundary between insulating oxides and III-V or silicon switch channels. In high-power sub-gigahertz switches operating across 433 MHz, 868 MHz, and 915 MHz bands at power levels exceeding +36 dBm, the physical profile of this chemical transition dictates raw breakdown margin and radio-frequency power performance.
Atomic Monolayer Kinetics in Dielectric Passivation
Layer-by-layer growth via thermal or plasma-enhanced chemical sequences establishes structural uniformity over non-planar transistor gates and drain field plates. Alternating pulses of trimethylaluminum and vaporized water at growth temperatures between 250 degrees Celsius and 300 degrees Celsius yield amorphous aluminum oxide films with stoichiometric metal-to-oxygen ratios near 0.67. Precise thermal delivery prevents precursor condensation while maintaining complete ligand removal during each purge cycle.
Lower process temperatures leave residual methyl groups within the dielectric layer, acting as fixed negative charges that alter switch threshold voltages.
Sub-gigahertz RF power switches experience continuous high-voltage peak swings. At +38 dBm transmitter output into a 50-ohm load, peak RF voltages cross 35 volts across the off-state switch nodes. Dielectric films grown via atomic deposition yield dielectric breakdown field strengths above 7.5 megovolts per centimeter, preventing catastrophic breakdown during peak envelope excursions.
Non-uniform film thickness creates localized electric field concentrations, accelerating premature dielectric breakdown under sustained high-power continuous-wave transmission.
Dielectric layer composition directly controls dangling bond density along Gallium Nitride or Silicon-on-Insulator crystal surfaces. Oxygen plasma steps introduce energetic atomic oxygen radicals that passivate surface nitrogen vacancies on GaN HEMT channels, suppressing virtual gate formation. Excess radical exposure damages the underlying semiconductor crystal, forming disordered native oxides that increase mid-gap trap states.
An atomic layer deposition alumina passivation stack operating under 36 dBm RF power at 868 MHz maintains interface trap density below 1.2 x 10^11 cm^-2 eV^-1 when oxygen plasma exposure is limited to 15 seconds per cycle.
Precursor Stoichiometry and Plasma Chamber Conditions
Reagent choice dictates chemical contamination levels within the deposited insulating stack. Trimethylaluminum reacting with ozone generates films with lower hydrogen content compared to water-based processes, yielding higher bulk film density and reduced fixed charge density. Chamber pressure during reactant delivery directly governs purge efficiency and process throughput.
Maintaining base pressures below 0.1 Torr during nitrogen purge phases prevents gas-phase parasitic reactions that generate microscopic particulate defects.
Wafer processing equipment relies on exact mass flow control for vapor transport. Chemical purity of organometallic sources must exceed 99.9999 percent to prevent trace transition metal contamination inside the passivation layer. Iron, copper, and chromium impurities act as deep-level generation-recombination centers, accelerating field-assisted electron emission during off-state high RF voltage stress.
- Unreacted hydroxyl groups create fixed negative charge centers inside the dielectric bulk that shift off-state threshold voltages away from target pinch-off values.
- Carbon impurity incorporation forms localized conduction paths through the film, raising off-state leakage currents above 10 microamps per millimeter of gate width under high drain bias.
- Nitrogen vacancy formation along the semiconductor surface creates donor-type interface traps that capture hot carriers during peak RF voltage swings.
- Interfacial oxide growth between the deposited oxide and substrate introduces an uncontrolled native transition layer, broadening the energy distribution of fast interface states.
Sub-gigahertz switches require minimal parasitic capacitance to maintain high off-state isolation across wide frequency spans. Dielectric constant engineering balances physical thickness against capacitive loading. Alumina films exhibit a relative dielectric constant near 9, whereas hafnia layers reach values above 20.
Stacking alternating sub-nanometer layers of alumina and hafnia creates nanolaminates that suppress crystallization during post-deposition thermal processing while optimizing total capacitance.
Foundry operational sheets cite cycle times as the primary throughput bottleneck for deposition tools. Processing a 20 nano-meter nanolaminate stack requires over 200 individual precursor and purge cycles, driving thermal budget consumption during front-end wafer fabrication.
Barrier
Electronic states located at the dielectric-semiconductor junction exchange charge with the conduction band during peak RF signal excursions. Interface state density across the semiconductor energy bandgap establishes the magnitude of dynamic performance degradation in sub-gigahertz switching circuits.

Interface State Density Spectrum across Bandgap
Energy distribution profiles of interface defects display distinct peaks near the band edges and a broad continuous background across the mid-gap region. Near-conduction-band traps rapidly exchange electrons with the switch channel, responding within nanoseconds to localized electric field changes. Mid-gap traps possess longer response times, capturing carriers during extended transmit bursts and releasing them over millisecond or second intervals after signal power drops.
Trap density levels below 10^11 states per square centimeter per electron-volt are necessary to prevent measurable radio-frequency insertion loss expansion under power.
Surface pretreatment chemistry before oxide deposition determines initial interface trap distribution. Applying ammonium sulfide or hydrofluoric acid dips removes ambient native oxides, terminating surface bonds with sulfur or hydrogen atoms. Subsequent thermal deposition cycles displace these temporary capping species, allowing atomic precursor molecules to bind directly to semiconductor lattice sites without forming amorphous oxide transition zones.
| Passivation Stack Composition | Dielectric Constant (kappa) | Breakdown Field (MV/cm) | Interface Trap Density (cm^-2 eV^-1) | Dynamic Ron Increase at 915 MHz (+36 dBm) |
|---|---|---|---|---|
| Single-layer Al2O3 (20 nm) | 8.8 | 7.8 | 2.1 x 10^11 | 14.2 percent |
| PE-ALD SiNx (15 nm) / Al2O3 (5 nm) | 7.2 | 6.5 | 4.5 x 10^11 | 22.8 percent |
| Al2O3 / HfO2 Nanolaminate (18 nm) | 14.5 | 8.2 | 1.8 x 10^11 | 11.5 percent |
| AlN Cap (2 nm) / Al2O3 (20 nm) | 9.1 | 8.9 | 8.5 x 10^10 | 5.1 percent |
Post-deposition thermal annealing alters structural relaxation along the interface boundary. Annealing wafers in forming gas containing 5 percent hydrogen and 95 percent nitrogen at 450 degrees Celsius passivates residual unpassivated bonds. Hydrogen atoms diffuse through the dielectric matrix, bonding with unpassivated gallium or silicon atoms to eliminate deep electronic states.
Excessive thermal treatment causes precursor outgassing, creating physical micro-voids along the interface that degrade long-term breakdown stability.
Thicker capping layers attenuate surface acoustic wave generation but increase parasitic gate capacitance across sub-gigahertz switching channels.

Trap Emission Time Constants under High Swing Drive
Charge capture and emission rates follow exponential thermal emission processes governed by trap energy depth and capture cross-section. Fast interface states possess time constants between 0.1 nanoseconds and 10 nanoseconds, operating directly within the time scale of individual sub-gigahertz RF signal cycles. At 433 MHz, one RF cycle lasts 2.31 nanoseconds; at 915 MHz, the cycle period shrinks to 1.09 nanoseconds.
Fast states capture channel electrons during the positive peak of the RF voltage swing and emit them back during the negative peak, introducing non-linear dynamic capacitance into the switch channel.
Slow border traps located several atomic layers inside the passivation dielectric exchange charge via quantum mechanical tunneling. Time constants for border traps span from microseconds to minutes. Continuous-wave transmission at high power fills these border states progressively, building an electrostatic space-charge region near the semiconductor surface that depresses mobile channel electron concentration.
- Pinch-off voltage instability occurs when fast interface traps charge dynamically under peak RF voltage swings, shifting gate bias requirements during active transmission.
- Insertion loss creep develops during continuous power delivery as slow border traps fill, raising channel resistance incrementally over time.
- Phase distortion jumps emerge during power envelope transitions when trap emission lags sudden changes in average RF carrier amplitude.
- Uncontrolled thermal runaway initiates when trap-assisted leakage currents generate localized Joule heating, raising lattice temperature and further accelerating thermal carrier emission.
High electric field stress accelerates trap filling through field-assisted Poole-Frenkel emission and hot-carrier injection. Transistors operating in off-state switch branches experience intense lateral electric fields exceeding 500 kilovolts per centimeter between gate and drain electrodes. Electrons gaining energy from these fields overcome the conduction band offset barrier, penetrating into the dielectric and becoming trapped in permanent deep states.
Physical characterization of trap spectra leaves unresolved whether localized interface state distribution changes uniformly across the entire gate-drain access region or concentrates exclusively at the field-plate edge where peak electric fields occur during high-power sub-gigahertz switching cycles.

Drift
Dynamic channel resistance expansion during RF continuous-wave operation reduces power amplifier output efficiency and lowers total transmitter link margin. Trap occupation dynamics directly govern the magnitude of this channel resistance increase in high-power sub-gigahertz switch stacks.
Dynamic Channel Resistance Expansion at SubGHz Frequencies
Trapped electrons along the passivation interface act as a static virtual gate, depleting charge carriers from the underlying semiconductor channel. In the on-state, the transistor channel must present low resistance to minimize insertion loss. Dynamic resistance increase can exceed 30 percent over DC resistance values when switches operate under +40 dBm power at 868 MHz.
This resistance growth degrades transmitter power added efficiency, converting RF signal energy into waste heat within the switch die.
Carrier capture reduces mobile electron density within two-dimensional electron gas regions of GaN switches or inversion layers of SOI MOSFETs. Channel electron mobility also declines due to increased surface roughness scattering caused by ionized interface charges. The combined reduction in mobile electron density and electron mobility accelerates current collapse under pulsed or continuous-wave power conditions.
Qualification under JESD22-A108G mandates continuous high-temperature operating life testing to isolate dynamic channel resistance degradation before commercial release.
Thermal dissipation profiles worsen as dynamic channel resistance expands during continuous high-power operation. Increased power dissipation elevates junction temperature, which in turn increases trap capture cross-sections and thermal generation rates. This positive feedback loop accelerates long-term switch performance degradation, causing RF power modules to drop out of specification prior to their rated operational lifetime.
Sub-gigahertz frequency bands present distinct thermal and trapping challenges compared to microwave bands. The longer signal period allows traps with mid-range time constants to fully charge and discharge during each carrier cycle. This cyclical occupation modulates channel resistance at the RF carrier frequency, directly generating unwanted harmonic frequencies.
Harmonic Generation and Intermodulation Distortion Mechanisms
Non-linear channel resistance variations generate harmonic distortion components that violate regulatory spectrum emission limits. Second and third harmonic emissions generated inside the switch stack propagate to the antenna terminal, requiring additional high-rejection filtering in the RF front-end module. Non-linear capacitance variations resulting from voltage-dependent trap charge modulation also contribute directly to intermodulation distortion in multi-carrier sub-gigahertz systems.
Third-order intermodulation products generated within power switches degrade adjacent channel leakage ratios in cellular IoT, NB-IoT, and sub-gigahertz proprietary communications links. Two high-power blocking signals in adjacent channels interact within the switch non-linearity, generating intermodulation tones directly inside the desired receive band. Passivation stacks with high interface trap densities exhibit intermodulation levels 15 dB worse than stacks fabricated with optimized ALD alumina-aluminum nitride nanolaminates.
Hot carrier degradation accelerates under severe impedance mismatch conditions. When an antenna experiences severe detuning, reflected RF power doubles the voltage swing across off-state switch terminals. This voltage doubling accelerates hot-carrier injection rates into the passivation film, inducing permanent threshold shifts and permanent channel resistance elevation.
Selecting an unoptimized dielectric passivation stack leads directly to dynamic insertion loss degradation, increased harmonic emissions requiring bulky external filters, thermal overload, and early field failures in high-power sub-gigahertz radio transmitters.

Pulse
Bench measurement techniques must separate thermal self-heating effects from pure trapping phenomena when evaluating high-power sub-gigahertz switches. Transient electrical characterization isolates specific trap emission time constants across sub-microsecond to second ranges.
How Do SubGHz Peak Swings Alter Trap Occupation?
Large RF voltage excursions force channel electrons to periodically gain sufficient kinetic energy to overcome the conduction band offset at the passivation interface. High-voltage swings in off-state switches sweep carriers across the gate-drain access region, driving electrons into dielectric border traps. Higher carrier frequencies reduce carrier dwell time at peak voltage, changing the net trap capture rate per cycle.
Continuous RF drive forces trap occupation toward a steady-state equilibrium value dependent on signal power, carrier frequency, ambient temperature, and gate bias offset. Transitioning from a low-power standby mode to a high-power transmit burst triggers a transient settling phase as trap populations adjust to the higher power state. During this settling time, transmitter insertion loss and phase delay shift dynamically, degrading initial packet preamble transmission accuracy.
Sub-gigahertz power switches demand tight passivation control.
Transient Characterization Protocols on the RF Bench
Pulsed current-voltage measurements provide the primary method for isolating dynamic channel resistance from thermal self-heating. Narrow voltage pulses with duration under 200 nanoseconds apply drain and gate biases while measuring channel current. Quiescent bias points are varied from zero-voltage conditions to high-stress off-state conditions to pre-fill specific trap sets prior to measuring current response.
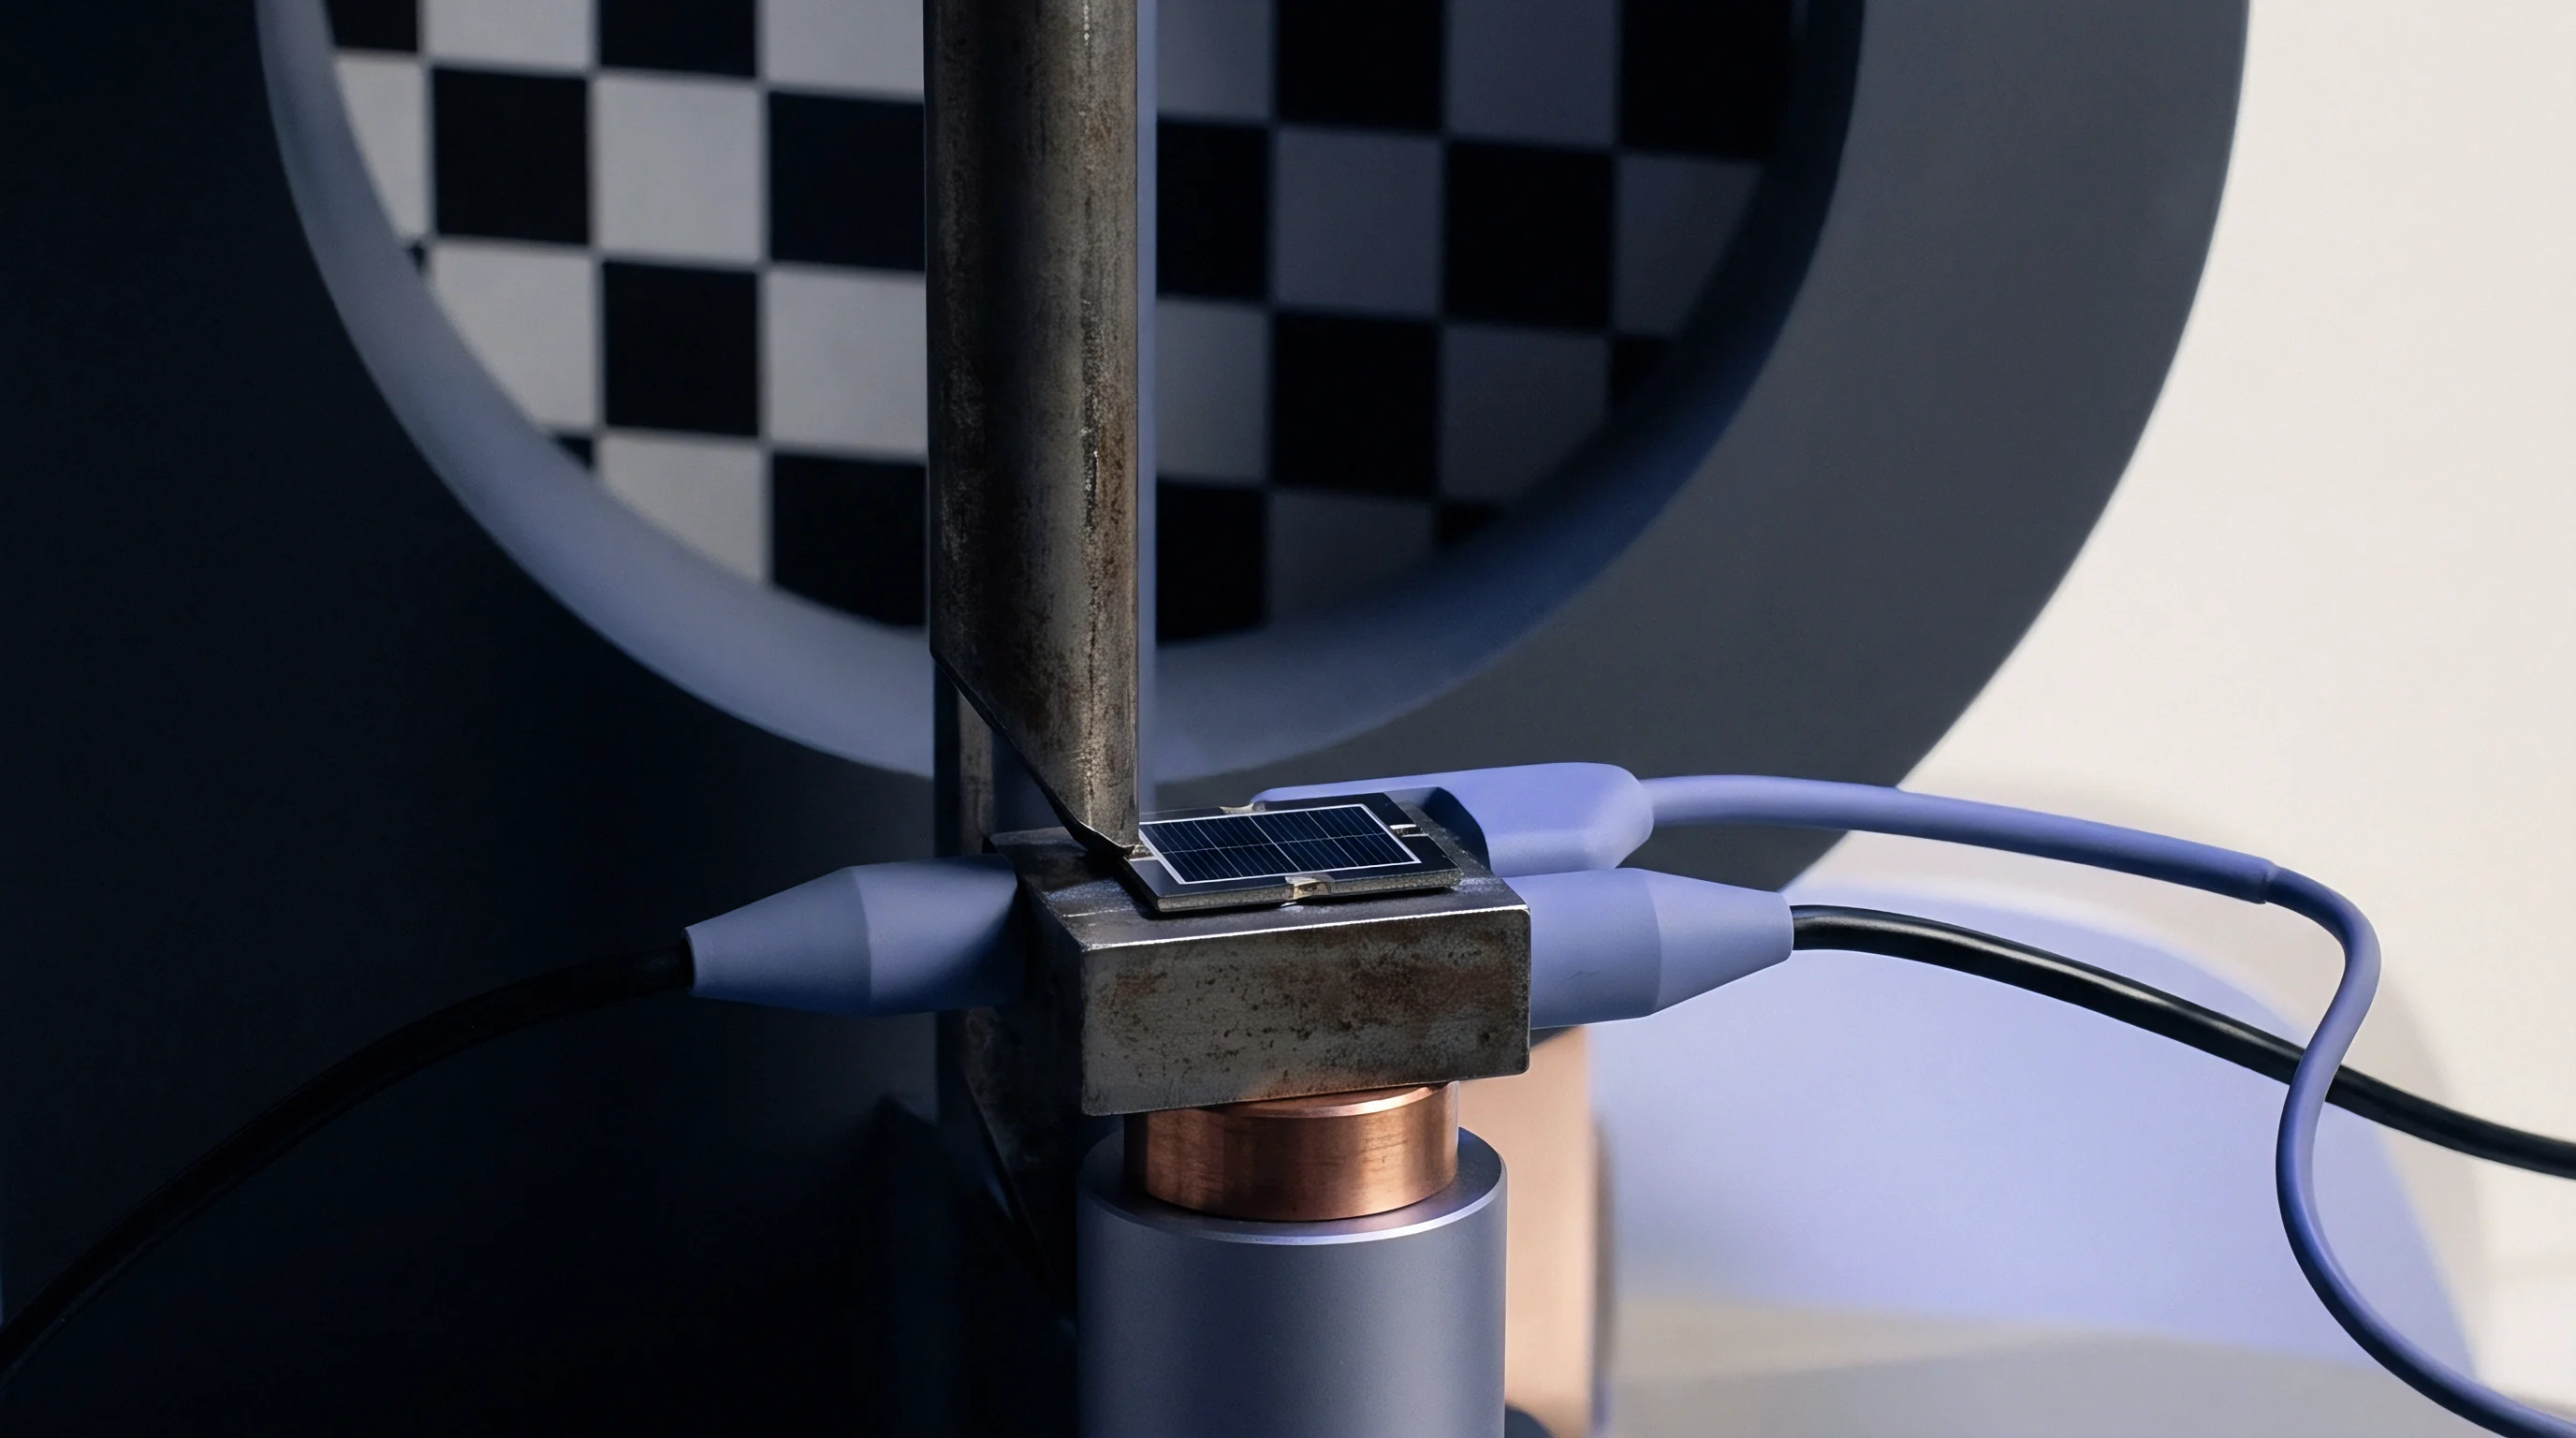
- Mount the unpackaged switch die onto a high-frequency coplanar waveguide test fixture with controlled 50-ohm line impedance and low thermal resistance.
- Establish baseline DC current-voltage characteristics across gate and drain operating ranges using a precision semiconductor parameter analyzer.
- Apply quiescent stress bias conditions with drain voltage at maximum operating level and gate bias at off-state pinch-off for a duration of 10 seconds to fill long-time-constant traps.
- Pulse gate voltage into the on-state for 100 nanoseconds while capturing drain current transient response using an ultra-high-speed digital storage oscilloscope.
- Repeat pulse measurements across temperature steps from minus 40 degrees Celsius to plus 125 degrees Celsius to generate Arrhenius plots for extraction of trap activation energy levels.
- Calculate dynamic channel resistance by dividing pulse drain voltage by peak transient drain current measured during the initial 10 nanoseconds of the pulse window.
Deep level transient spectroscopy adapted for field-effect transistor structures quantifies trap activation energies and capture cross-sections. Measuring capacitance or drain current transients across wide temperature ranges identifies specific physical defects within the passivation stack, such as oxygen vacancies or nitrogen antisites.
| Measurement Technique | Primary Parameter Extracted | Pulse / Sweep Duration Range | Sensitivity Limit |
|---|---|---|---|
| Pulsed I-V Characterization | Dynamic Ron, Current Collapse | 100 ns to 1 us | 1 percent resistance shift |
| Drain Current DLTS | Trap Activation Energy (E_A) | 10 us to 100 ms | 10^10 cm^-2 eV^-1 |
| RF Harmonic Load-Pull | Harmonic Distortion (HD2/HD3) | Continuous Wave / Burst | -90 dBc at +36 dBm input |
| Transient Phase Delay Sweep | Phase Creep during Burst | 1 us to 10 ms | 0.1 degree RF phase |
RF harmonic load-pull systems measure second and third harmonic power output as a function of fundamental source and load impedance under high power drive. Mapping harmonic generation contours across the Smith chart reveals optimal impedance termination conditions that minimize trap-induced non-linear distortion while maximizing output power.
RF peak voltage swings exceeding the gate breakdown threshold accelerate trap emission rates through field-assisted Poole-Frenkel conduction.
Pulsed measurements reveal true electrical performance when pulse widths remain significantly shorter than the thermal time constant of the semiconductor substrate.


Audit
Commercial qualification files for high-power sub-gigahertz switch modules require rigorous verification of dielectric deposition processes, precursor cleanliness, and long-term interface stability. Wafer pricing and yields depend heavily on maintaining tight deposition process windows.
Wafer Processing Yield Metrics and Cleanliness Margins
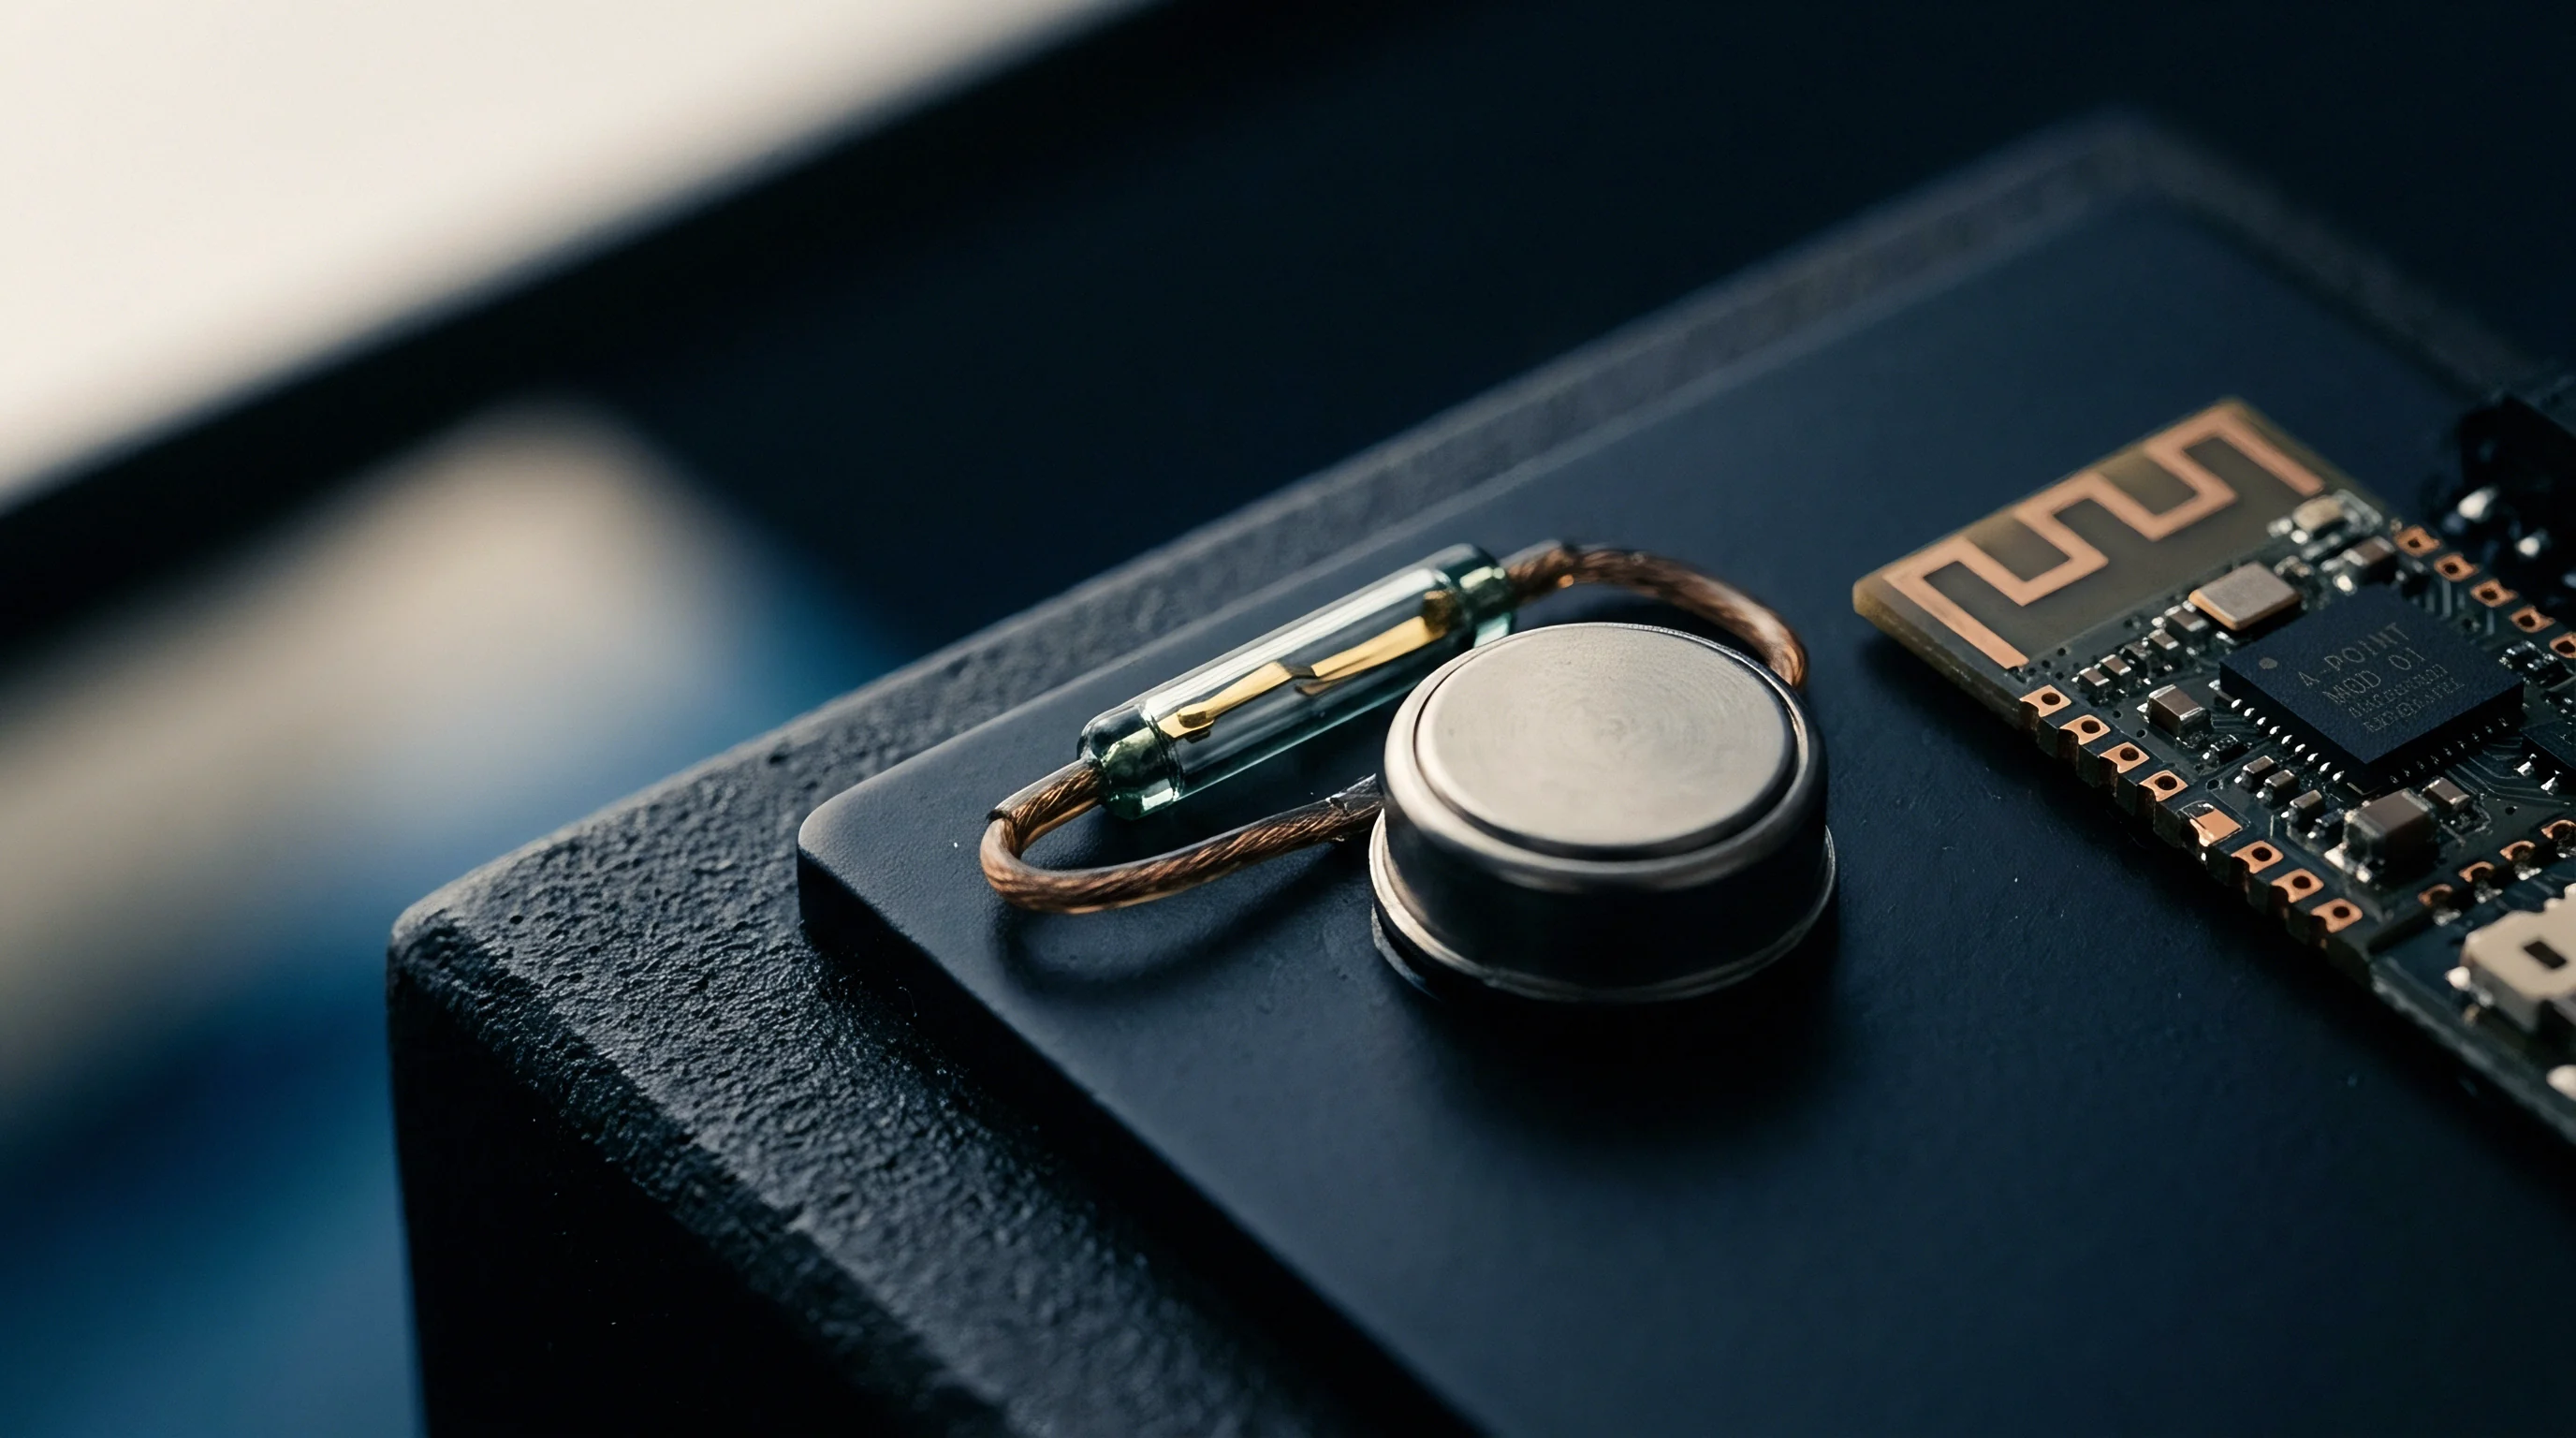
Particulate contamination during atomic layer deposition creates localized physical pinholes that severely degrade dielectric breakdown yield. Operating deposition reactors in Class 1 cleanroom environments with automated wafer handling minimizes defect density. Wafer yield scales inversely with total defect count; a single pinhole defect within the high-field gate-drain region results in catastrophic dielectric breakdown during final factory RF screening tests.
Chemical composition screening via X-ray photoelectron spectroscopy and secondary ion mass spectrometry verifies precursor reaction completeness and stoichiometric balance across full 200 mm or 300 mm wafer surfaces. Wafer edge exclusion zones must remain below 3 millimeters to maximize usable die yield per wafer, requiring precise radial gas distribution inside the reactor chamber.
| Passivation Process Type | Relative Wafer Processing Cost Delta | Dielectric Breakdown Defect Yield | Dynamic Ron Drift Failure Rate (1000 hrs) |
|---|---|---|---|
| Standard PECVD SiNx (100 nm) | 1.00 (Baseline) | 98.5 percent | 8.4 percent |
| Thermal ALD Al2O3 (20 nm) | 1.35 | 96.2 percent | 2.1 percent |
| PE-ALD Al2O3 / HfO2 Nanolaminate | 1.68 | 94.8 percent | 1.1 percent |
| In-situ Plasma Surface Clean + ALD AlN/Al2O3 | 1.85 | 93.5 percent | 0.3 percent |
Wafer yield drops with particle density.
Qualification Files for High Power RF Switch Sourcing
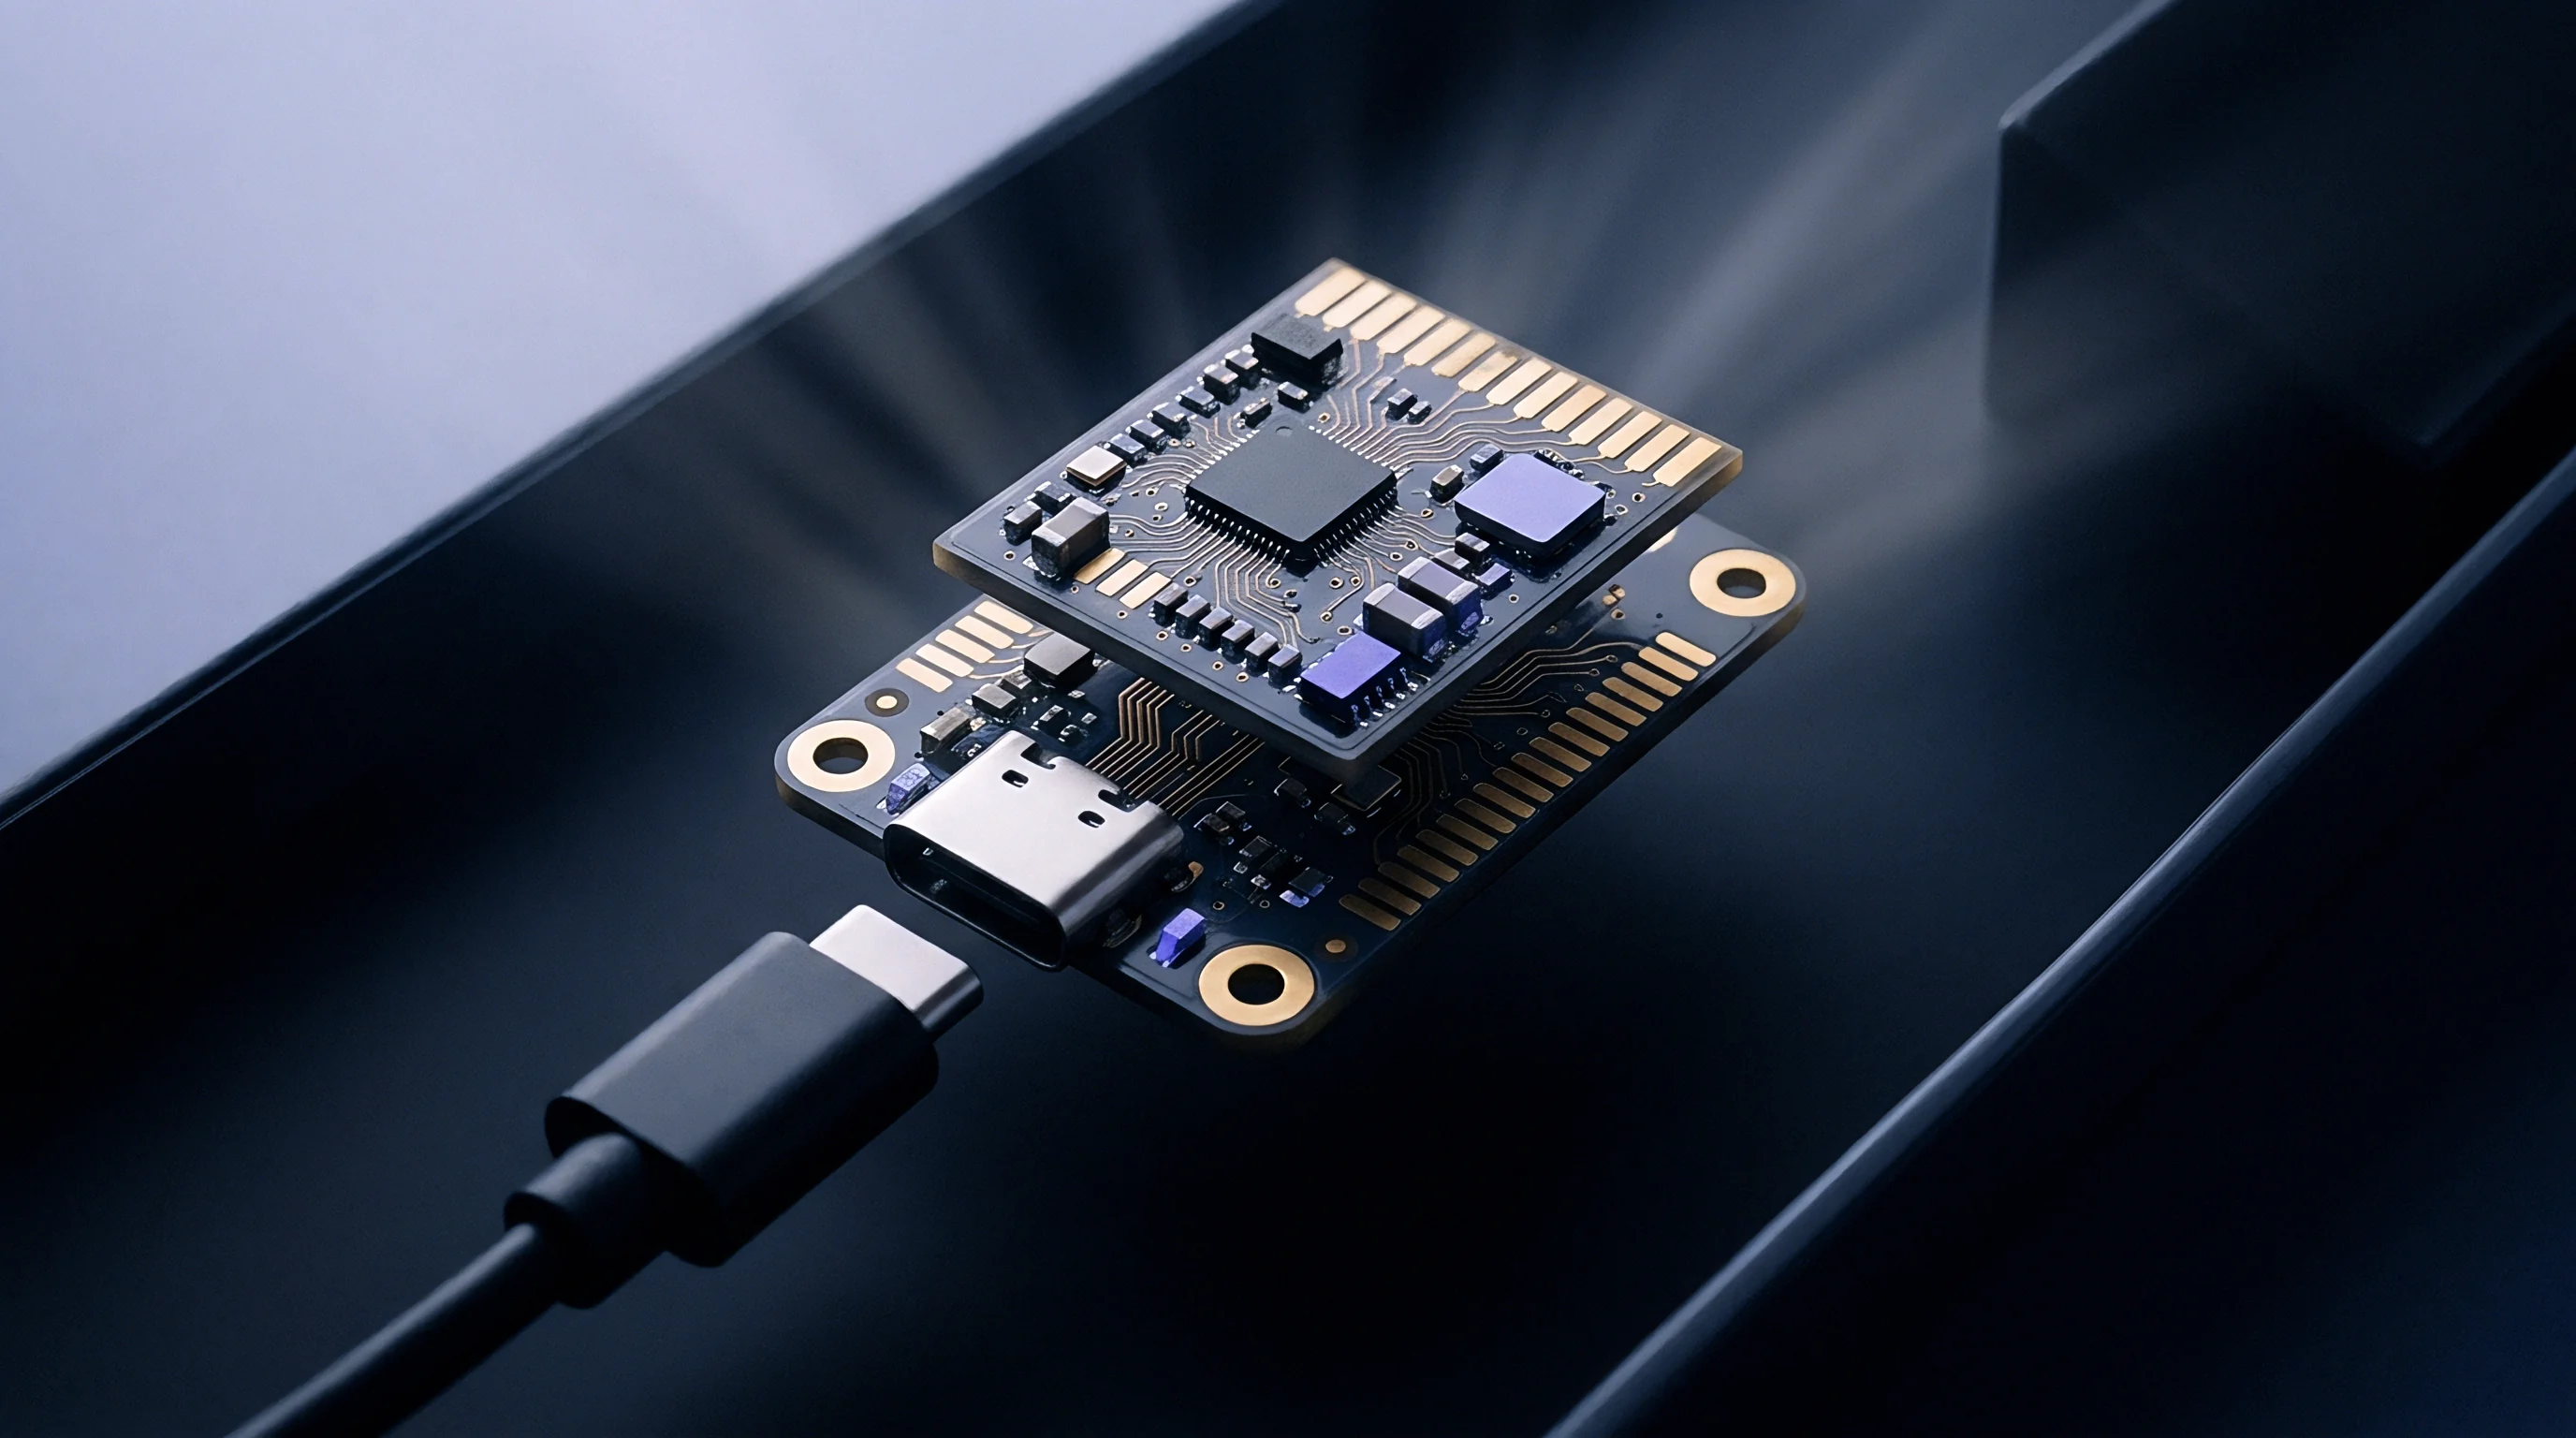
Cross-border sourcing practices require complete qualification dossiers before committing volume production orders for high-power sub-gigahertz radio modules. Qualification files must contain accelerated life test data under high-temperature reverse bias and continuous high-power RF drive according to standard reliability specifications. Standard environmental stress testing includes temperature cycling from minus 65 degrees Celsius to plus 150 degrees Celsius for 1000 cycles, moisture sensitivity testing, and electrostatic discharge immunity testing.
Traceability documentation must link specific wafer deposition batch numbers to precursor chemical lot numbers and chamber maintenance logs. Unexpected shifts in RF performance during field deployment often trace back to unannounced tool modifications, precursor source supplier changes, or thermal process recipe adjustments made by foundry partners attempting to optimize tool throughput.
In accordance with MIL-STD-883 Method 1005 clause 3.2, high-temperature operating life testing demands continuous RF stress for 1000 hours at 125 degrees Celsius ambient temperature, during which dynamic channel resistance growth must not exceed 10 percent of initial baseline values.