Dynamic Power Backoff Algorithms for Simultaneous Cellular and Wi-Fi Portable Exposure Verification
Dynamic power backoff splits cellular and Wi-Fi transmission ceilings through time-averaged exposure ratios, balancing body absorption with link margin.

Sensor
A handheld terminal operating LTE Band 48 alongside 5 GHz Wi-Fi drops RF output within twenty milliseconds of human contact. Capacitive sensor pads laid behind the enclosure dielectric register the change in ground loading, with detection thresholds triggering between two and six picofarads depending on trace geometry and wall thickness. Transceivers throttle output power long before SAR test probes detect elevated field strengths in an automated phantom.
However, capacitive detection responds to both human tissue and inert dielectric slabs with identical capacitance shifts, so a device placed flat on an oak desk can drop transmit levels by six decibels even with no tissue in the reactive near field.
Capacitive touch chips track continuous baselines to account for temperature and humidity swings across the chassis. When moisture collects on the plastic shell, the baseline drifts upward and tricks the power controller into reducing SAR power prematurely, leaving RF front ends attenuated while transmitting into open air. Modern architectures counter this nuisance tripping through dual-threshold hysteresis loops or by cross-referencing antenna impedance mismatch sensors against capacitive readouts.
| Operating State | Trigger Condition | Cellular WWAN Power Action | Wi-Fi WLAN Power Action | Link Margin Delta |
|---|---|---|---|---|
| Free Space Free Run | Sensor delta below 0.8 pF | Full power +23 dBm | Full power +18 dBm | 0 dB nominal baseline |
| Near Proximity Alert | Sensor delta 0.8 to 2.4 pF | Step backoff to +19 dBm | Step backoff to +14 dBm | -4 dB path degradation |
| Body Contact Clamp | Sensor delta above 2.4 pF | TAS clamp to +13 dBm | TAS clamp to +9 dBm | -10 dB link compression |
| Dielectric Table Rest | Mismatch VSWR above 3:1 alone | Holding full power +23 dBm | Holding full power +18 dBm | Mismatched mismatch losses |
Antenna tuners detect directional impedance changes as the radiating structure approaches a hand or torso, shifting the reflection coefficient in phase and magnitude along the Smith chart. When that impedance mismatch aligns with known dielectric profiles for human tissue, power management firmware commits the backoff event, avoiding false clamps on tables or charging docks. The total latency across sensor polling, A-to-D conversion, and SPI bus signaling to the baseband processor takes between eight and twelve milliseconds ~ well inside the one hundred milliseconds that compliance rules treat as instantaneous within regulatory exposure windows.
When dielectric loading triggers proximity sensing without human tissue present, link margin degrades without regulatory cause.
Electrode placement dictates coverage around multi-antenna transceivers. Placing a single capacitive pad between a main cellular antenna and a dual-band Wi-Fi ceramic element leaves the system vulnerable to mechanical torsion on the bezel. Micro-deflections alter the capacitance between the trace and internal chassis frame, triggering uncommanded throttling when a user grips the housing tightly.
Placing discrete capacitive channels directly under each antenna feed resolves this by letting each element throttle independently based on local proximity.
Running a thin sensor trace near an active antenna path degrades radiation efficiency. As the capacitive pad couples with the element, it pulls surface currents and distorts the far-field pattern. Isolating the sensor copper from antenna ground planes requires deliberate RF chokes or ferrite bead rings on supply lines.
A clean sensor layout maintains RF performance while preserving tight physical coupling to the exterior plastic housing where contact occurs.
Proximity sensing relies on baseline calibration established at boot before hands touch the casing.

Budget
Simultaneous transmission SAR compliance requires the Total Exposure Ratio to stay strictly below unity across all operating configurations. Cellular transmitters operating below 3 GHz evaluate exposure over a rolling sixty-second or one-hundred-second window, whereas Wi-Fi at 5 GHz and 6 GHz integrates over shorter mandatory timeframes. Because total exposure is the direct sum of individual SAR values divided by their statutory limits, concurrent cellular and Wi-Fi transmissions prevent either radio from running continuously at maximum rated power without breaching the ceiling.
| Band Combination | Standalone WWAN SAR | Standalone WLAN SAR | Summed SAR Peak | Calculated TER | Required Backoff Split |
|---|---|---|---|---|---|
| LTE B7 + Wi-Fi 2.4 GHz | 1.18 W/kg at +23 dBm | 0.82 W/kg at +19 dBm | 2.00 W/kg | 1.25 | -1.8 dB WWAN / -1.5 dB WLAN |
| NR n77 + Wi-Fi 5.8 GHz | 1.35 W/kg at +24 dBm | 0.95 W/kg at +16 dBm | 2.30 W/kg | 1.44 | -2.5 dB WWAN / -2.0 dB WLAN |
| NR n41 + Wi-Fi 6 GHz | 0.92 W/kg at +21 dBm | 1.12 W/kg at +14 dBm | 2.04 W/kg | 1.28 | -1.2 dB WWAN / -2.2 dB WLAN |
| LTE B20 + Wi-Fi 2.4 GHz | 0.74 W/kg at +23 dBm | 0.71 W/kg at +18 dBm | 1.45 W/kg | 0.91 | 0 dB WWAN / 0 dB WLAN |
Forced power reductions directly impair link budgets. Cutting transmit power by 3 dB halves the link margin, weakening connection reliability at cell edges and dropping uplink data rates on complex schemes like 64-QAM or 256-QAM. A cellular modem frequently needs maximum power to reach a tower three kilometers away, whereas the Wi-Fi link communicates across a single room.
Throttling cellular output before Wi-Fi power preserves high-throughput local links at the expense of wide-area reach.

Where Do Simultaneous Exposure Ratios Collide?
Overlapping near-field energy zones create localized absorption hot spots in tissue models. When cellular and Wi-Fi antennas sit less than twenty millimeters apart, their peak SAR distributions merge into a contiguous volume. Standard compliance testing applies peak-location SAR summation whenever separation drops below statutory thresholds, forcing steeper power roll-backs than layouts where radiators sit on opposite edges of the board.
Spatial separation between antennas exceeding thirty millimeters prevents hot-spot aggregation and avoids compounding backoff penalties during concurrent transmissions.
Firmware power-sharing algorithms allocate exposure based on active traffic priorities. Voice calls typically claim eighty percent of the exposure threshold for the cellular modem, leaving twenty percent for Wi-Fi. When heavy data transfers start over Wi-Fi, firmware dynamically shifts that allocation if cellular link quality allows a lower uplink transmit power. Negotiating these trade-offs between separate baseband processors requires a low-latency communication bus between WWAN and WLAN modules.
- Static Power Partitioning splits exposure budgets into fixed percentages regardless of channel conditions, causing premature link drops when either link encounters heavy path attenuation.
- Time Averaged Exposure Tracking accumulates energy expenditure across moving temporal windows, permitting transient high-power transmission bursts before applying backoff throttles.
- Priority Arbitration Throttling depresses Wi-Fi packet airtime when the cellular radio approaches terminal link budget margins during voice calls or urgent uplink retransmissions.
- Spatial Vector Splitting leverages physical antenna isolation to treat cellular and Wi-Fi exposure domains as separate non-overlapping absorption volumes under localized SAR testing regimes.
Without physical antenna separation, field overlap forces aggressive power throttling. A combined SAR figure of 2.3 W/kg across unseparated LTE and Wi-Fi feeds requires immediate backoff of several decibels to meet the 1.6 W/kg FCC limit, with firmware updating baseband registers dynamically based on active carrier aggregation states.
Skipping spatial SAR overlap testing during early chassis layout forces teams to apply blanket five-decibel backoff ceilings across all radios, permanently degrading coverage at network edges.
Clamp
Time-Averaged SAR algorithms integrate RF power delivery over standardized intervals ~ one hundred seconds for frequencies below 3 GHz and sixty seconds between 3 GHz and 6 GHz. Rather than clamping power to a static floor the moment proximity is detected, the controller tracks cumulative energy over the moving window. A mobile terminal can transmit at maximum power for twenty seconds to flush a data buffer, provided it throttles back for the remaining eighty seconds of the rolling window.
The energy clamp operates as a leaky bucket algorithm within the baseband firmware loop. Every transmitted subframe adds an energy increment proportional to radiated power and slot duration. If that bucket fills to ninety-five percent capacity, the baseband modem issues an immediate power step-down over the MIPI RFFE bus to the power amplifier, which drops its collector bias or gain setting within hundreds of microseconds.
| Algorithm Metric | Smart Transmit Gen 2 | Time Average SAR TAS | Static Power Table Backoff |
|---|---|---|---|
| Averaging Window Span | 100s WWAN / 60s WLAN | 100s WWAN / 60s WLAN | 0s instantaneous clamp |
| Power Step Resolution | 0.25 dB via MIPI RFFE | 0.50 dB register control | Discrete state table jumps |
| Cross-Radio Negotiation | Real-time serialized link | GPIO hardware line strobes | Unsynchronized parallel tables |
| Burst Transmit Capability | Up to +26 dBm for 10 seconds | Up to +24 dBm for 12 seconds | Fixed ceiling at +14 dBm |
| Firmware Memory Footprint | 450 kB runtime overhead | 320 kB runtime overhead | 12 kB look-up storage |
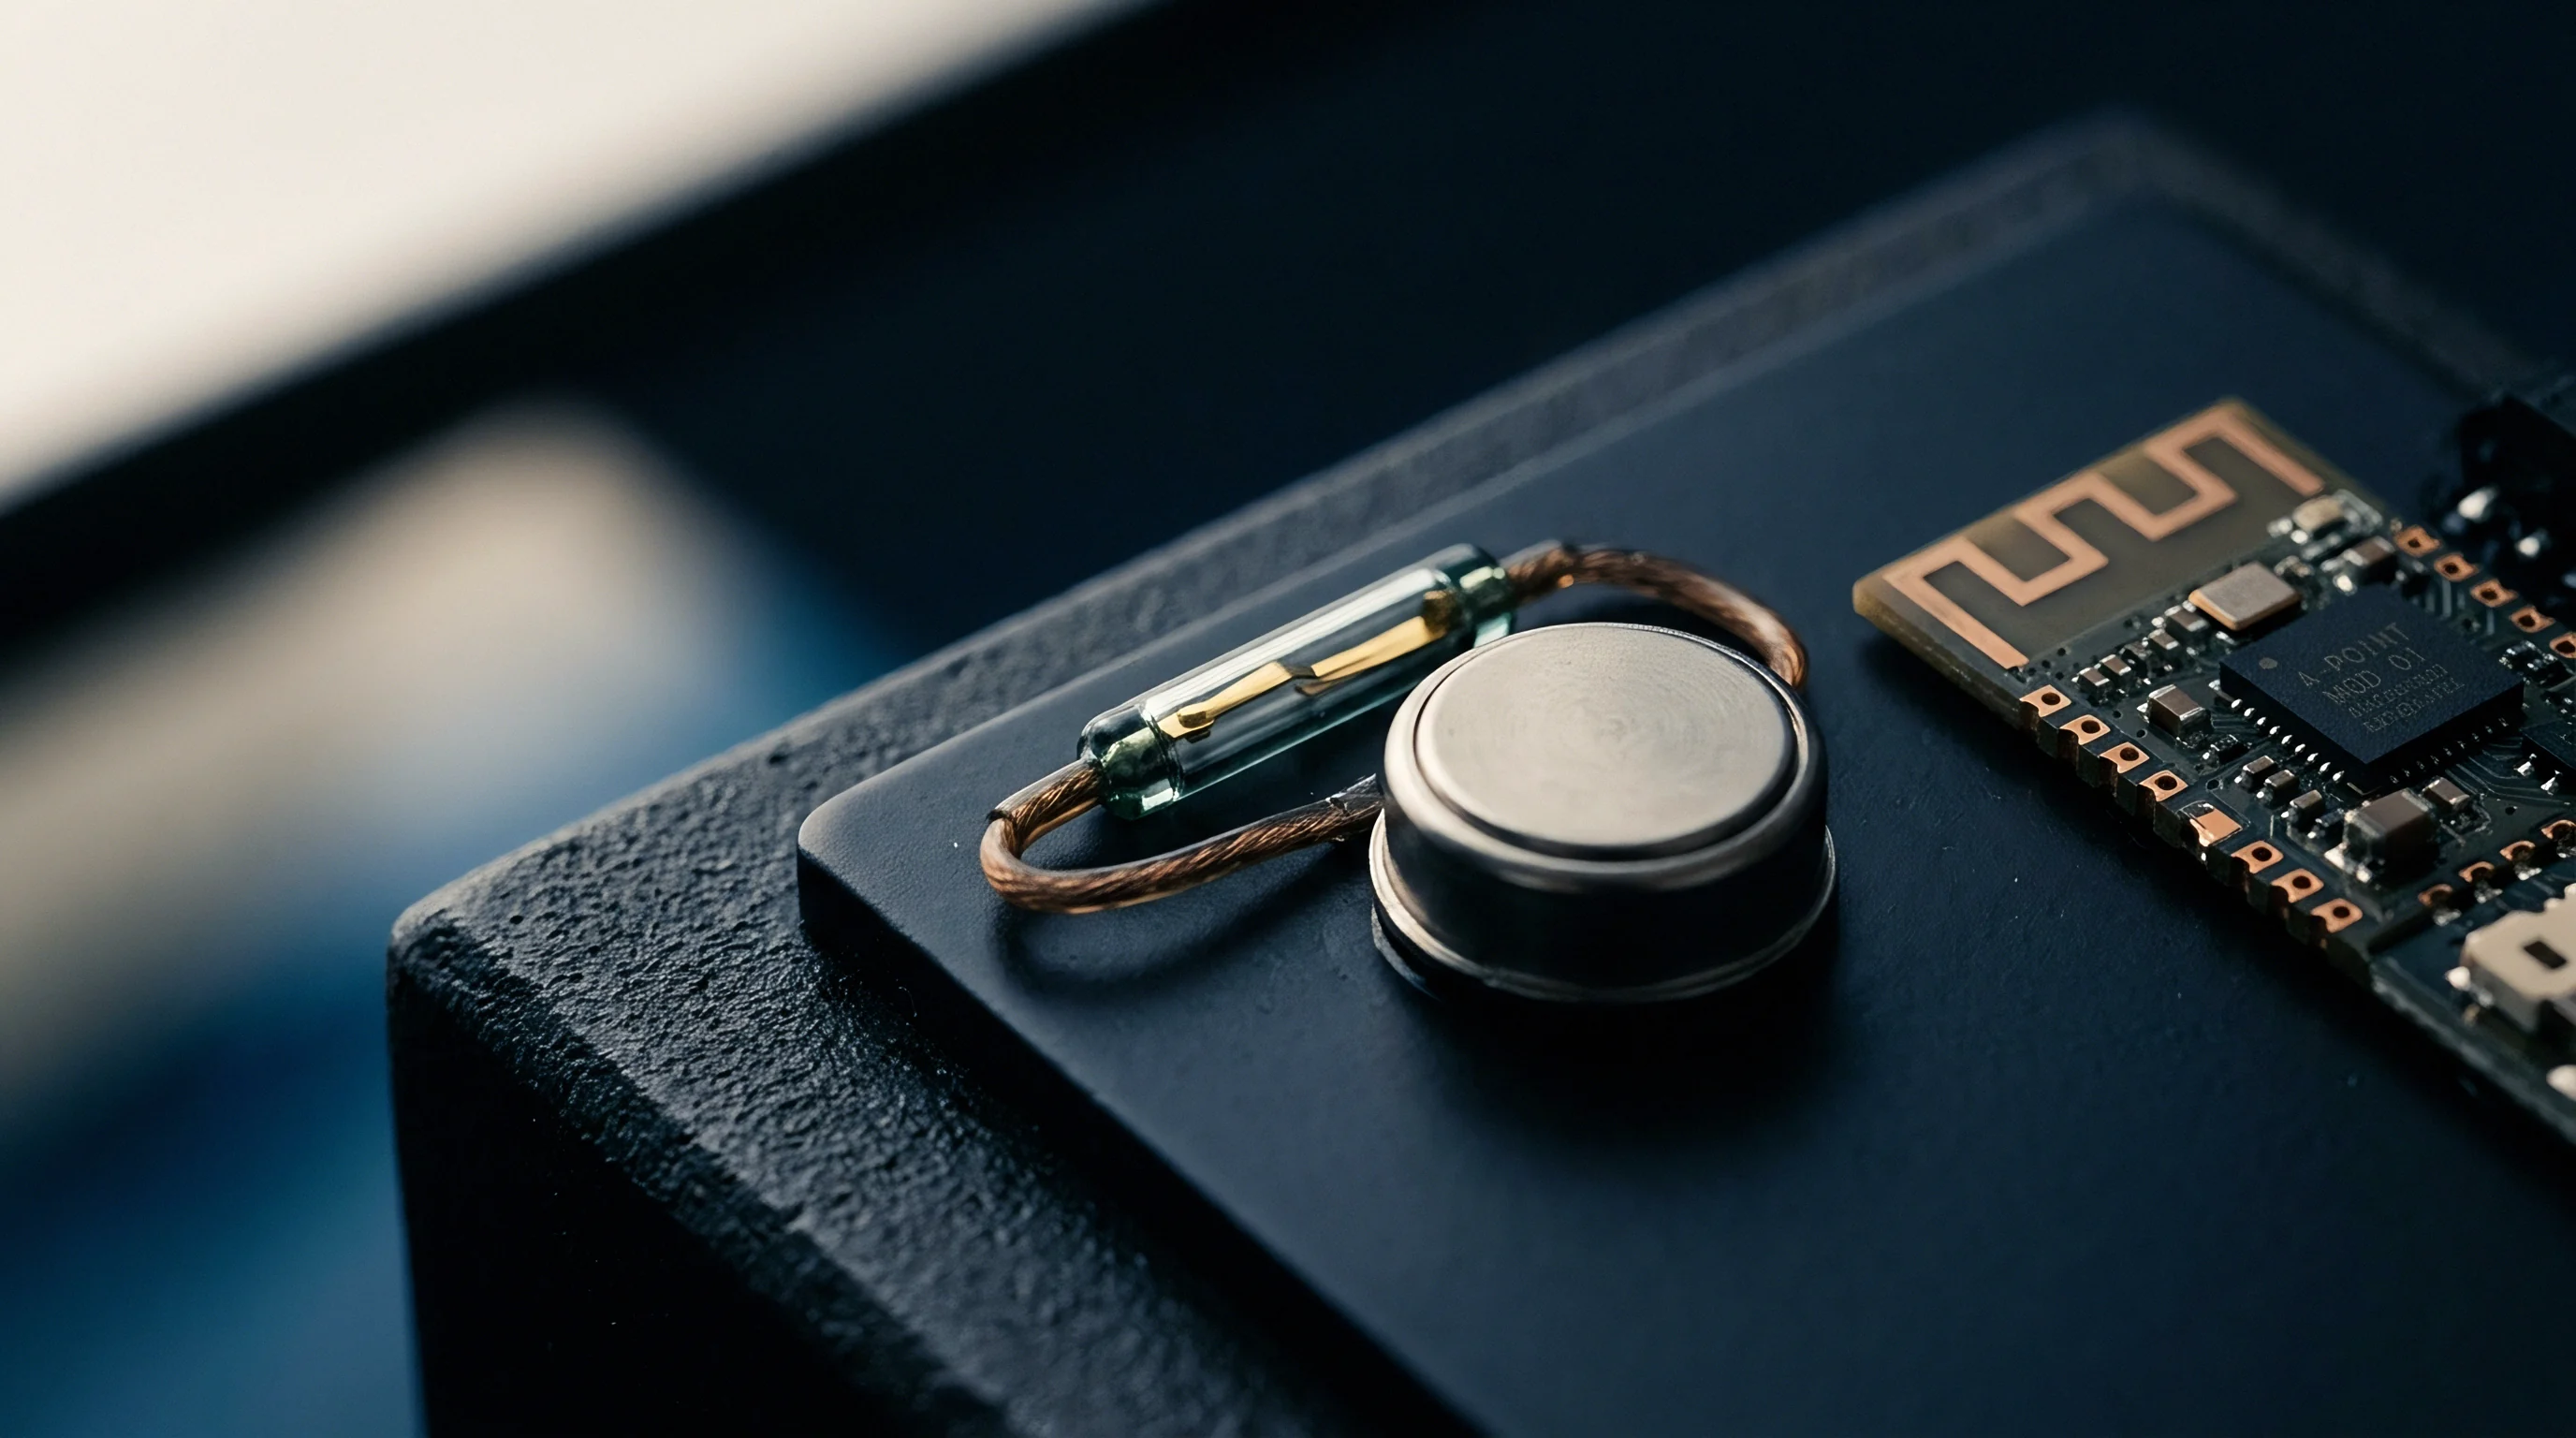
Why Do Capacitive Proximity Sensors Drift?
Temperature swings shift the dielectric permittivity of plastic enclosures and the parasitic capacitance of internal flex cables. Under heavy processing loads, internal board temperatures can rise from twenty-five to sixty degrees Celsius within three minutes. Sensor analog front-ends read this thermal shift as body proximity, clamping output power even when the device rests isolated in free space.
To prevent these false triggers, algorithms cross-check capacitive sensor trends against thermistors placed right next to the sensor copper traces.
Baseband firmware tracks rolling milliwatt-second expenditure across moving time windows, allowing short-range high-power bursts before clamping output power to statutory limits.
Coordinating cellular Time Division Duplexing with Wi-Fi orthogonal frequency-division multiple access introduces tight timing demands. When a 5G NR uplink burst coincides with an 802.11ax frame transmission, aggregate instantaneous power spikes. Directional couplers feed these power levels back to the central TAS engine; if the combined envelope exceeds peak hardware limits, the clamp mechanism selectively drops Wi-Fi contention windows or suppresses cellular sounding reference signals.
- The capacitive proximity sensor registers a capacitance delta exceeding the configured 2.0 picofarad trigger point.
- The sensor controller asserts an interrupt line to the application processor and the cellular baseband management core.
- The TAS arbitration engine calculates remaining energy reserves within the current one-hundred-second regulatory exposure ledger.
- The processor issues MIPI RFFE commands to the radio front-end power amplifiers, lowering target output power by the required decibel increment.
- The Wi-Fi subsystem receives a power throttling command over the PCIe or high-speed UART interface to equalize exposure contribution.
- The baseband continually recalculates moving time window integrals, releasing power ceilings when the proximity interrupt clears.
When the backoff algorithm clamps radio power at cell edges or during poor propagation, the terminal undergoes steep modulation downshifts. Cellular modems drop from 64-QAM to QPSK, expanding the airtime required to flush transmission buffers. This extended airtime drains batteries faster and keeps the transmitter active longer, undercutting the efficiency gains of burst transmission.
Balancing peak power against transmit duration remains the core trade-off in algorithmic exposure control.
Internal software tables can handle exposure protection autonomously, rendering external radio frequency sensing loops redundant during end-product integration.

Probe
Compliance laboratories verify time-averaged SAR performance using robotic probe systems paired with high-speed call boxes. Validation relies on a liquid-filled anthropomorphic phantom that mimics human tissue electrical characteristics across target frequency bands. A miniature electric field probe scans inside the phantom while the device under test executes dynamic power transitions driven by the call box, tracking spatial peak SAR values at each step.
Simulating dynamic simultaneous transmission requires real-time closed-loop monitoring across all active transmitters. The call box steps cellular power from minimum to maximum in predefined sequences while an access point emulator streams continuous Wi-Fi traffic over UDP or TCP sockets. Directional couplers tapped into the RF paths sample conducted power into high-speed power meters, generating synchronized power traces that correlate directly with robotic probe sweeps inside the phantom.
| Uncertainty Component | Probability Distribution | Divisor | Standard Uncertainty (dB) | Weighting Factor |
|---|---|---|---|---|
| Probe Calibration Drift | Normal distribution | 1.0 | 0.28 dB | 1.0 |
| Tissue Liquid Permittivity | Rectangular distribution | 1.732 | 0.22 dB | 0.6 |
| Robotic Positioning Error | Rectangular distribution | 1.732 | 0.08 dB | 1.0 |
| Power Measurement Sensor | Normal distribution | 2.0 | 0.12 dB | 1.0 |
| Post-Processing Extrapolation | Rectangular distribution | 1.732 | 0.15 dB | 1.0 |
| Combined expanded uncertainty calculated at 95 percent confidence interval with coverage factor k=2 equals 0.84 dB across sub-6 GHz validation bands. | ||||
Fast probe systems using stationary sensor arrays eliminate the mechanical scanning delays of single-probe robots. Vector arrays capture the full three-dimensional field distribution in milliseconds, recording transient power shifts during sensor triggering. The measurement engine reconstructs the instantaneous SAR pattern, applies the time-averaging filter, and plots the Total Exposure Ratio curve in real time ~ triggering a compliance failure if TER crosses 1.0 at any point.
Fast multi-probe array systems capture dynamic power transitions within milliseconds, verifying that the integrated Total Exposure Ratio never crosses the 1.0 limit.
Validation mandates testing multiple transition states, including drop-off sequences where proximity triggers sudden attenuation and recovery phases where power returns to maximum. In a standard test scenario, cellular power drops by 6 dB while Wi-Fi holds steady, followed ten seconds later by a complete drop in Wi-Fi transmission. The algorithm must step cellular power upward to reclaim exposure budget without exceeding the aggregate one-hundred-second rolling limit, while call boxes log conducted power and probes record absorption.
Uncertainty in liquid electrical properties directly affects test repeatability. The dielectric constant and conductivity of tissue-equivalent liquid shift as water and solvent components evaporate over long test runs. Daily liquid calibration with an open-ended coaxial probe keeps parameters within a five percent tolerance window.
If conductivity drifts high, measured SAR values artificially inflate, forcing engineering teams to add unnecessary backoff margin to firmware tables and permanently sacrificing operating range.
Clause 7.2 of IEC/IEEE 62209-1528 specifies that total expanded measurement uncertainty for simultaneous transmission assessment cannot exceed thirty percent, invalidating test dossiers that fail to account for power sensor time-alignment errors.

Trade
Module selection dictates the complexity and expense of dynamic exposure verification. Integrated modules packaging the cellular baseband, RF front end, and Wi-Fi transceivers on a single substrate include factory-validated TAS algorithms out of the box. Sourcing discrete cellular and Wi-Fi chipsets from separate vendors shifts that burden to the system integrator, who must write custom power arbitration daemons, calibrate shared look-up tables, and take full liability for compliance before certification bodies.
Carrier acceptance programs enforce strict over-the-air performance floors alongside regulatory absorption ceilings. Cellular operators require specific Total Radiated Power and Total Isotropic Sensitivity metrics across all supported channels. When dynamic backoff algorithms clamp power to satisfy SAR limits during body contact, radiated performance frequently falls below carrier TRP minimums.
As a result, a device fully certified for regulatory SAR can still fail carrier readiness audits and stall commercial deployment.
- Integrated Dual Radio Modules carry higher initial bill-of-materials costs of twelve to eighteen dollars per unit, but reduce regulatory lab verification expenses by forty percent through pre-certified TAS firmware.
- Discrete Sourced Architectures reduce silicon procurement costs by three to five dollars per board, yet demand four to six months of custom firmware engineering to validate dual-radio exposure arbitration.
- Firmware Lock-In Penalties occur when proprietary backoff algorithms prevent substitution of secondary cellular or Wi-Fi module vendors without repeating entire regulatory test filings.
- Carrier Acceptance Failure arises when backoff attenuation levels push conducted power below minimum network reception thresholds, triggering dropped calls during human handling audits.
Antenna detuning during handling creates ongoing challenges for RF design teams. Ground planes inside compact enclosures couple tightly with lithium batteries and metal frame stiffeners. When a user grasps the device, hand capacitance detunes internal inverted-F antennas by fifty to two hundred megahertz.
Power amplifiers then draw additional battery current fighting high standing-wave ratios, generating chassis heat while radiated field strength plummets.
Sourcing teams must check whether datasheet output figures reflect peak saturation power or exposure-compliant sustained power. Vendors frequently market cellular outputs of +23 dBm and Wi-Fi outputs of +20 dBm without noting that simultaneous operation in handheld configurations requires permanent throttling to +15 dBm and +12 dBm. Product architectures must retain enough link margin to absorb these regulatory power drops without dropping active sessions.
Sourcing decisions balance upfront component costs against testing and verification expenses. A thorough engineering evaluation looks beyond raw module unit pricing to weigh the full compliance burden ~ including multi-radio dynamic power management firmware, sensor calibration pipelines, and carrier test regimes.
Whether future regulatory revisions will permit millimeter-wave spatial power density calculations to dynamically interoperate with sub-6 GHz SAR averaging models remains open as architectures evolve.