Standard Operating Procedures for Automated RF Parameter Validation Bench Testing
Automated RF parameter validation bench testing requires exact S-parameter de-embedding, continuous guardbanding, and rigorous SCPI execution protocols.

Rack
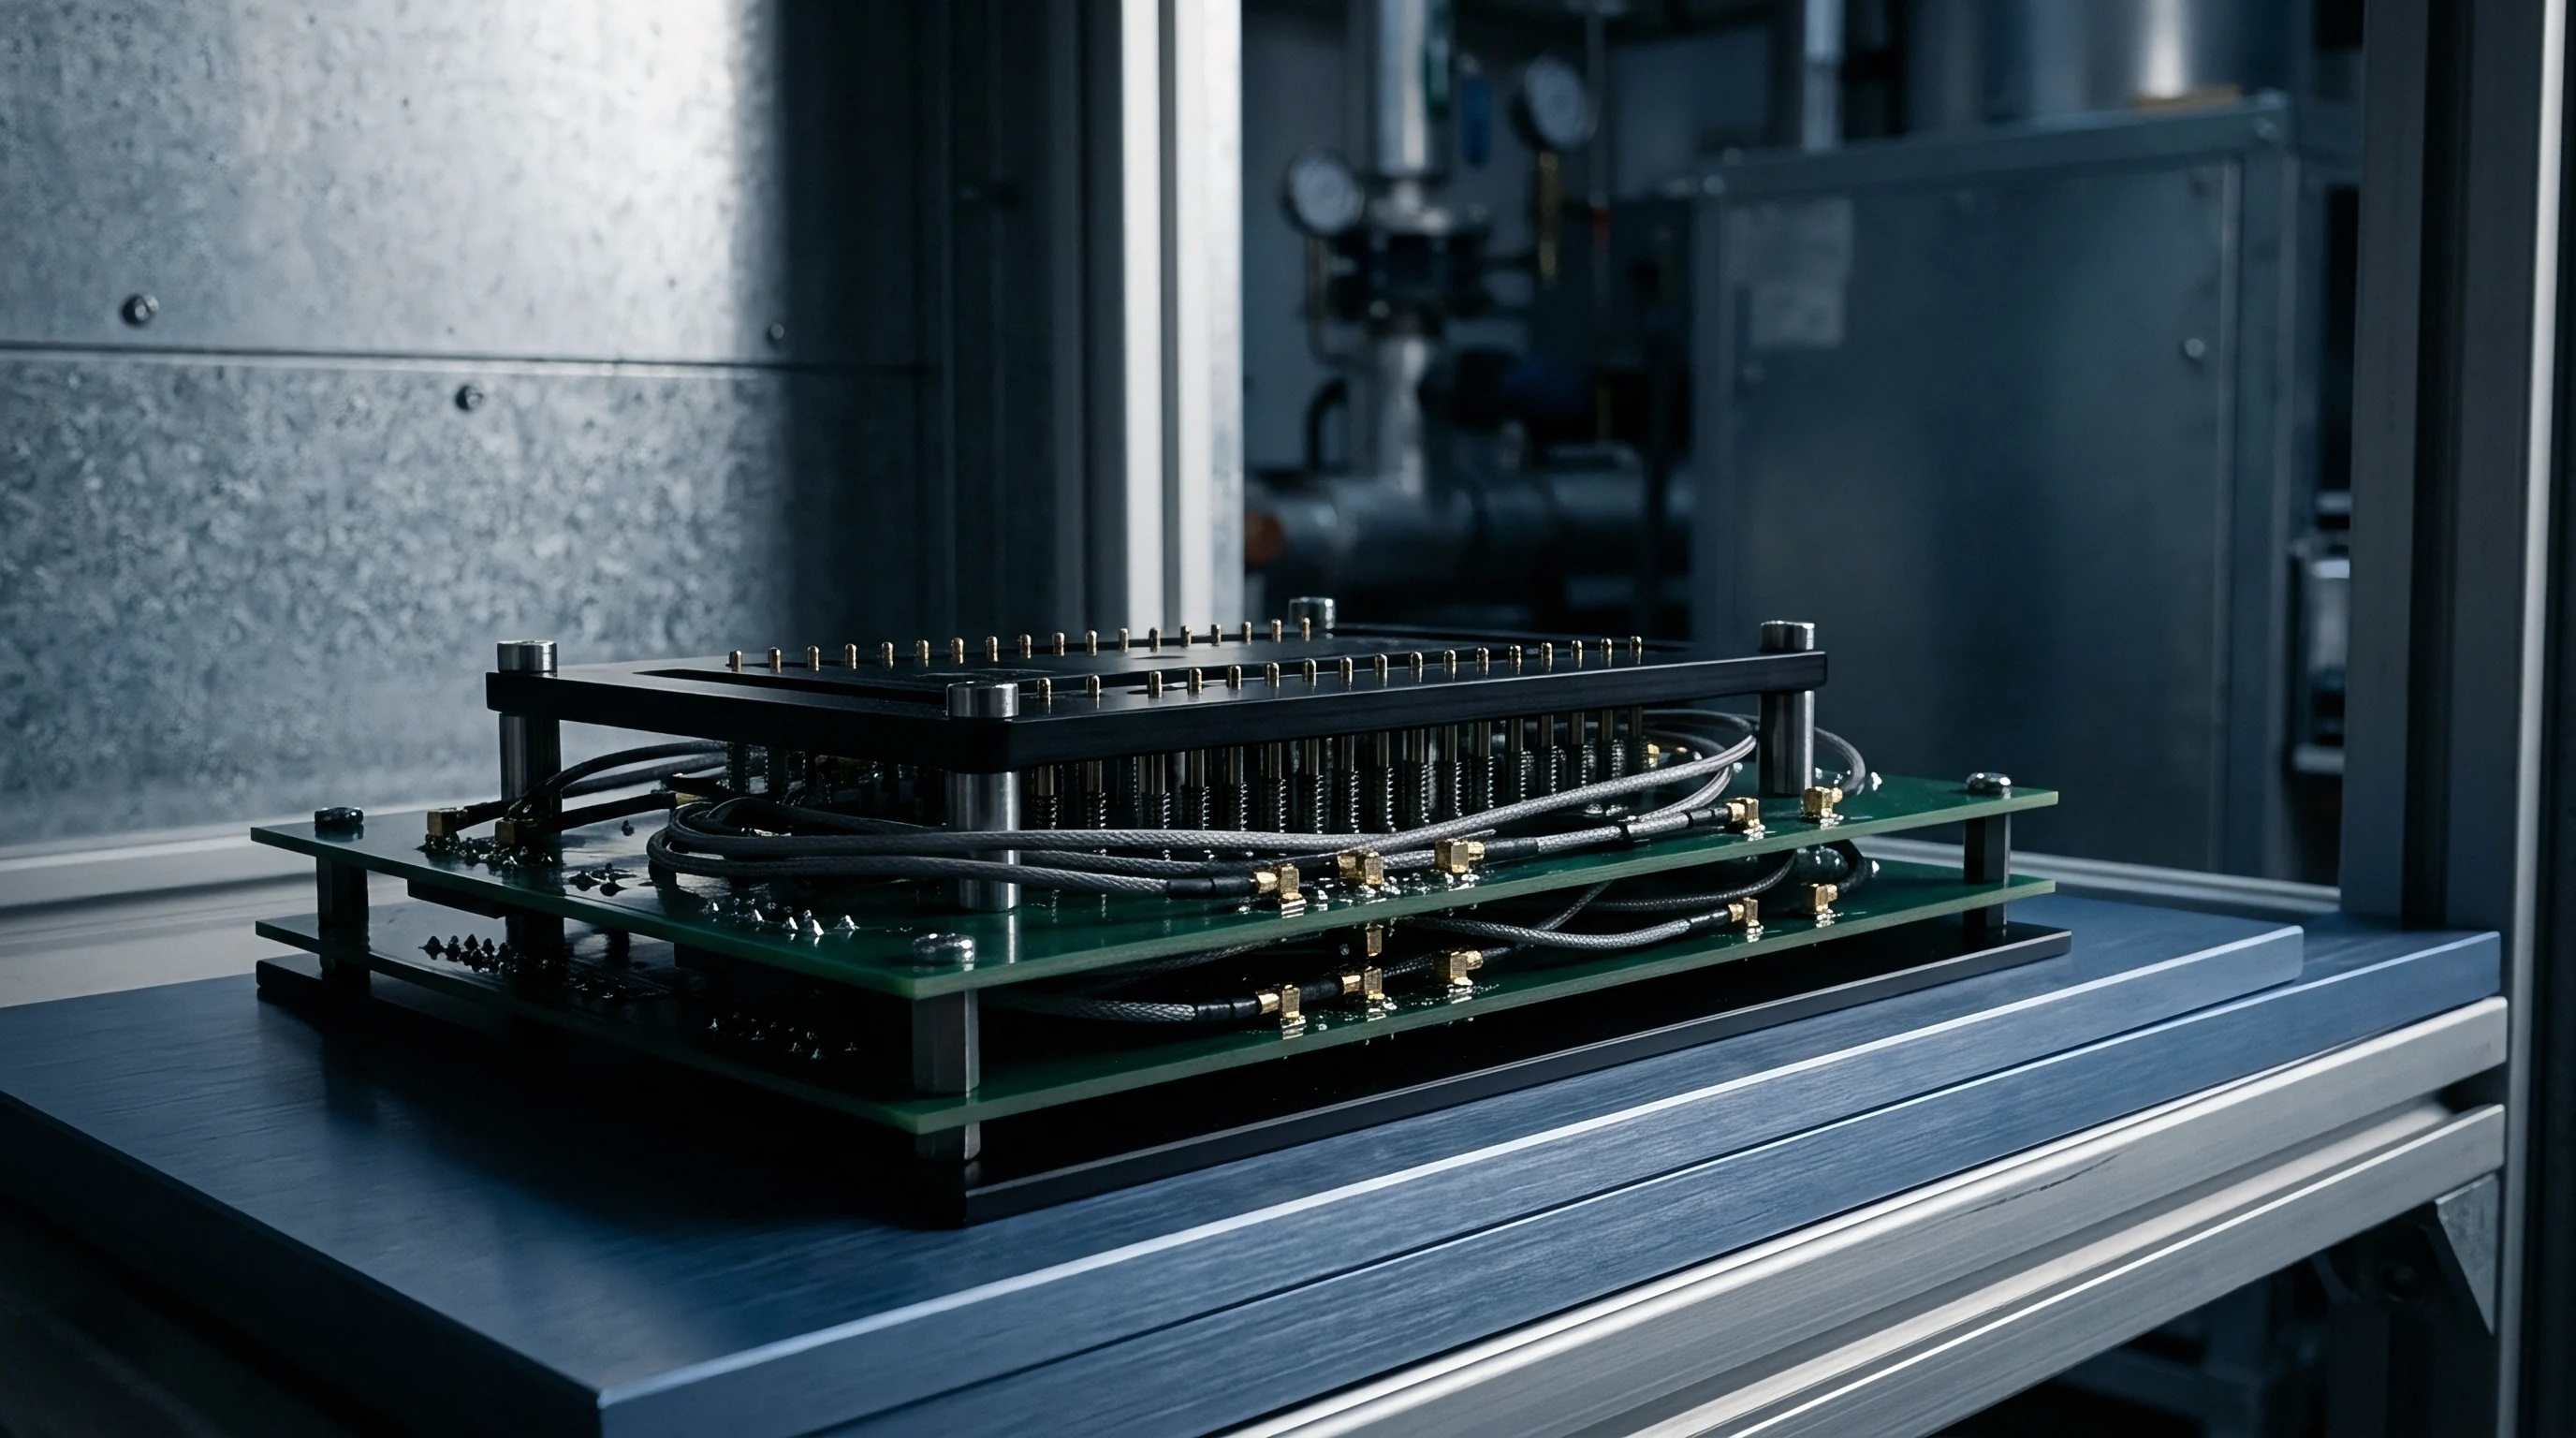
Automated radio frequency validation stations require a rigid mechanical layout and clean signal paths before software orchestration ever starts. High-frequency signals degrade across switch networks, coaxial interfaces, and directional couplers, so physical hardware setup determines test validity. An RF validation bench typically packs programmable power supplies, multi-channel vector signal generators, spectrum analyzers, vector network analyzers, digital multimeters, and RF switching matrices inside a shielded enclosure.
Automation reliability comes down to suppressing stray radiated energy and accounting for every fraction of a decibel lost between the device under test and the measurement reference plane.
Signal routing within these automated systems relies on precision coaxial cabling, usually phase-stable semi-rigid or high-flex assemblies rated to at least 18 GHz. Any cable loss directly distorts the raw measurement. Connector choice determines calibration repeatability, with SMA or precision 3.5 mm interfaces specified for sub-6 GHz rigs.
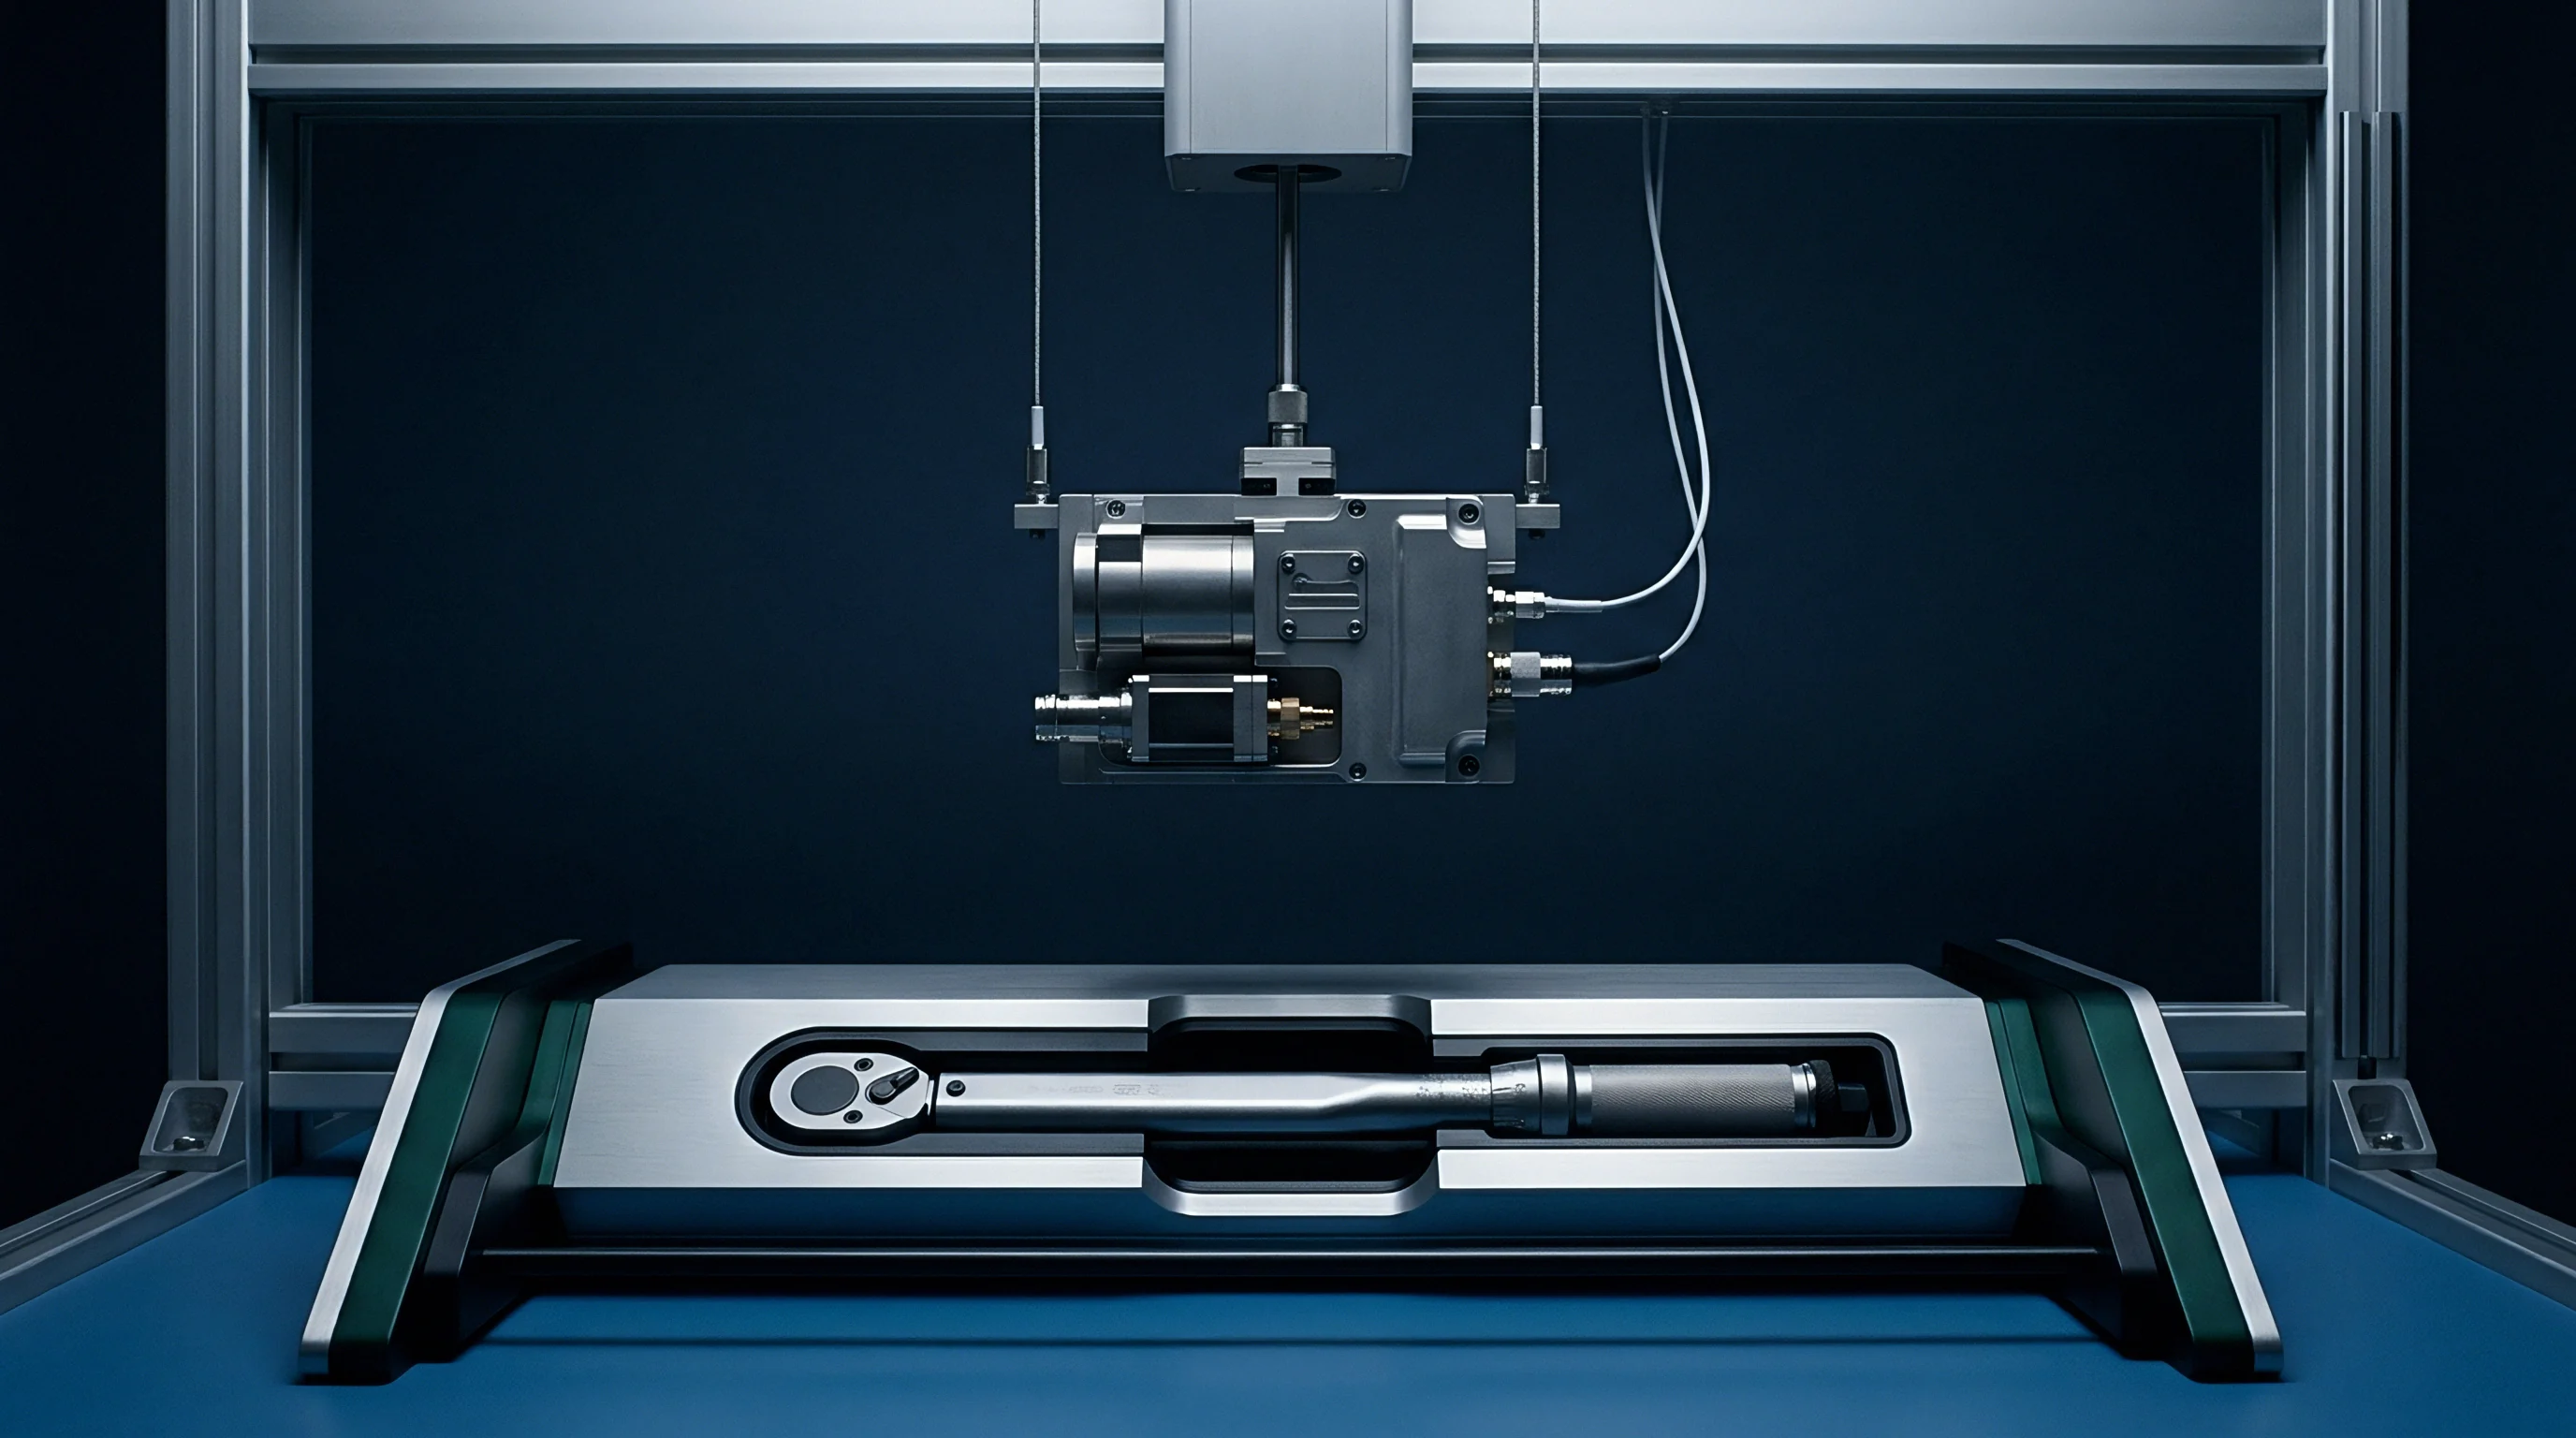
Torque wrenches calibrated to 0.9 Nm prevent loose or over-tightened connections, either of which introduces impedance mismatches, return loss spikes, and erratic standing waves. For high-speed test sequencing, solid-state RF switches with high isolation are preferred over electromechanical relays ~ they eliminate mechanical wear and switch in under a millisecond across complex port routes.
Instrumentation Architecture and Signal Routing
Integrating automated test hardware starts with clean power networks and isolated signal lines. Test sequences command vector signal generators to emit precise modulation schemes, from Gaussian Frequency Shift Keying (GFSK) for Bluetooth Low Energy to High Efficiency Quadrature Amplitude Modulation (HE-QAM) for IEEE 802.11ax hardware. Meanwhile, signal analyzers capture the transmitted bursts to measure power, frequency error, and spectral emissions.
The instrument stack communicates via Virtual Instrument Software Architecture (VISA) over Gigabit Ethernet (LXI) or GPIB buses, controlled by a central host running automation scripts.
Automated switching matrices direct RF output from the module under test to various instruments. Solid-state switches usually introduce 1.5 dB to 4.0 dB of insertion loss at 2.4 GHz, with channel-to-channel isolation above 80 dB. High isolation keeps signal from an active generator channel from leaking into a sensitive receiver during simultaneous duplex testing.
To cut reflection errors, placing fixed 3 dB or 6 dB attenuators directly at the fixture ports improves the Voltage Standing Wave Ratio (VSWR) seen by the switching network, dampening double-bounce reflections caused by impedance jumps at the device interface.
Fixed precision attenuators installed directly at fixture interface ports suppress standing waves caused by load mismatches.
Managing dynamic range across the measurement path protects delicate instruments while maintaining high signal-to-noise ratios. Running a direct line from a 30 dBm transmitter into a sensitive spectrum analyzer mixer can easily blow out the mixer or drive it into heavy gain compression. Automated attenuator banks, controlled through VISA commands, step in up to 70 dB of attenuation in 1 dB increments to match signal levels to analyzer inputs.
For power, differential DC wiring with remote-sensing leads cancels out voltage drops across long cables, holding supply lines within 1 mV during heavy transmitter pulses.

Fixture Calibration and S-Parameter De-Embedding
Uncompensated path losses cause both false rejections and bad passes. Path loss calibration measures and saves insertion loss matrices across the full operating frequency range. Standard procedure requires a two-port Vector Network Analyzer (VNA) to run a Full Two-Port Short-Open-Load-Thru (SOLT) calibration right up to the interface touching the device under test.
S-parameter Touchstone files (.s2p) saved during this process map the amplitude attenuation and phase shift for every path combination in the switch matrix.
Automation software imports these Touchstone files to de-embed the path in real time. De-embedding mathematically strips out the complex S-parameters of cabling, switches, and PCB launch structures from raw analyzer readings. The resulting de-embedded power figure shows the true signal level right at the target module’s RF pin or micro-coaxial connector.
Test rigs undergo recalibration every 72 hours ~ or instantly if any physical connection in the high-frequency path is broken ~ to catch cable wear and thermal drift.
| Frequency Band (MHz) | Interface Component | Nominal Path Loss (dB) | Max Return Loss S11 (dB) | Calibrated Path Loss Uncertainty (dB) |
|---|---|---|---|---|
| 863 – 870 | Semi-Rigid Coax + Matrix Switch | 1.85 | -22.1 | ± 0.08 |
| 902 – 928 | Semi-Rigid Coax + Matrix Switch | 1.92 | -21.8 | ± 0.09 |
| 2400 – 2483.5 | Flex Cable + Attenuator + Switch | 4.45 | -19.5 | ± 0.12 |
| 5150 – 5850 | Low-Loss Coax + Attenuator + Switch | 7.30 | -16.2 | ± 0.18 |
Thermal stability directly dictates how long a calibration holds. RF coax expands and contracts with room temperature swings, shifting both phase and insertion loss. Keeping bench enclosures inside a thermal envelope of 23°C ± 2°C keeps insertion loss drift below 0.03 dB per day.
Before starting test runs, software validation routines check reference sources against stored baselines, alerting operators automatically if reference power drifts past threshold limits.

Shield Box Isolation and Electromagnetic Decoupling
Radiated bench testing requires heavy shielding against background wireless noise like cell towers, Wi-Fi networks, and broadcast signals. Pneumatic or manual shield boxes made of aluminum or cast zinc deliver over 90 dB of shielding effectiveness from 700 MHz to 6 GHz. Every power, control, and data line entering the box goes through filtered feedthrough bulkheads.
Filtered Sub-D, USB, and Ethernet bulkheads use capacitors and ferrite suppressors to stop high-frequency noise from riding external cable shields into the test cavity.
Reflections inside a small shield box generate standing waves that spoil radiated measurements. Lining the interior walls with carbon-loaded pyramidal or flat microwave absorber foam suppresses these reflections, creating near-anechoic conditions in a tight space. Absorber selection depends on the target band; 50 mm thick pyramidal foam, for instance, provides over 20 dB of absorption across sub-6 GHz frequencies.
Antenna mounting inside the box must be perfectly repeatable, using custom 3D-printed PEEK or Delrin fixtures to avoid placing metal near the antenna under test.
- Connector Mechanical Decompression Over-tightening SMA interfaces deforms internal pins, increasing return loss and ruining calibration stability.
- Cable Minimum Bend Radius Exceedance Bending flexible RF cables past vendor limits damages the outer braid shielding, causing phase shifts during automated fixture movement.
- Bulkhead Filter Saturation Exceeding DC current limits on filtered feedthroughs saturates internal inductors, creating noise and dropouts on data lines.
- Absorber Thermal Degradation Exposing carbon absorber foam to intense heat from high-power transmitters degrades its RF attenuation over time.
- Uncalibrated Matrix Paths Routing RF signals through uncalibrated switch channels adds unknown path loss errors to transmit power calculations.
Automated test stands have to manage interface wear. Standard SMA connectors are rated for only 500 to 1,000 mating cycles before mechanical wear degrades return loss. To protect expensive hardware, test setups use connector savers ~ sacrificial precision adapters installed on instrument ports and fixture interfaces.
Swapping a worn adapter takes minutes and costs very little, saving main instrument ports and matrix switches from permanent damage.
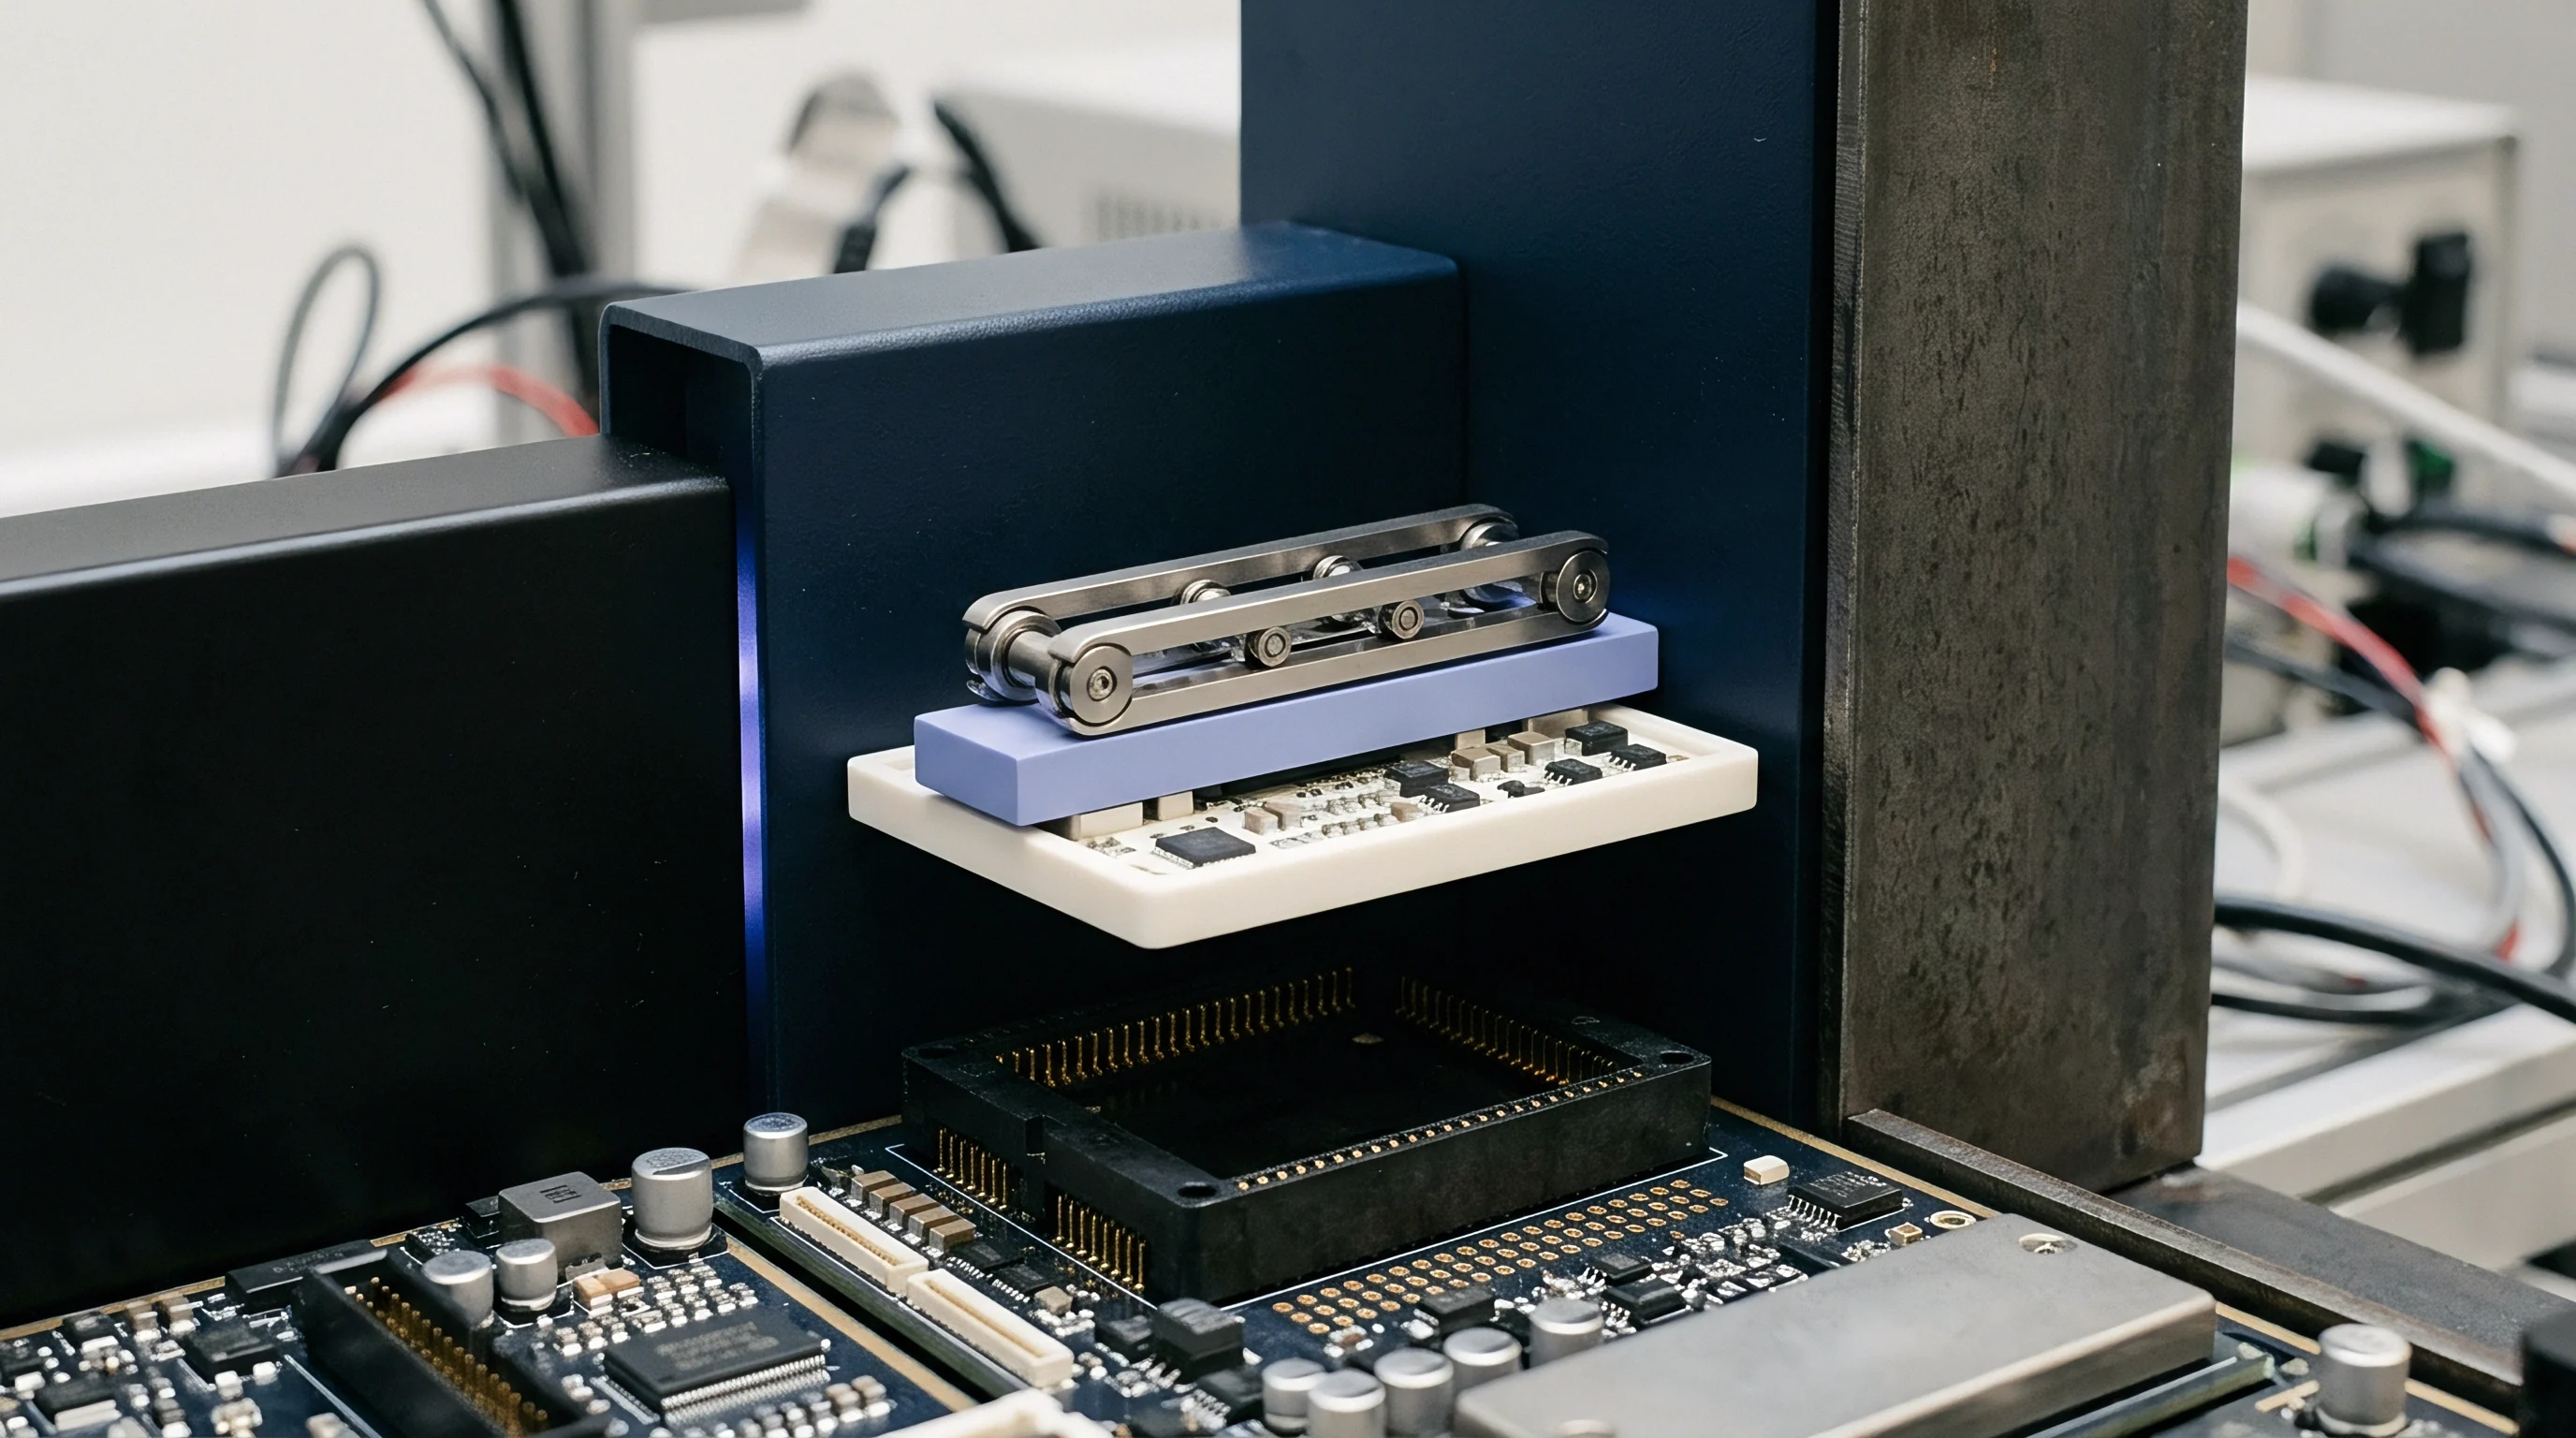
Pneumatic controllers handle fixture actuation, pressing modules smoothly onto pogo-pin beds for DC power and control lines. Setting air pressure regulators to 0.4 MPa avoids warping thin PCB substrates while keeping contact resistance below 30 mΩ across all pins. Ground pins surround high-speed digital lines to suppress ground bounce during intense packet bursts.
Shield box door gaskets need regular cleaning with isopropyl alcohol to remove oxidation and grit that degrade shielding over time.
Data cables inside the shield box need double-shielded twisted-pair construction to block noise from onboard microcontrollers. USB 3.0 interfaces broadcast broadband harmonic noise straight into the 2.4 GHz ISM band, so wrapping USB lines in copper tape or running them inside copper tubing keeps emissions well below the spectrum analyzer’s noise floor. Operators check shield isolation daily by running an external high-power generator sweep while monitoring background levels inside the enclosure.
System grounding requires a solid, low-impedance connection from every instrument chassis to a central copper bus bar. Ground loops introduce common-mode noise that corrupts current measurements during radio state changes. The bench design keeps power returns separated from RF signal grounds right up to the central single-point lug.
What mechanical deformation limits in pogo-pin arrays cause undetected high-frequency grounding impedance shifts over long validation runs?
Sweep
Parametric validation requires strict command sequencing to map radio performance across voltage, temperature, and frequency matrices. The test host sends SCPI commands to instruments while issuing AT commands or binary packets to the device firmware. The script steps through channels, modulation modes, symbol rates, and output power levels, gathering thousands of data points quickly.
The main goal of bench software is cutting test time without sacrificing statistical confidence.
Transmitter validation starts with conducted output power checks across low, mid, and high channels. Software sets the vector signal analyzer to trigger on transmit bursts using root-raised-cosine (RRC) filter masks matching standards like IEEE 802.15.4 or Bluetooth. Peak and average power are measured over set burst windows, averaging at least 100 bursts per channel to cut Gaussian noise variance below 0.05 dB.
Transmitter Parametric Execution Protocols
Spectral purity checks ensure output power stays within legal limits without bleeding into neighboring channels. Automated scripts set the signal analyzer to sweep Adjacent Channel Power Ratio (ACPR) and Spectral Emission Masks (SEM). For cellular IoT radios on LTE-M bands, the analyzer measures power on the assigned carrier channel alongside offsets at 1.4 MHz, 3.0 MHz, and 5.0 MHz.
Automated limits evaluate these sweeps against 3GPP TS 36.521-1 parameters, flagging any module that breaches absolute emission floors.
Modulation accuracy relies on Error Vector Magnitude (EVM) to gauge quadrature balance, phase noise, and power amplifier linearity. The signal analyzer captures raw IQ blocks from the device output to calculate RMS EVM, peak EVM, carrier frequency offset, and symbol phase error. Validation scripts enforce precise limits: a 64-QAM Wi-Fi 6 signal requires an RMS EVM under -30 dB (3.16%), while a 2GFSK BLE 2M PHY transmission allows peak frequency deviations between 225 kHz and 275 kHz.
The software also records phase noise at 10 kHz, 100 kHz, and 1 MHz offsets from the carrier.
| Validation Parameter | Instrument Configuration | Automated SCPI Command Sequence | Validation Pass Target |
|---|---|---|---|
| TX Conducted Power | Power Meter / Zero-Span Analyzer | INIT:CONT OFF; SENS:POW:BURST:STAT ON; READ? | Target Nominal ± 1.0 dB |
| Error Vector Magnitude | Vector Signal Analyzer (VSA) | CONF:EVM:EGSM; CONFigure:BURSt:EVM; READ:EVM? | RMS EVM < 2.5% (BLE/Wi-Fi) |
| Occupied Bandwidth | Spectrum Analyzer | SENS:BAND:BWID:OCC:PERC 99; READ:BAND:OCC? | Within Channel Allocations |
| RX PER Sensitivity | Vector Signal Generator (VSG) | SOUR:FREQ 2440MHz; SOUR:POW -95dBm; OUTP ON | PER ≤ 1.0% at -95 dBm |
| Harmonic Emissions | Spectrum Analyzer + High Pass Filter | SENS:FREQ:CENT 4880MHz; SENS:SWE:POIN 1001; READ? | < -30 dBm (FCC Part 15) |
Harmonic checks look for spurious emissions at double, triple, and quadruple the fundamental frequency. Because strong fundamental power can push spectrum analyzer mixers into non-linear behavior, switch matrices insert high-pass or notch filters to block the fundamental tone before measurement. The software calculates the filter branch’s exact insertion loss at harmonic frequencies and applies compensation factors to the recorded spurious readings.

Receiver Sensitivity and Dynamic Range Automation
Receiver validation revolves around finding the lowest power level where the device still decodes frames reliably. The vector signal generator feeds pre-formatted packets while the test host polls the module’s firmware over UART or SPI for packet counters. Sensitivity routines use a binary search algorithm to pinpoint this threshold quickly, stepping generator power down until the Packet Error Rate (PER) hits the failure limit.
To guarantee statistical accuracy, sensitivity checks require minimum sample sizes. Testing a 1% PER limit on Bluetooth Low Energy takes at least 1,000 packets per power step; verifying a 0.1% Bit Error Rate (BER) on sub-GHz LoRaWAN links requires up to 10,000 packets due to higher variance at low symbol rates, which yield better sensitivity limits. The search engine zeroes in on the limit in 0.1 dB steps, logging the exact power level where packet decoding drops off.
Measuring a 1% Packet Error Rate on sub-GHz links requires a sample size of at least 10,000 continuous frames per 0.1 dB step to overcome thermal noise distribution variance.
Blocking and selectivity tests evaluate how well the receiver handles a signal when adjacent channels carry interference. The script runs two RF generators together, combining their outputs through a bench power combiner. Generator A outputs the target signal at 3 dB above sensitivity, while Generator B injects interference on offset frequencies defined by standards like ETSI EN 300 328.
Software ramps Generator B power until receiver PER exceeds 1%, recording the rejection ratio in decibels.
- Set the thermal chamber to -40°C and hold for a 30-minute soak period.
- Set the programmable DC supply to the module’s minimum operating floor of 1.8 V.
- Run a full transmitter sweep across low, mid, and high channels, logging power, EVM, and harmonics.
- Run the receiver sensitivity search across all channels and save the PER power thresholds.
- Set the supply voltage to nominal 3.3 V and repeat the full TX and RX sweeps.
- Set the supply voltage to maximum 3.6 V and repeat the full TX and RX sweeps.
- Step the chamber temperature to +25°C and +85°C sequentially, repeating the voltage steps at each temperature.
Dynamic range evaluation sweeps generator power from sensitivity floors (-105 dBm) up to saturation limits (-10 dBm). This flags receiver front-end overload, where strong RF power drives internal Low Noise Amplifiers (LNAs) into saturation and causes dropped frames at high signal levels. The system logs Received Signal Strength Indicator (RSSI) linearity across the range, comparing reported RSSI against actual calibrated generator levels.

Environmental Stress and Dynamic Voltage Testing
Thermal stress brings out hidden silicon defects. Bench software controls programmable environmental chambers over SCPI or Modbus via RS-485 interfaces to validate compliance across the industrial temperature range of -40°C to +85°C. The automation software syncs temperature ramps with test execution, holding 30-minute soaks at each step so the PCB and shield cans reach thermal equilibrium before sweeps begin.
Dynamic voltage margining catches phase-locked loop (PLL) instability and power management IC (PMIC) dropouts. Programmable DC supplies step input voltages through minimum, nominal, and maximum thresholds while the radio transmits at full power. These voltage steps test for transient drops during high-power bursts, making sure decoupling capacitors keep the radio stable without triggering a low-voltage reset.
Stress sweeps run full parametric matrices across three dimensions: voltage, temperature, and channel. A single radio variant can generate over 5,000 data points during a multi-dimensional matrix test. Automation frameworks use asynchronous logging to stream results into high-performance databases, tracking real-time status and immediately aborting runs if out-of-spec conditions occur.
Monitoring frequency drift during temperature changes catches unstable crystal oscillators. The spectrum analyzer records center frequency offset every 5°C during ramps. If an onboard TCXO exhibits non-linear thermal hysteresis over ±10 ppm, the software flags the slope.
Thermal stress exposes design flaws that room-temperature testing misses entirely.
Calibrating baseline automated sweep routines against reference golden units keeps instrument execution timing under 120 milliseconds per SCPI iteration.
Over-the-air signal coupling parameters shift dynamically inside small test enclosures when ambient humidity fluctuates.

Margin
Raw bench test results carry measurement uncertainties that weaken pass/fail confidence if ignored. Validating parameters properly requires formal uncertainty budgets aligned with the ISO/IEC Guide to the Expression of Uncertainty in Measurement (GUM). Converting raw instrument data into usable validation limits means applying statistical guardbands so marginal parts don’t make it into production.
Calculating uncertainty requires accounting for every independent error source along the measurement chain. Typical contributions include power meter sensor linearity, spectrum analyzer amplitude accuracy, directional coupler calibration, coaxial cable return loss mismatch, and thermal drift. Combining these individual uncertainties using the root-sum-of-squares (RSS) method yields an expanded uncertainty figure, usually scaled by a coverage factor of k = 2 for a 95% confidence interval.

Measurement Uncertainty Budgeting and Guardband Mechanics
Guardbands tighten published engineering limits by the calculated expanded uncertainty figure. If regulatory limits set a maximum output power of 20.0 dBm and system uncertainty is ±0.8 dB, the automated pass limit tightens to 19.2 dBm. Any module reading between 19.2 dBm and 20.0 dBm falls into the guardband ambiguity zone and fails, guaranteeing strict compliance.
Mismatch uncertainty is often the largest error source in RF measurements. When impedance at the device port drifts from the nominal 50 Ω reference, reflections create standing wave variations. Mismatch loss uncertainty is calculated by multiplying the device return loss matrices against the test station return loss vectors.
Upgrading directional attenuators to keep station return loss better than -26 dB suppresses mismatch uncertainty below ±0.15 dB across sub-6 GHz bands.
| Uncertainty Component Source | Probability Distribution Type | Standard Uncertainty Value (dB) | Sensitivity Coefficient | Combined Contribution (dB) |
|---|---|---|---|---|
| Power Sensor Calibration Factor | Normal (k = 2) | 0.045 | 1.0 | 0.045 |
| Spectrum Analyzer Linearity | Rectangular | 0.115 | 1.0 | 0.066 |
| Switch Matrix Path Loss Measurement | Normal (k = 2) | 0.040 | 1.0 | 0.040 |
| RF Mismatch (DUT to Switch Port) | U-Shaped | 0.120 | 1.0 | 0.085 |
| Ambient Thermal Drift (± 2°C) | Rectangular | 0.030 | 1.0 | 0.017 |
Uncertainty budgets grow at higher frequencies. At 5.8 GHz, cable dielectric loss, connector wear, and elevated VSWR push combined uncertainty to ±1.2 dB. Engineers offset this by shortening coax runs, using low-loss phase-stable cables, and recalibrating more frequently to keep guardbands tight without destroying production yields.

Why Do Bench Sensitivity Figures Shift during Production Runs?
Sensitivity figures measured during lab validation often shift when moving to full-scale production. This drift usually comes from variations in ground-plane contact resistance across multi-pin sockets, alongside electromagnetic noise from handler motors running next to unshielded test slots. Over 50,000 cycles, socket spring pins build up metallic oxides that add up to 200 mΩ of contact resistance, detuning impedance matching capacitors near RF ground pads.
Thermal gradients across dense test sockets cause further baseline drift. As automated handlers rapidly cycle units, socket bodies absorb heat from power amplifiers, raising temperatures inside the socket by 15°C above room ambient. Higher silicon junction temperatures degrade LNA noise figures by up to 0.4 dB, lowering measured sensitivity.
Routine checks isolate socket wear from wafer lot variations by inserting verified golden units every 500 test cycles.
ETSI EN 300 328 Clause 4.3.2.2 mandates that declared transmitter output power parameters include the maximum expanded measurement uncertainty value within reported technical construction files.
Uncalibrated fixtures hide actual product variance under artificial noise. Building real-time path loss checks into production scripts verifies baseline losses against golden unit profiles before starting a run. If the system detects path loss drifting more than 0.2 dB, it locks the active test channel, preventing false yield drops across production batches.

Statistical Process Control and Cpk Threshold Validation
Validation relies on Statistical Process Control (SPC) to verify that silicon performance distributions stay centered within design limits. The process capability index (Cpk) measures how tightly data clusters between upper and lower limits. Keeping Cpk at or above 1.67 ensures fewer than 0.6 defective parts per million (PPM), giving high confidence in manufacturing yield.
Tracking statistical distributions catches silicon lot drift before parts fail in the field. Analytics software scans historical validation logs, tracking moving means and standard deviations for parameters like center frequency error and EVM. If a new wafer lot shows a 2-sigma shift in transmit current, SPC software triggers an alert so sourcing teams can address foundry variations before volume assembly.
- Dynamic Limit Guardbanding Subtract total expanded measurement uncertainty from regulatory ceilings to establish tight pass thresholds.
- Continuous Cpk Monitoring Flag any parameter where Cpk drops below 1.33 to catch silicon lot anomalies early.
- Golden Unit Interlocking Require golden unit verification sweeps every 24 hours to prevent test fixture drift from corrupting test data.
- Mismatch Loss Minimization Install high-performance fixed attenuators at fixture interfaces to maintain station return loss below -20 dB.
- Socket Actuation Tracking Log test socket actuations in the database, triggering pin replacement at 50,000 cycles.
Correlating bench validation results with fast-sweep production data ensures long-term consistency. Validation engineers build models comparing precise bench sweeps against abbreviated production tests. Identifying fixed offsets between bench instruments and production testers allows engineers to apply correction factors, maintaining high yield without skipping critical validation steps.
Early validation sweeps showed a 1.2 dB sensitivity drop until socket pin oxidation was identified as the root cause of interface impedance drift.
Standard operating procedures must state explicitly that failing to apply guardbands equal to or exceeding expanded measurement uncertainty invalidates all internal regulatory compliance claims under EU RED directive audits.

Dossier
Validating radio parameters produces the evidence required for regulatory filings, customer audits, and production handoffs. Automated test engines turn raw binary traces, spectral captures, and statistical distributions into standardized qualification reports. The resulting validation dossier acts as the legal and technical record proving the radio module complies with standards like FCC Part 15 subpart C, ETSI EN 300 328, ETSI EN 300 220, and 3GPP specifications across all operating conditions.
Report generation pipelines pull stored measurement data directly from relational or document databases. Processing scripts strip out initial calibration sweeps and system check failures, calculating final figures from de-embedded interface values. Template engines assemble vector graphs, spectral emission curves, and statistical summaries into readable PDF reports alongside JSON or XML data files.
Serial numbers link trace files back to specific silicon batches.

Automated Report Generation and Raw Data Persistence
Preserving unaltered raw data is essential for auditable test engineering. Validation frameworks save raw instrument traces ~ including complex IQ arrays, analyzer sweep data, and voltage/current time series ~ to secure, read-only storage. Cryptographic hashing (such as SHA-256) generates checksums for every trace file at capture time, embedding the hash into database records to prevent tampering or silent corruption.
Databases store validation results in a clean hierarchy: Test Run -> Device Under Test (Serial/Batch ID) -> Environmental Station Condition -> Frequency Channel -> Parameter Metric. This structure makes cross-lot analysis straightforward. Engineers can run queries to map power efficiency across thousands of production units, comparing early design verification (DVT) results against late-stage process verification (PVT) silicon.
Report visual layouts focus on clarity and fast defect spot-checking. Plotting scripts draw output power against supply voltage across temperature curves, adding clear upper and lower specification limits to every chart. High-contrast colors flag out-of-spec data points immediately, while callout blocks summarize mean, standard deviation, minimum, maximum, and Cpk right next to the charts.

Regulatory Dossier Cross-Referencing and Test Mapping
Regulatory approval requires linking bench parameters to specific clauses in regional standards. Validation software uses mapping matrices to tie internal SCPI commands directly to target compliance rules. For example, automated occupied bandwidth sweeps map directly to FCC Part 15.247(a)(2) rules for digital modulation systems, confirming that 6 dB bandwidth reaches at least 500 kHz across all channels.
Dossier tools gather test results into uniform Technical Construction Files (TCF). For European CE marking under the Radio Equipment Directive (RED 2014/53/EU), the automated engine compiles Receiver Category assessments, Adaptivity / Listen-Before-Talk (LBT) timing verification, and Radiated Spurious Emissions (RSE) summaries. The software formats documents to meet layout requirements mandated by Notified Bodies, cutting administrative overhead during international type approvals.
Cross-referencing also covers wireless alliance certifications. Bluetooth SIG qualification, Wi-Fi Alliance interoperability testing, and LoRaWAN regional compliance each require custom summary formats showing adherence to underlying specs. Automated tools extract standard-specific metrics from the database, auto-filling official test declaration forms to speed up market launch.
Factory Production Calibration Bitstream Generation
Bench validation yields precise radio calibration factors that must transfer to mass-production programming lines. Automated scripts calculate module offset corrections for transmit power tables, crystal oscillator tuning capacitors, and analog RSSI slopes. Software packages these offsets into compact binary payloads ready for flashing into non-volatile memory or One-Time Programmable (OTP) registers.
Binary calibration payloads are cryptographically signed to keep corrupted or unverified configurations off production lines. Automated tools write the bitstream during final functional programming. On boot, radio firmware reads these values to calibrate power amplifier gain steps and TCXO frequency compensation.
A quick 2-second sanity sweep verifies the calibration write before final packaging.
Traceability data stored inside the calibration bitstream links every field unit back to its bench validation history. Embedded fields record station ID, calibration timestamp, test software version, and golden unit reference IDs directly in flash memory. If a unit returns from the field, failure analysis teams can read these fields over standard diagnostic commands to retrieve its original test profile.
Closing the loop between design validation benches and production calibration lines minimizes unit-to-unit variance in volume shipping. Feedforward loops send real-time yield metrics back to validation engines, flagging parameter drift when calibration offsets near maximum trim limits. Validation engineers can then adjust baseline component tolerances or matching networks, keeping manufacturing yields steady over long production runs.