Measurement Uncertainty Mechanics across Accredited Laboratories during Multi Market Radio Retests
Radio measurement uncertainty differences across accredited labs require mandatory 6 dB design guardbands to prevent market surveillance failures.


Variance
Radiated and conducted radio frequency emissions testing across accredited facilities introduces measurable discrepancies stemming from expanded uncertainty budgets. Technical managers comparing test reports from two independent ISO/IEC 17025 accredited houses often observe amplitude variations reaching 3 dB to 5 dB on identical physical samples. Errors compound rapidly.
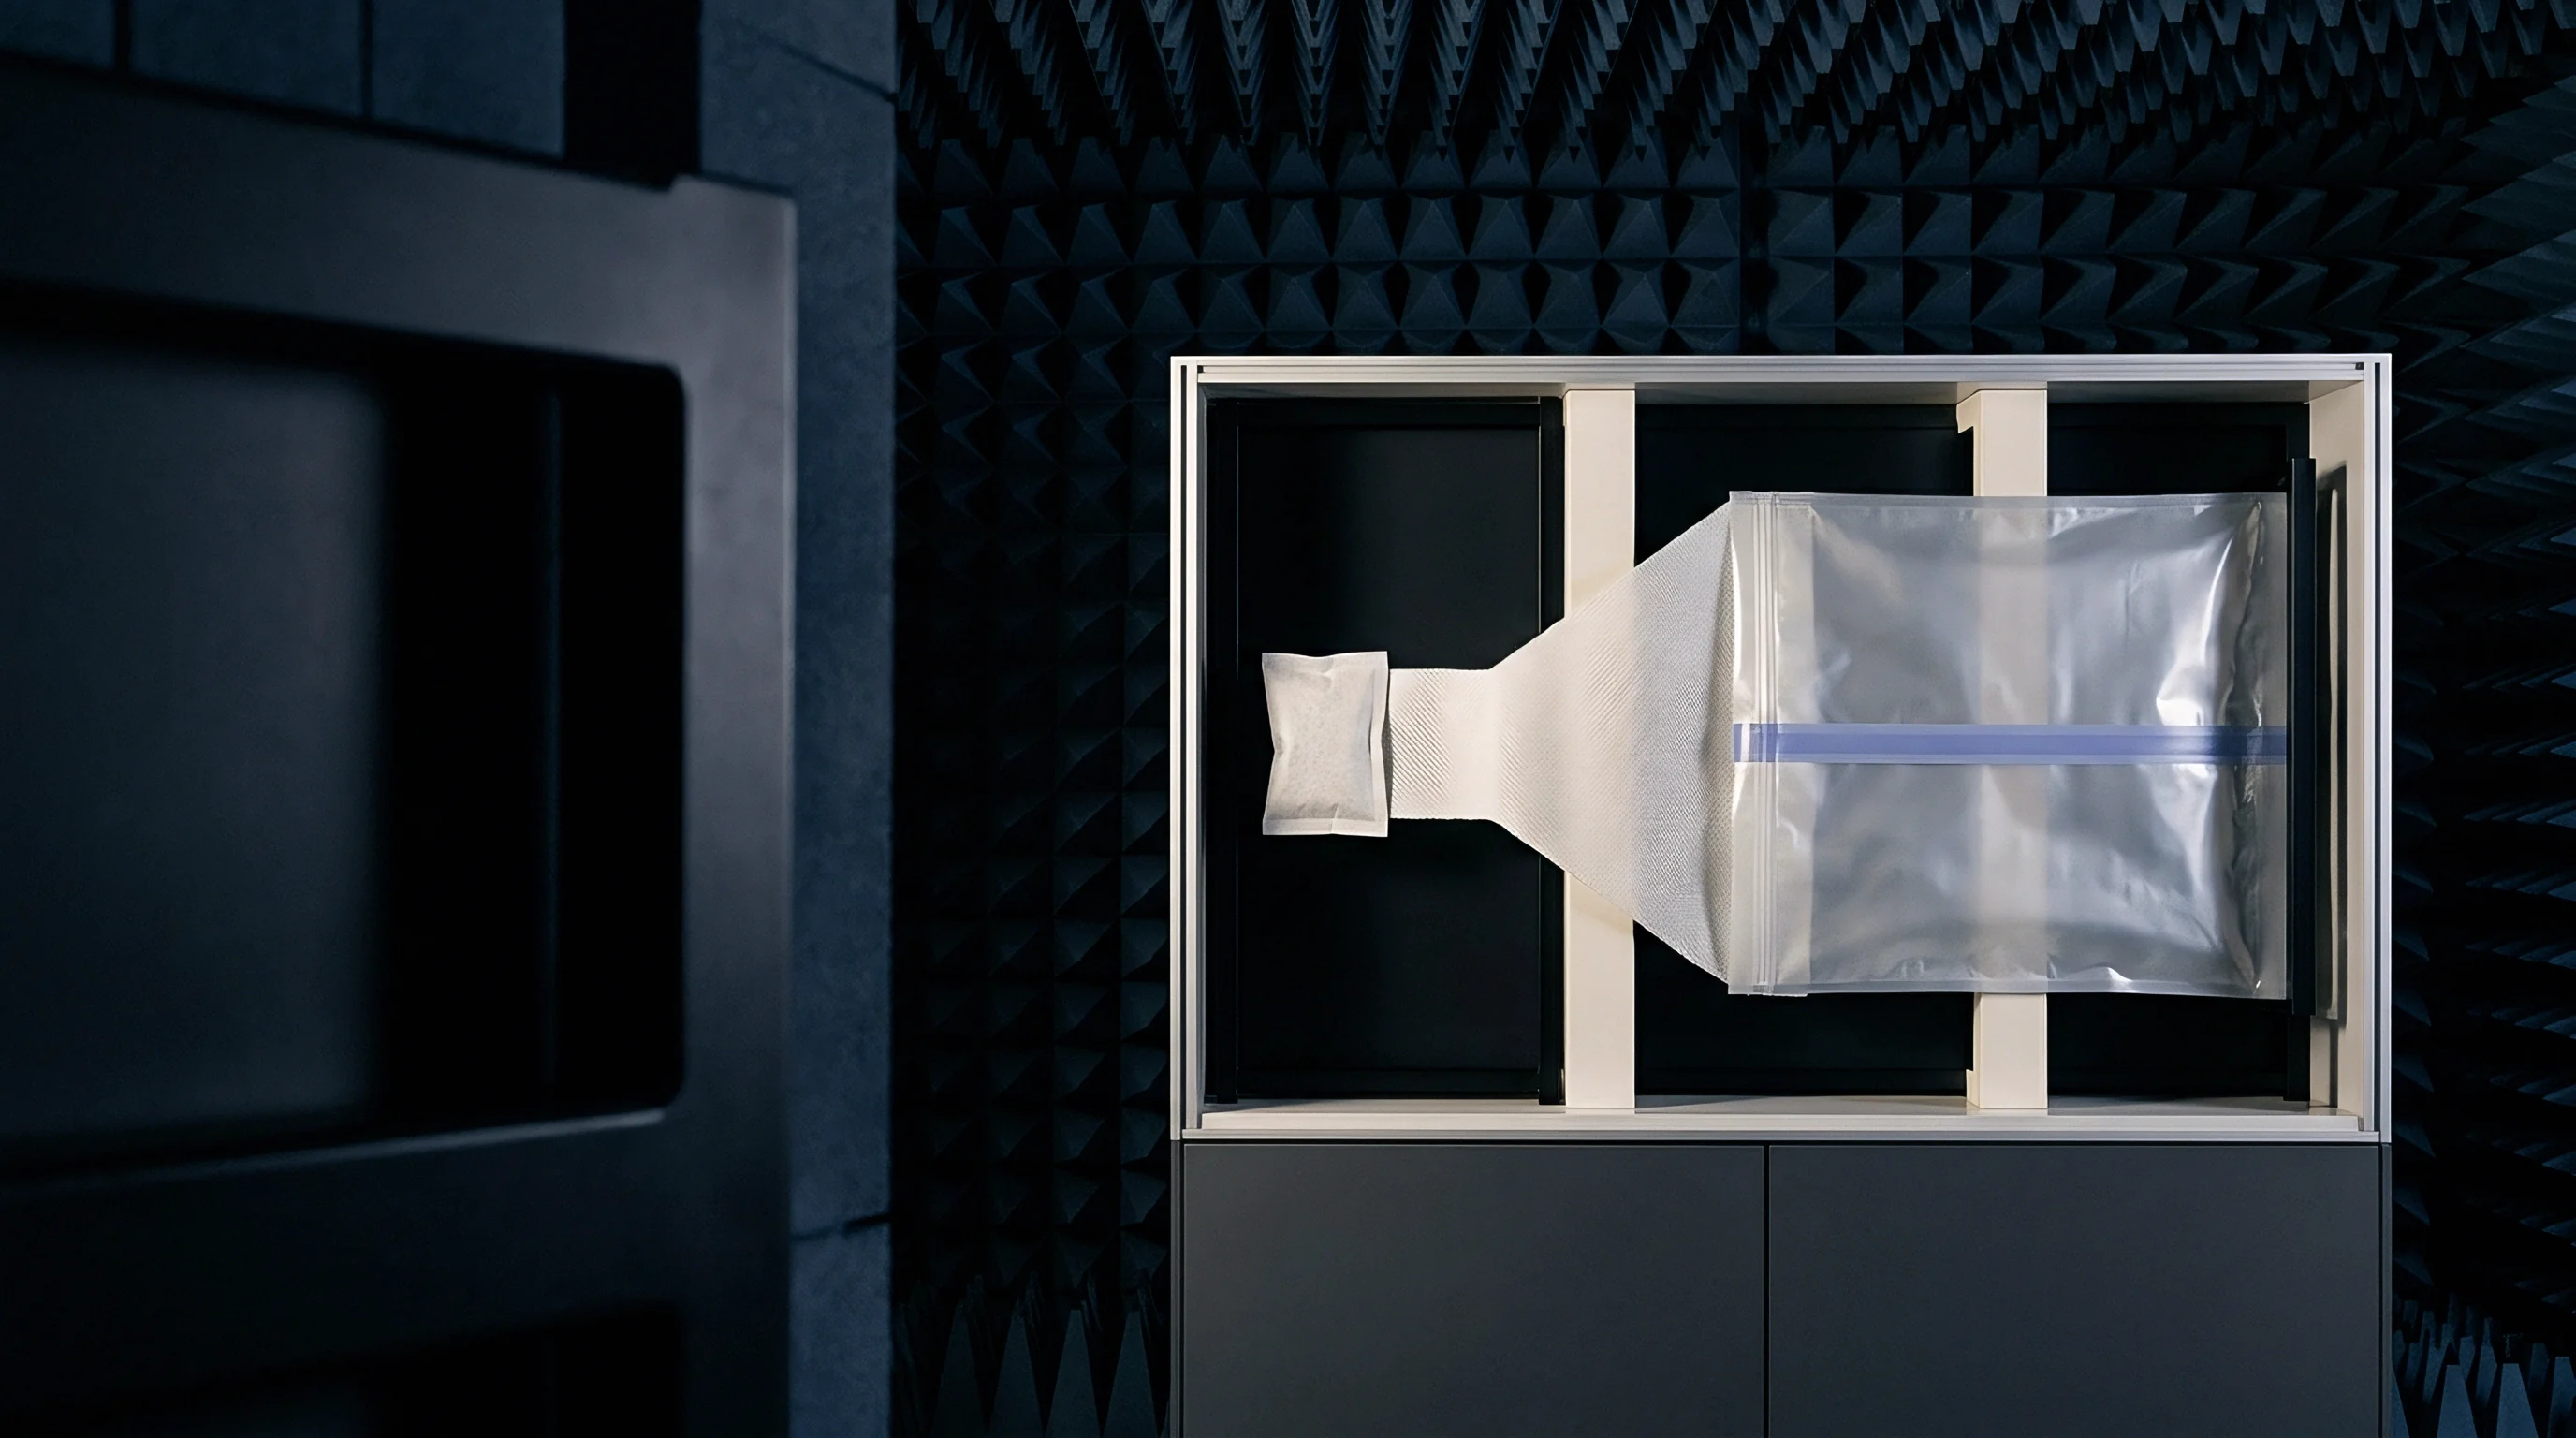
Expanded Uncertainty Budgets in Radio Metrology
ISO/IEC 17025 dictates that test reports include calculated confidence intervals for quantitative radio frequency parameters. Accredited facilities calculate combined standard uncertainty by taking the root-sum-square of all individual field elements, including receiver amplitude accuracy, cable attenuation, antenna factor calibration, and site attenuation departures. The expanded uncertainty U uses a coverage factor k=2, providing an approximate 95 percent confidence level for the reported value.
CISPR 16-4-2 sets maximum allowable expanded uncertainty thresholds for radiated disturbance measurements between 30 MHz and 1000 MHz at 6.3 dB in semi-anechoic chambers. ETSI TR 100 028 provides the reference framework for European radio parameter measurements, establishing maximum acceptable values such as 6.0 dB for radiated electric fields below 1 GHz and 1.5 dB for conducted power output.
Accredited radio test facilities operating under CISPR 16-4-2 permit an expanded uncertainty budget up to 6.3 dB for radiated emission measurements below 1 GHz.
When Laboratory A records a radiated spurious emission level of -38 dBm against a -36 dBm limit, the result stands as a nominal pass. Laboratory B retesting the same hardware under equivalent nominal conditions may report -34.5 dBm due to systematic variations within its approved 6.0 dB uncertainty envelope. Calibrations degrade without visible signs.
The product fails the secondary audit despite neither laboratory breaching its accredited uncertainty allowance.
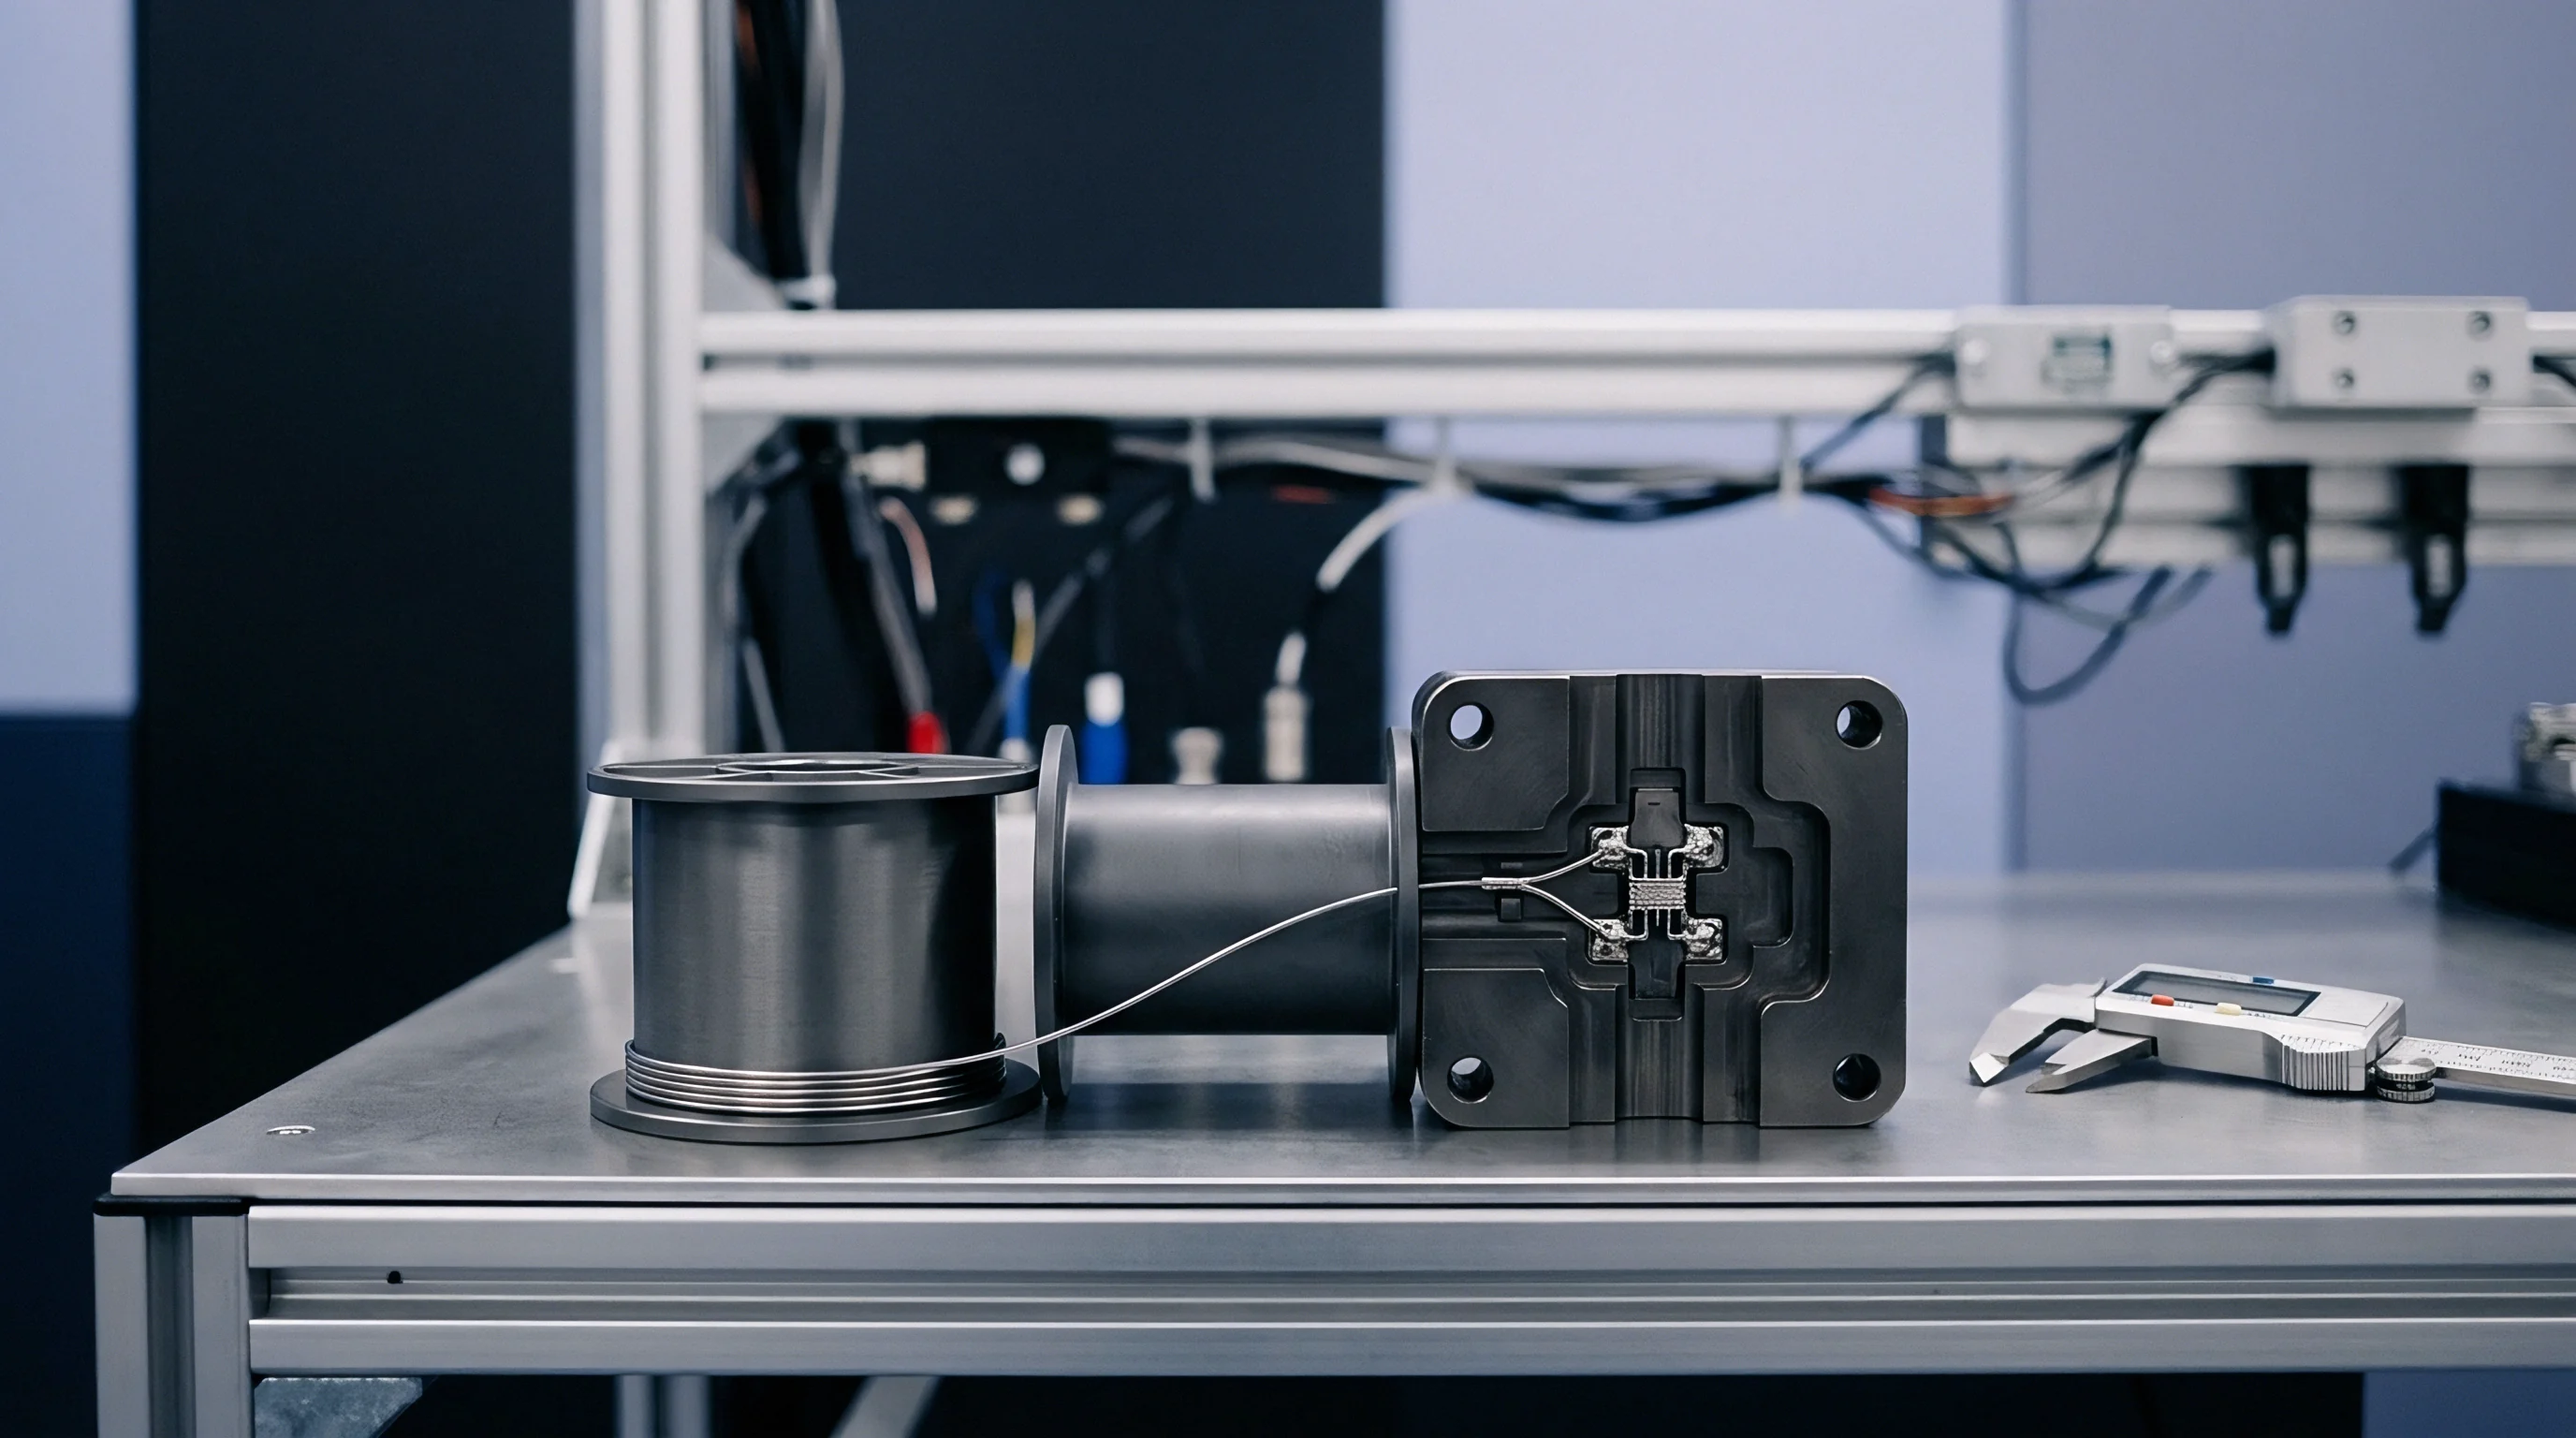
Sources of Laboratory Measurement Discrepancies
Physical measurement systems contain cumulative elements that shift the recorded baseline across facilities. Unidentified attenuation drift or uncompensated impedance mismatches between the receive antenna and the spectrum analyzer front-end alter emission peaks.
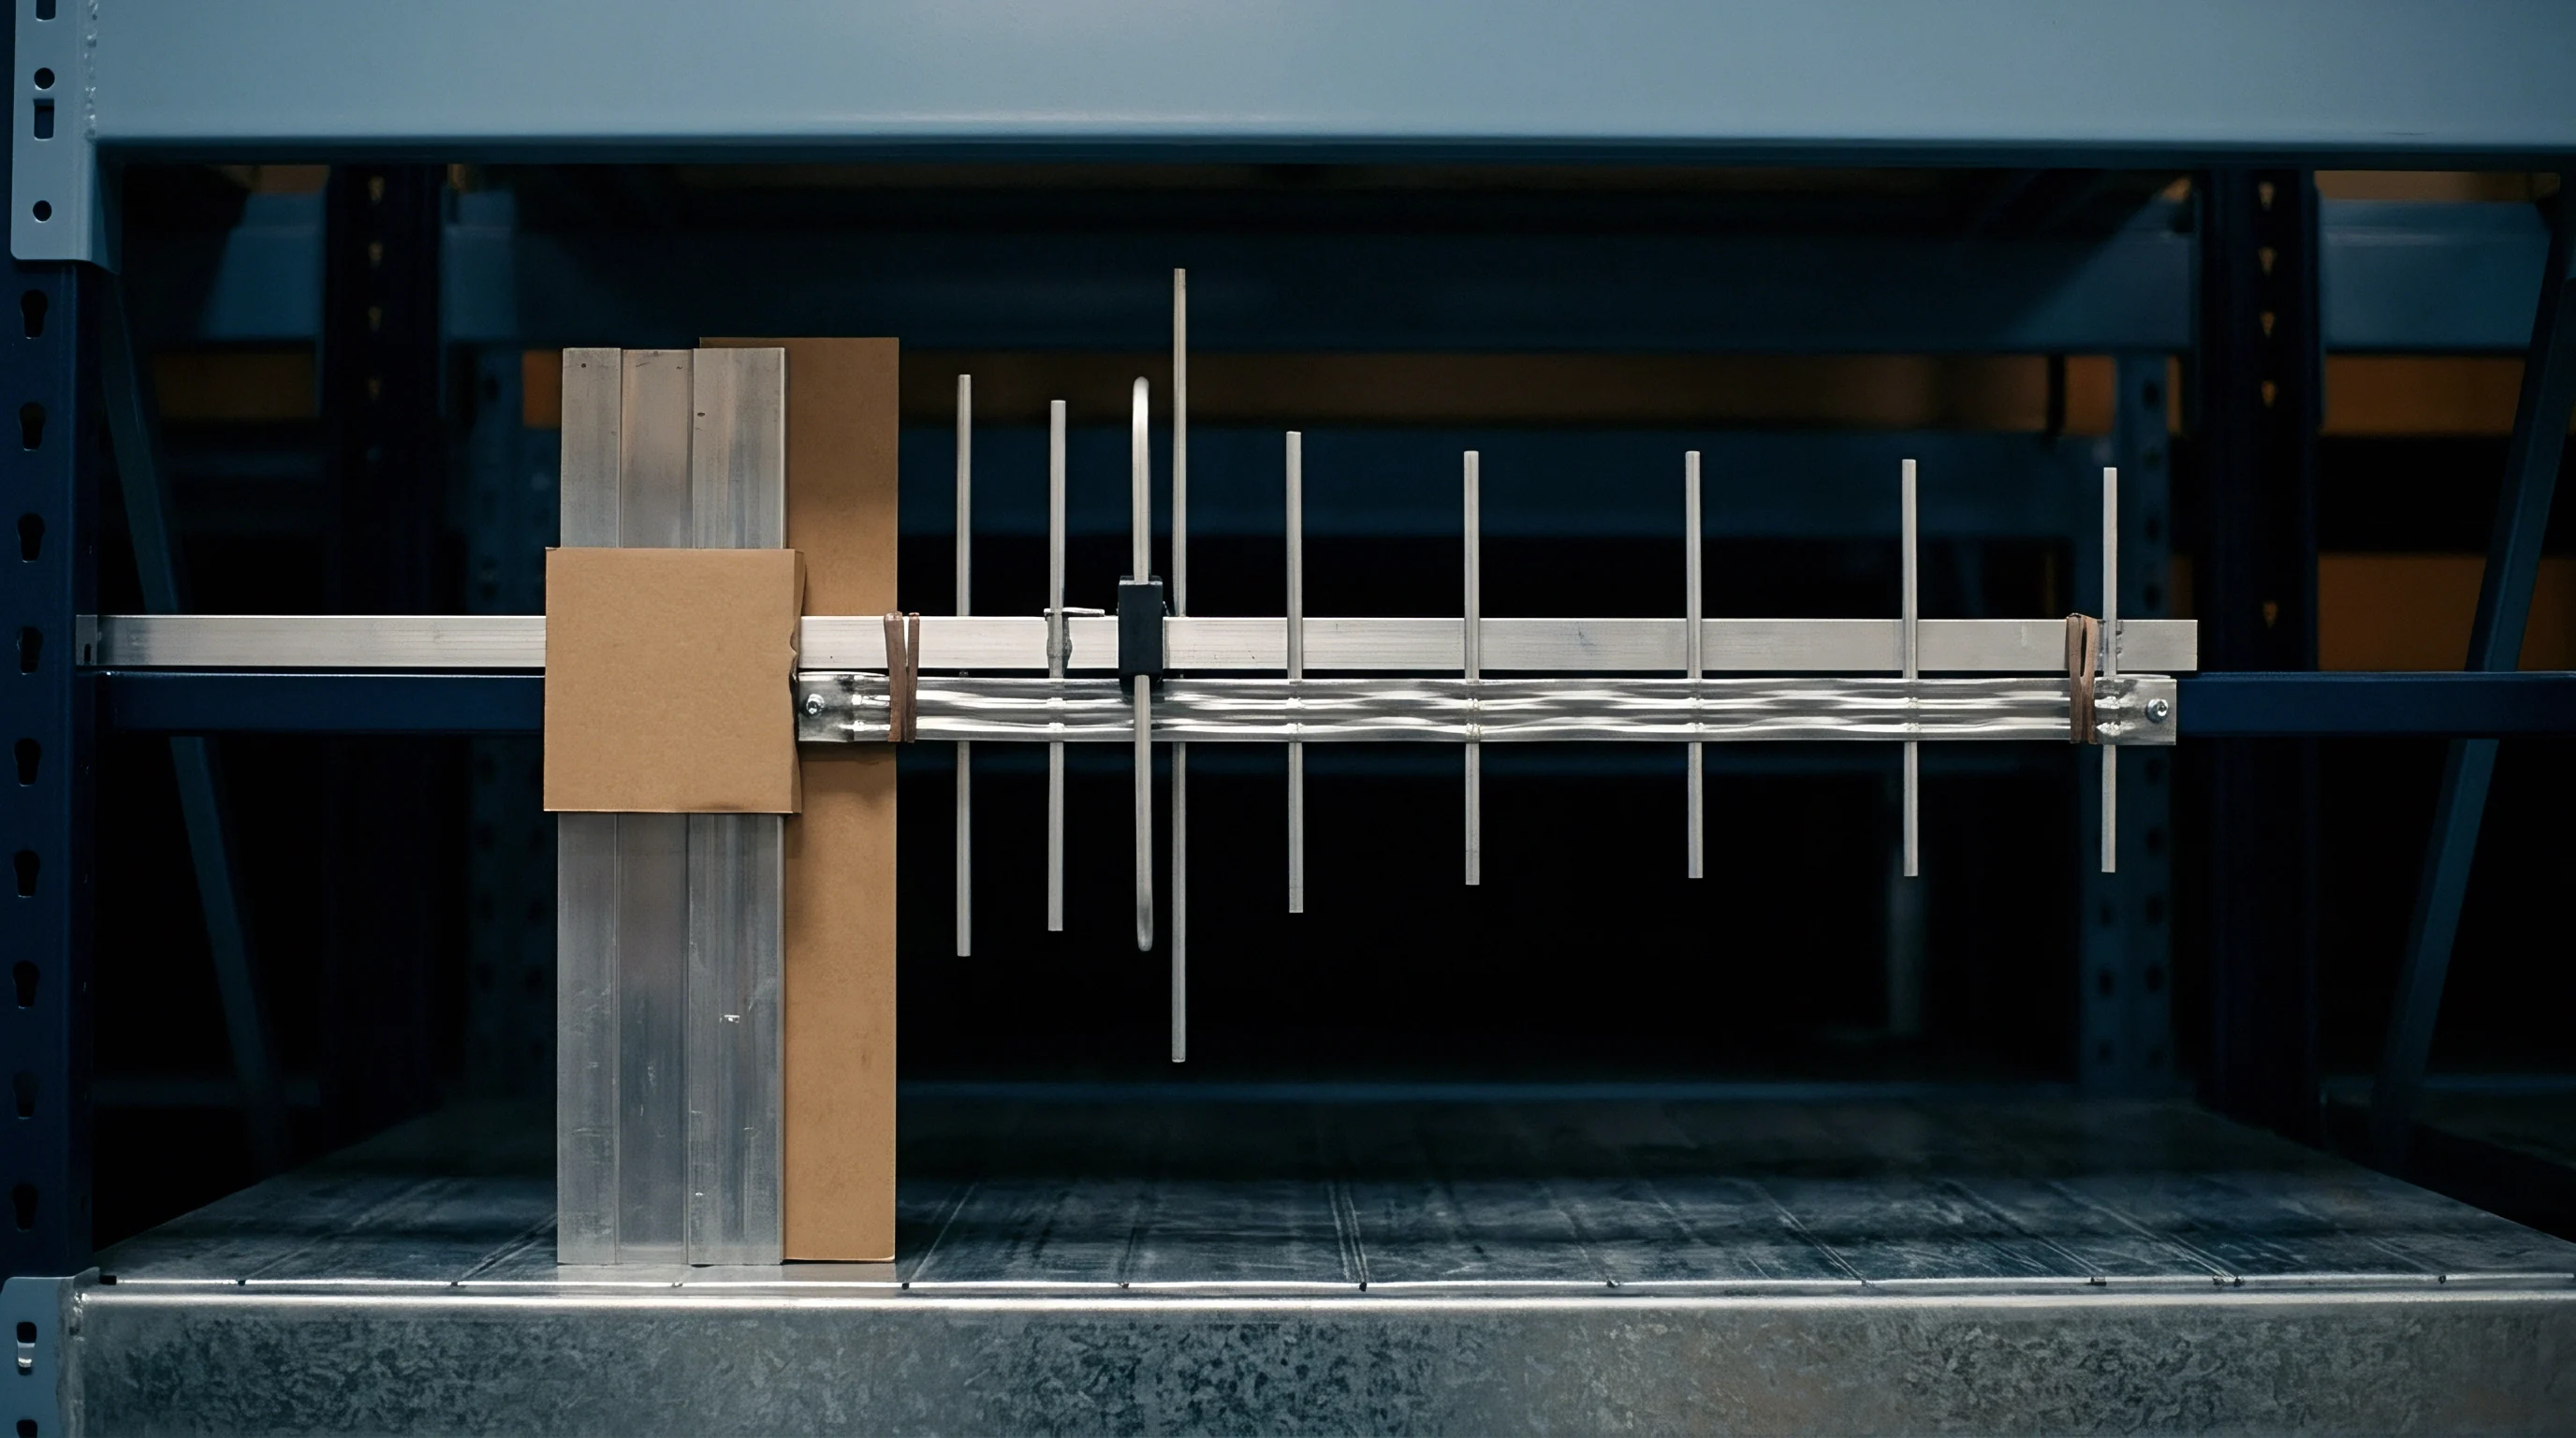
- Antenna factor calibration drift shifts calculated field strengths when periodic calibrations rely on interpolation across coarse frequency steps rather than continuous swept data.
- Cable attenuation hysteresis introduces variable signal loss as flexible phase-stable cables flex on motorized turntable booms during 360-degree azimuth scans.
- Receiver amplitude non-linearity causes pulse desensitization or overload distortion during peak detector sweeps near broadband digital carrier frequencies.
- Site attenuation departures from ideal free-space characteristics create localized standing waves inside semi-anechoic chambers despite valid site voltage standing wave ratio certification.
Quantifying these contributions requires analyzing the instrument calibration certificates alongside the test house site verification logs. Distinguishing between random measurement noise and systematic laboratory bias determines whether a failure originates from hardware design defects or facility environment limits.
| Measurement Parameter | Frequency Range | ETSI TR 100 028 Limit | CISPR 16-4-2 Limit | FCC / ANSI C63.26 Guide |
|---|---|---|---|---|
| 30 MHz to 6 GHz | 1.5 dB | Not Applicable | 1.0 dB | |
| 30 MHz to 1000 MHz | 6.0 dB | 6.3 dB | 6.0 dB | |
| 1 GHz to 40 GHz | 6.0 dB | 5.2 dB | 6.0 dB | |
| 9 kHz to 6 GHz | 5.0 % | Not Applicable | 2.0 % |
Facilities maintaining tighter internal uncertainty budgets than standard thresholds provide higher test reproducibility across international markets.
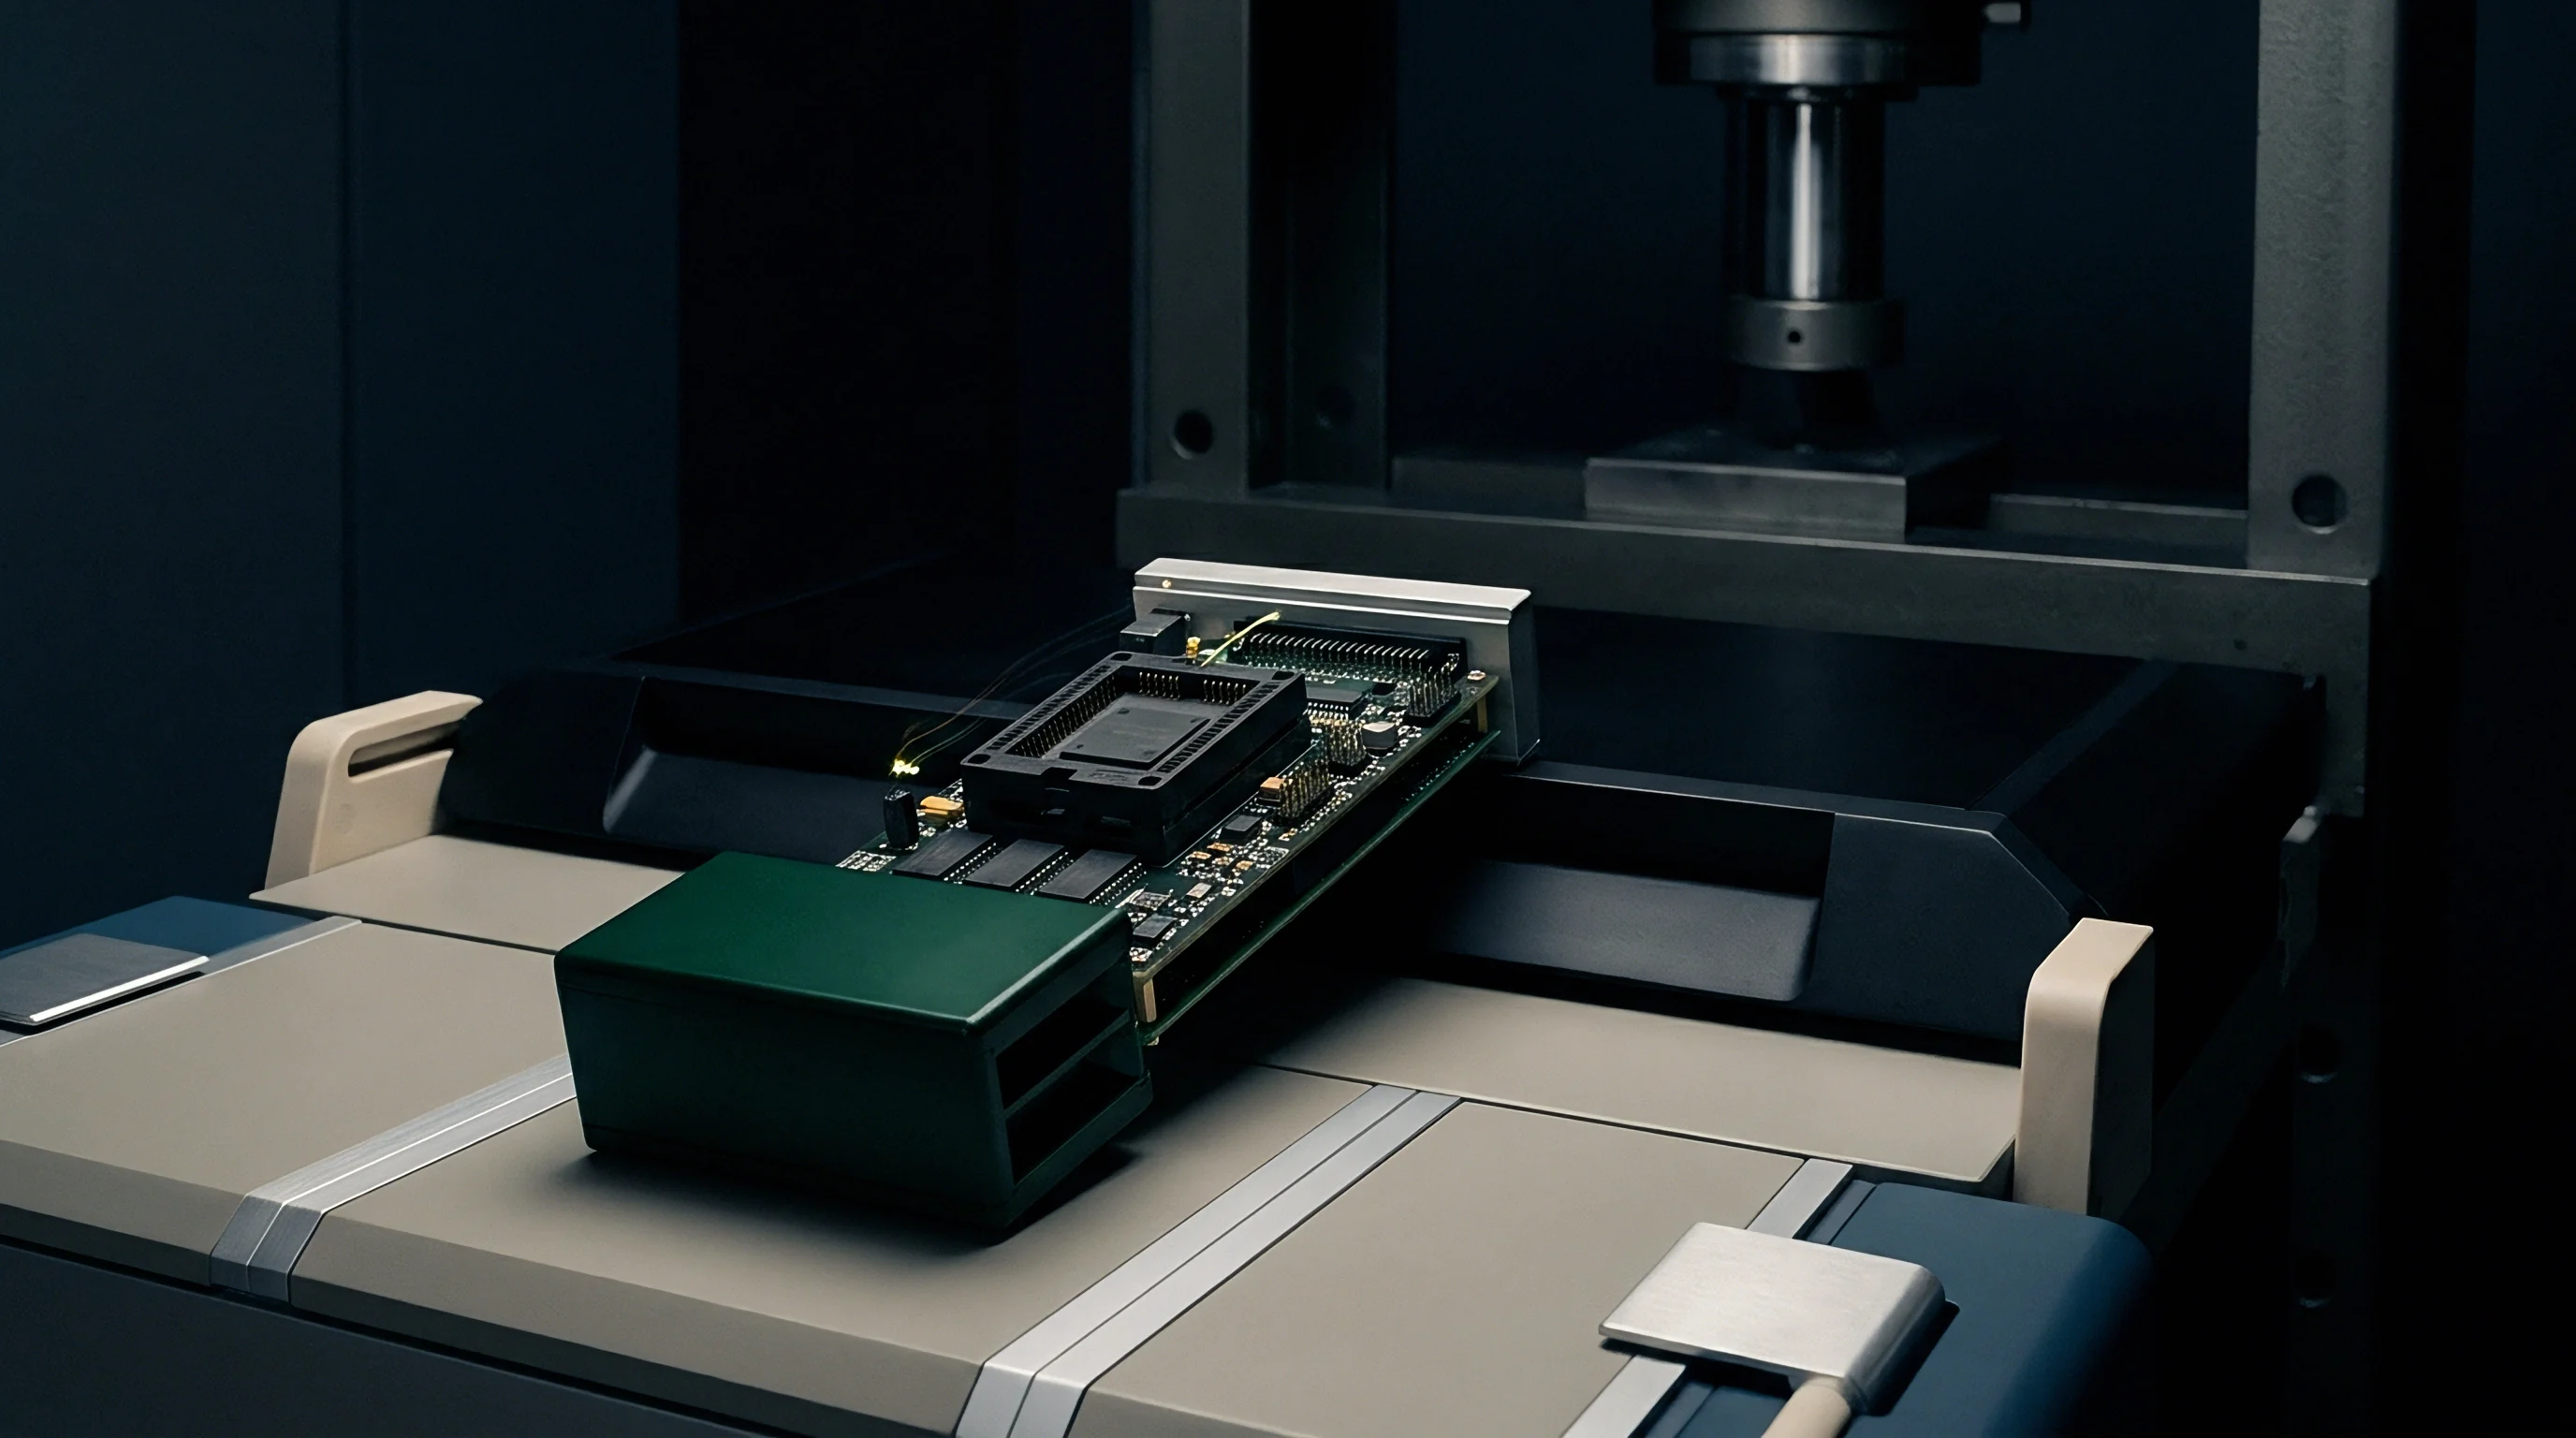
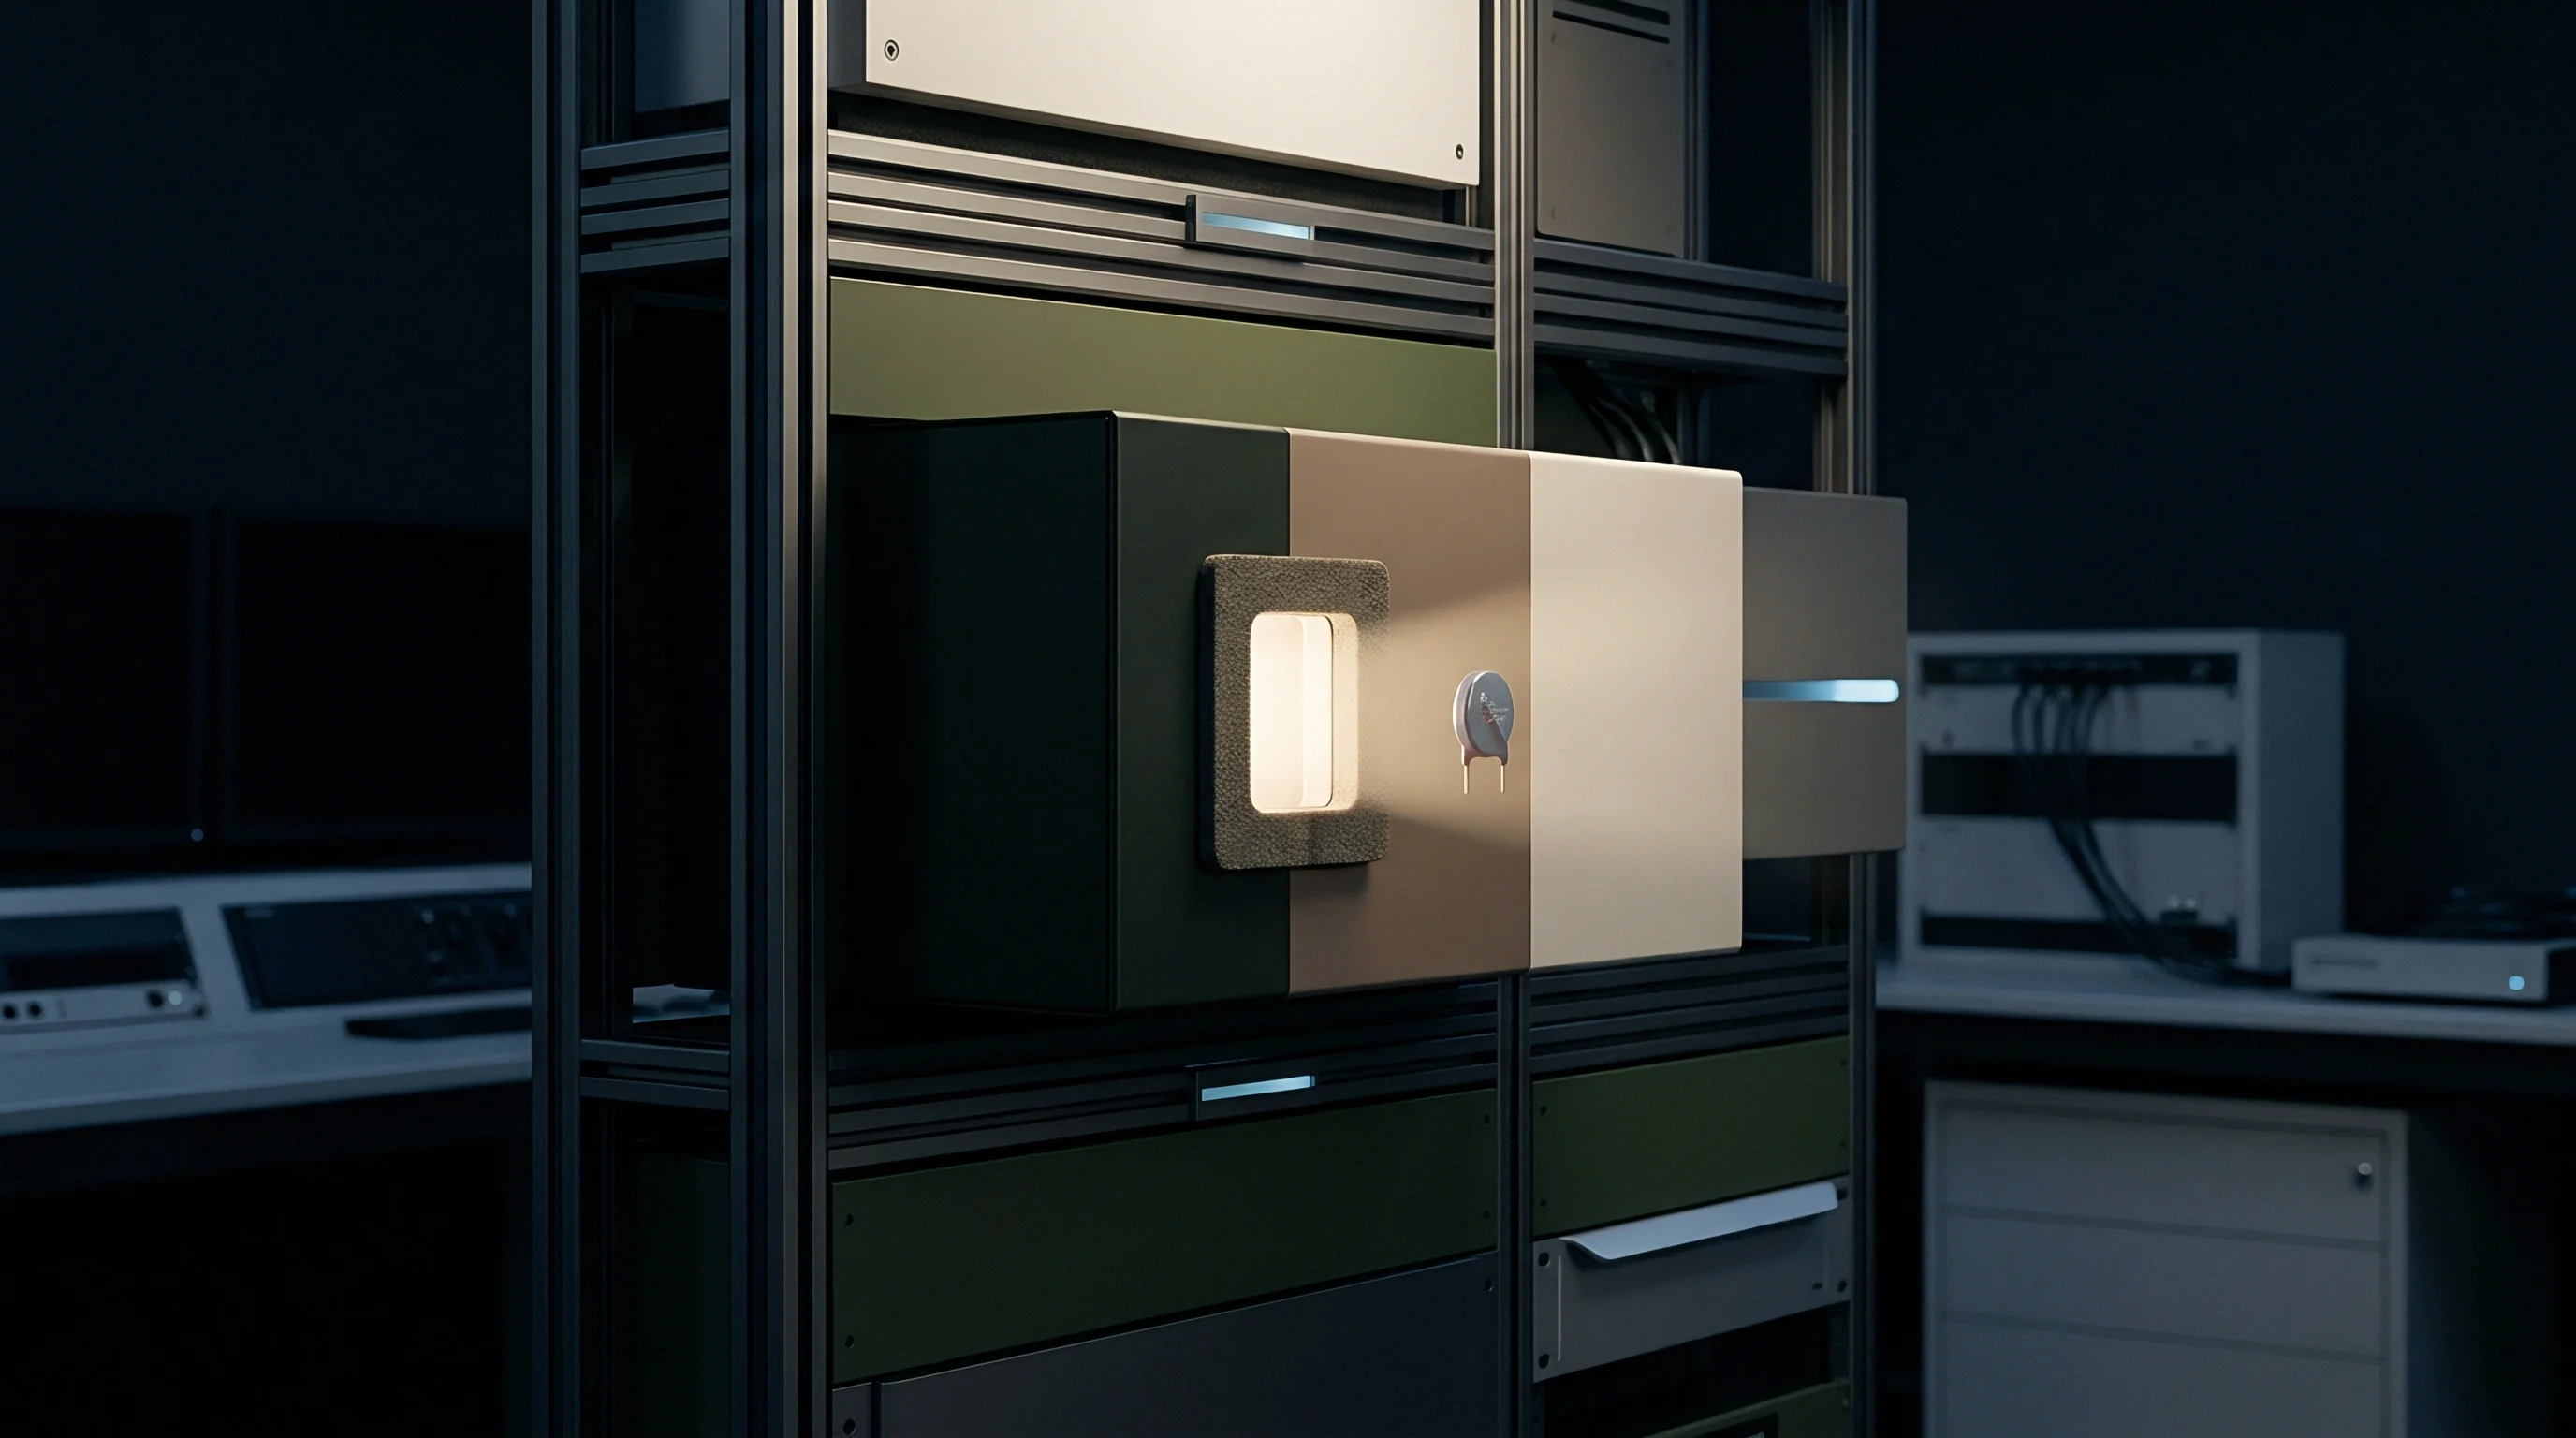
Rig
Physical test chamber setups create direct physical sources of measurement divergence. Antenna positioners, turntable heights, feed line routing, and reflective properties inside semi-anechoic enclosures introduce physical variations during radio retests.

Physical Chamber Mechanics and Alignment Protocols
Harmonic distortion and spurious emission scans rely on precise physical orientation of the device under test relative to the receive antenna. Turntables introduce mechanical axial play. Minor shifts in power harness positioning alter common-mode current conversion on peripheral cables, transforming high-impedance PCB traces into efficient radiating structures.
ETSI EN 300 328 and ANSI C63.10 demand continuous height searches from 1 meter to 4 meters alongside 360-degree turntable rotations. If Laboratory A positions a desktop host peripheral trailing a power supply cable flat against a wooden support while Laboratory B drops the same cable vertically toward the ground plane, the measured emission profile shifts by more than 8 dB at frequencies above 400 MHz.
Compliance under ANSI C63.10 requires maximizing cable radiation through manual manipulation during turntable height scans.
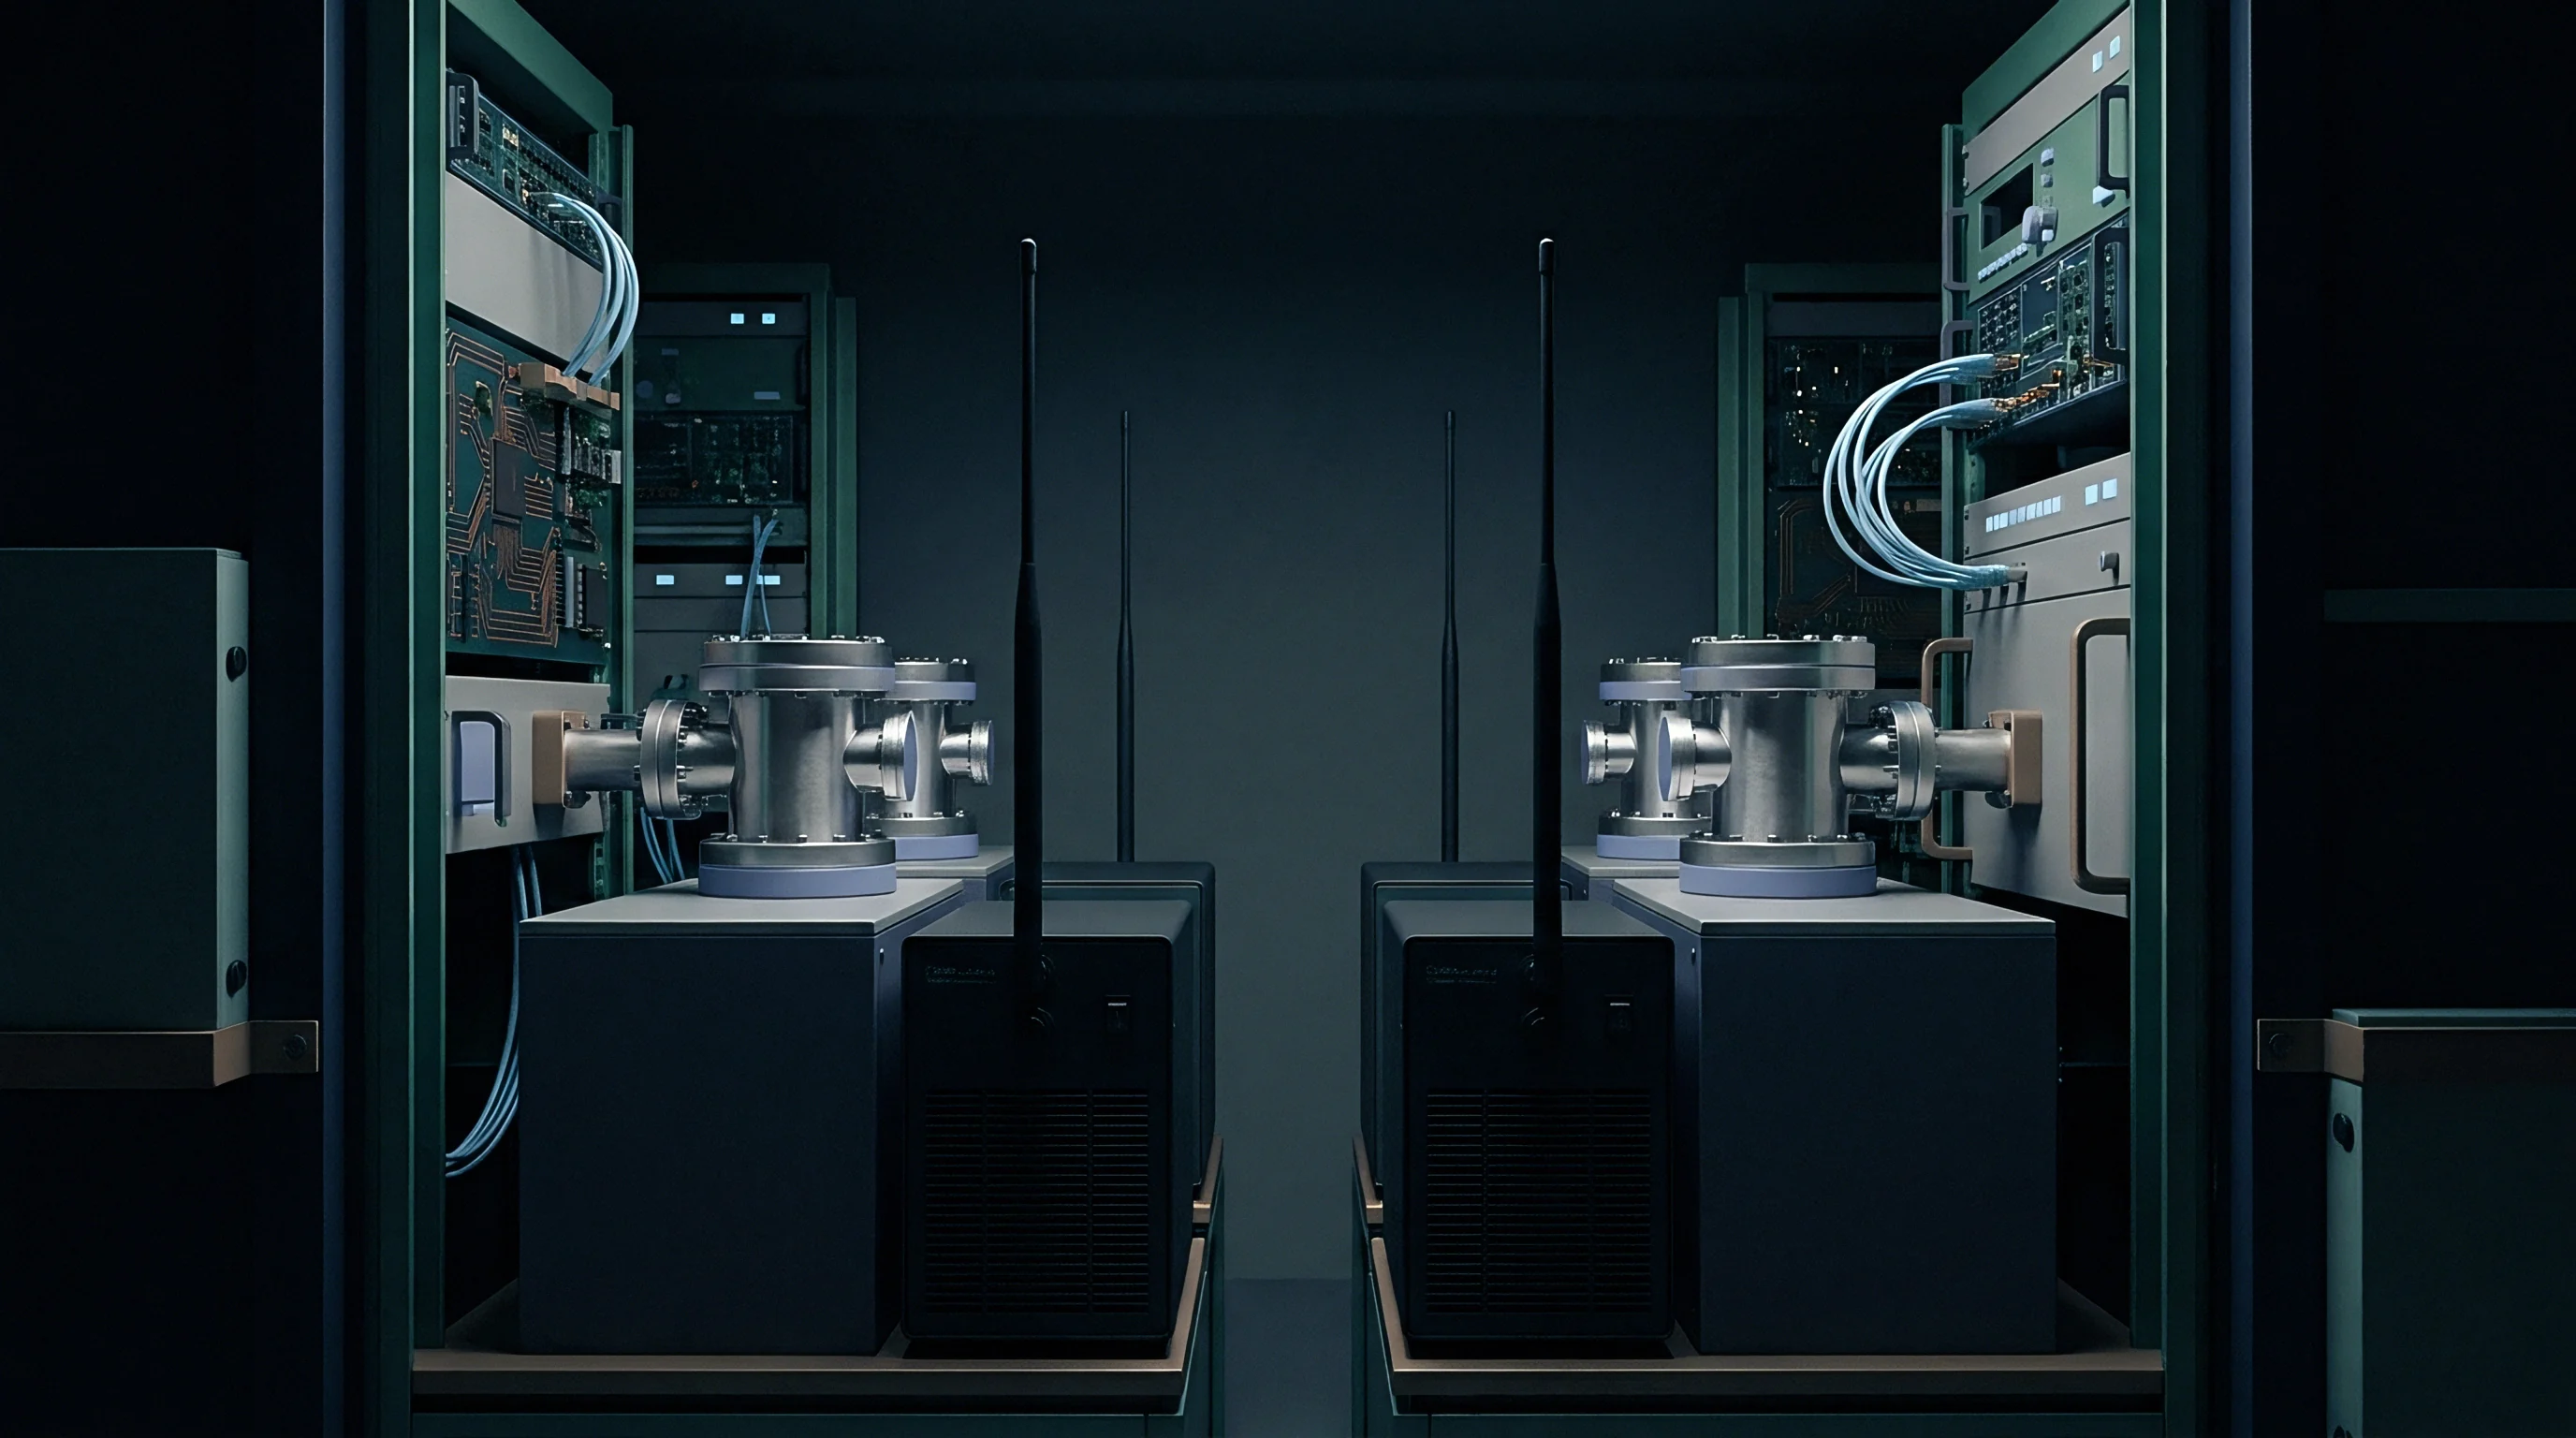
Chambers drift over time. RF absorbing foam cones degrade through mechanical impact, humidity, and thermal cycling from high-power power amplifiers. Absorber degradation increases wall reflections, changing chamber site attenuation profiles and generating unexpected constructive interference at specific frequencies.
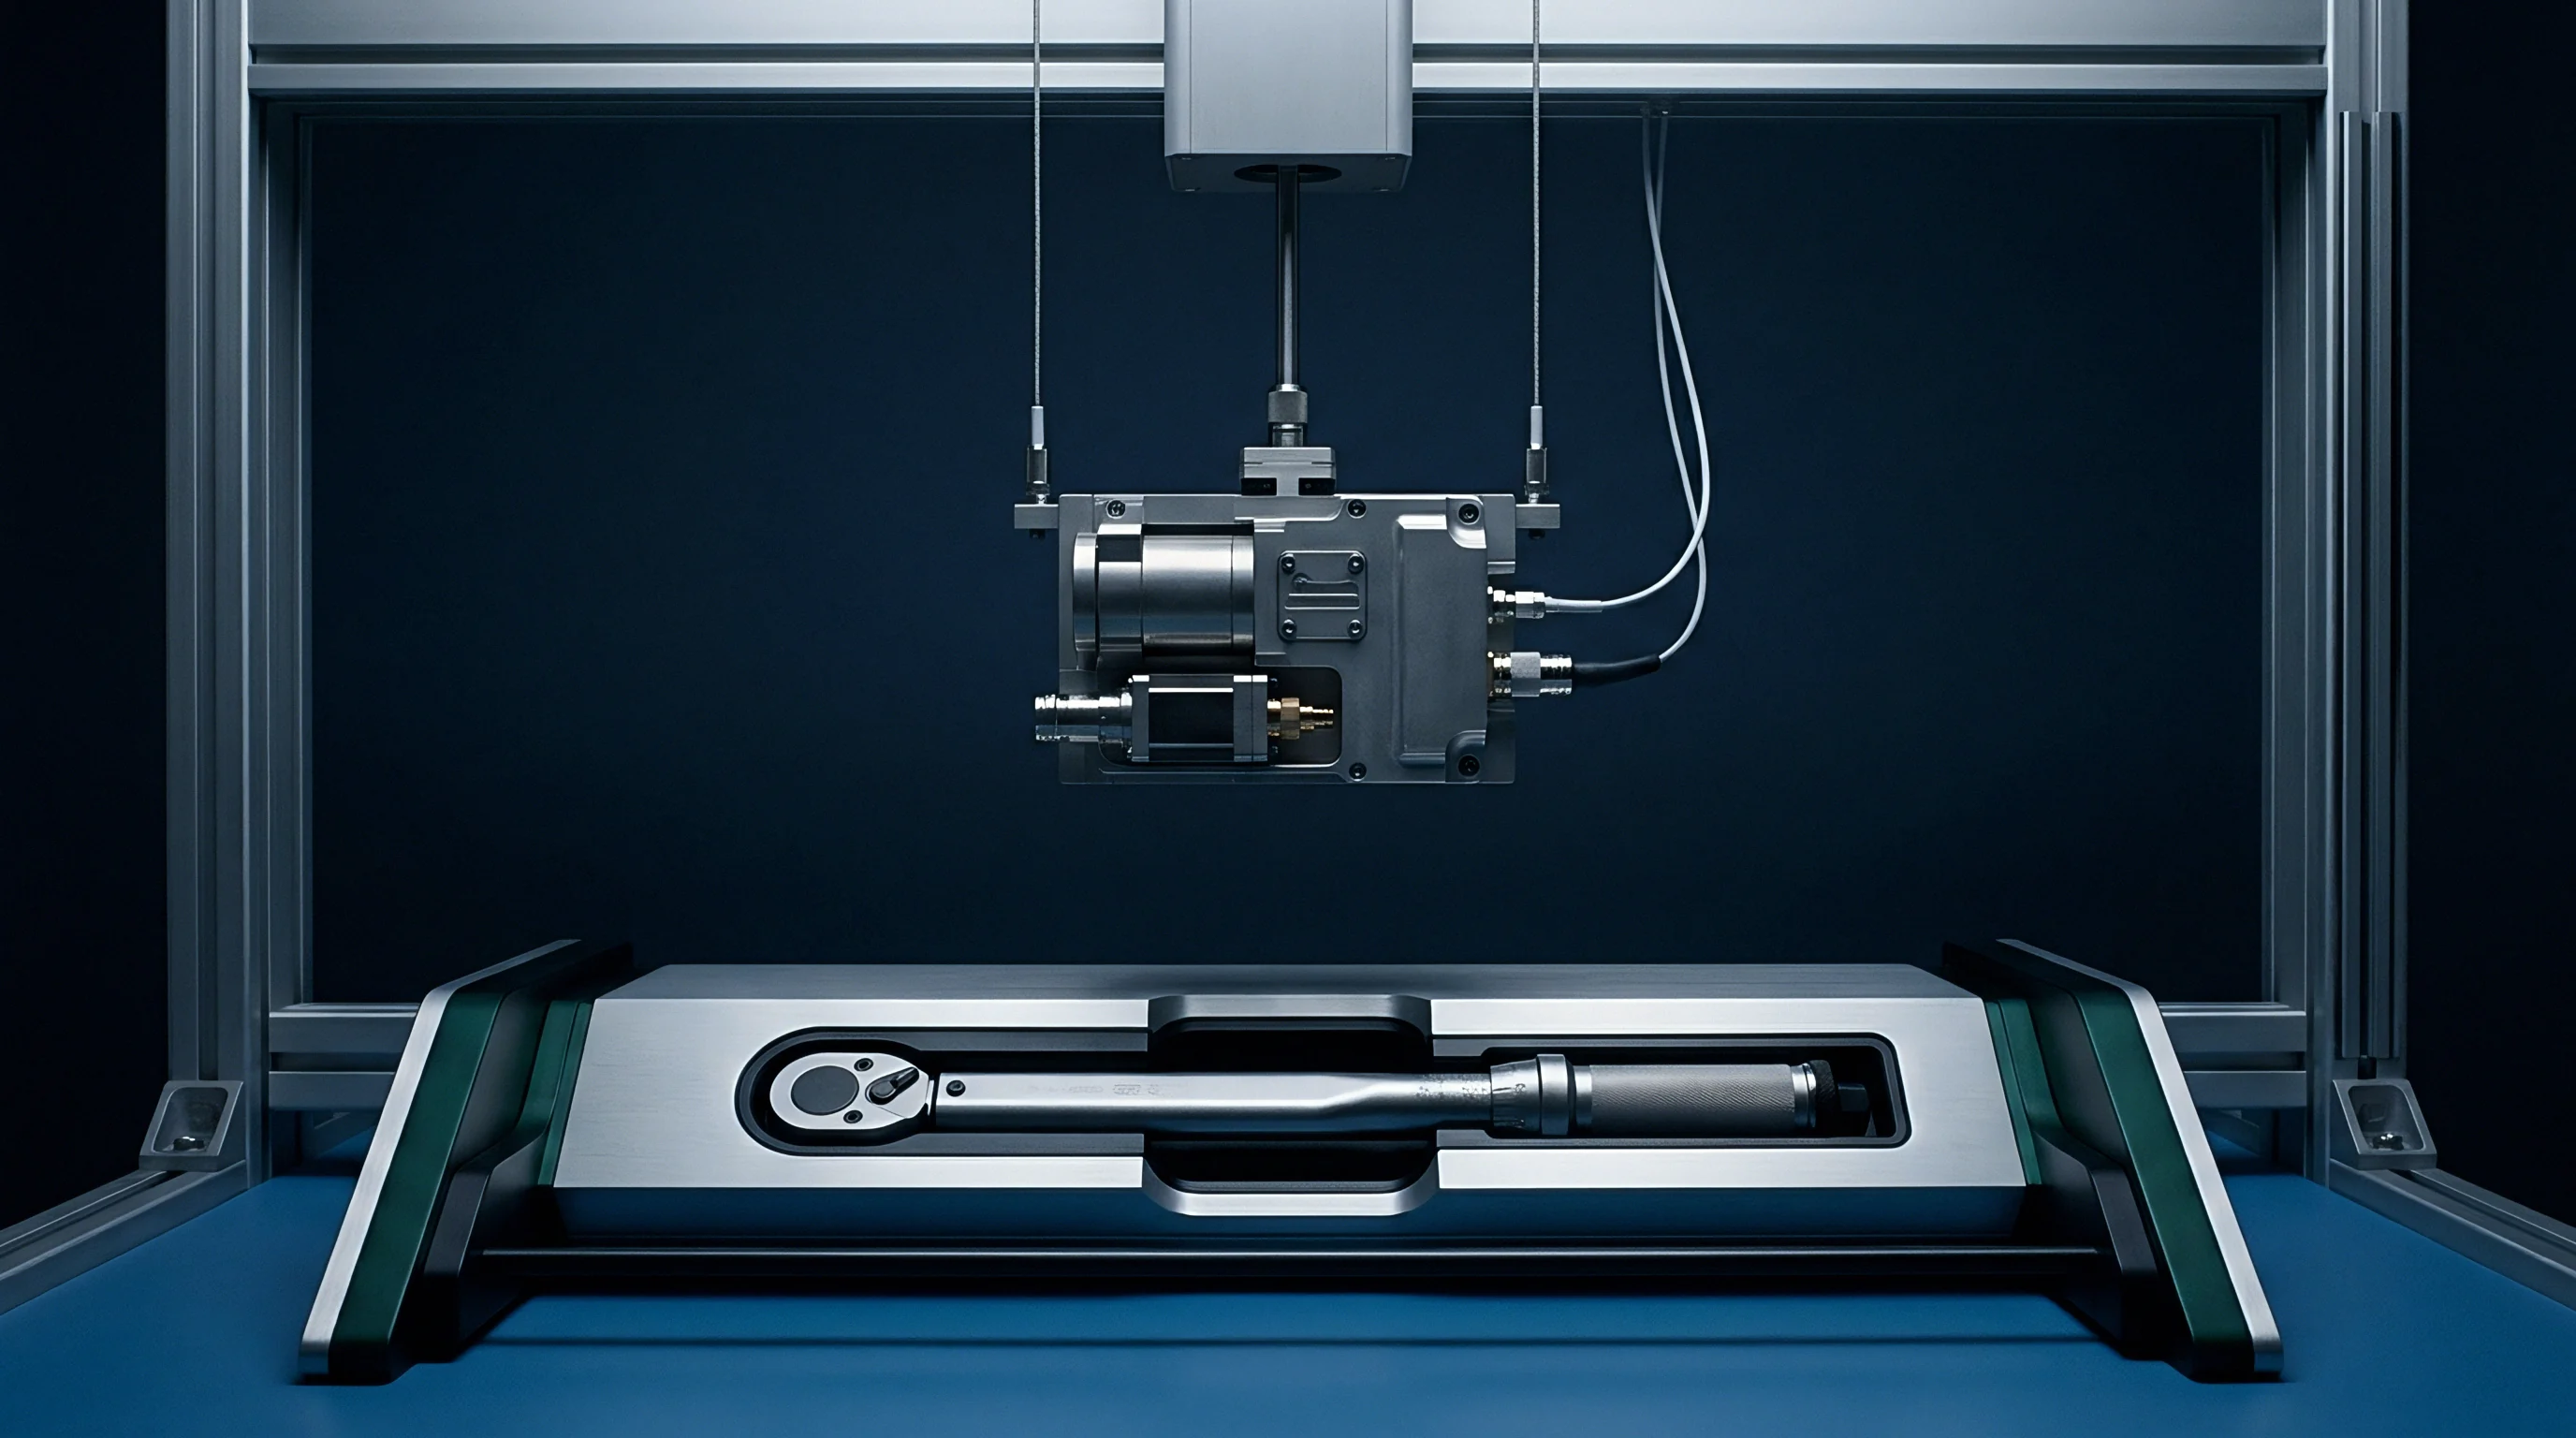
Cross Laboratory Calibration and Verification Sequence
Aligning test results across separate accredited facilities follows a structured validation procedure before accepting a retest report.
- Connect a precision reference comb generator to a calibrated omnidirectional radiator mounted at the center of the turntable.
- Record radiated emissions across three orthogonal planes from 30 MHz to 18 GHz using standard scan speeds and step sizes.
- Measure cable loss profiles across all system RF lines using a vector network analyzer to update real-time offset tables.
- Map site voltage standing wave ratio deviations across the quiet zone to identify localized reflection hot spots within the chamber volume.
Attenuators correct impedance mismatch issues. Inserting a high-quality 6 dB or 10 dB fixed attenuator directly at the receive antenna output terminal stabilizes the transmission line impedance, reducing measurement errors caused by antenna input reflection coefficients.
Test engineers often attribute unaccounted spectral peaks to sample component variance rather than examining chamber reflections or cable placement deviations.
Dispute
Regulators approach discrepant laboratory reports through distinct enforcement philosophies. Market surveillance retests conducted by national spectrum authorities apply legal criteria to evaluate whether a non-compliant measurement invalidates an existing market approval.

Does Market Surveillance Accept Shared Risk Decision Rules?
The European Union framework under the Radio Equipment Directive 2014/53/EU applies the principle of shared risk as defined in ETSI EG 203 330 and TR 100 028. Under shared risk, the measured value stands without deducting or adding the test laboratory uncertainty budget, provided the testing facility operates within standard maximum allowable uncertainty limits. If a manufacturer demonstrates a compliant test report from an accredited laboratory showing a radiated emission level 0.1 dB below the legal ceiling, market surveillance authorities accept the product as compliant during routine document reviews.
However, if a surveillance retest by an authority lab records a value exceeding the limit by 0.2 dB, the product risks enforcement action regardless of the retest laboratory measurement uncertainty.
| Jurisdiction | Governing Standard | Decision Rule Framework | Handling of Laboratory MU |
|---|---|---|---|
The Federal Communications Commission enforces absolute limits under Part 15 subparts C and E. Limits bind every regulatory grant. The FCC Office of Engineering and Technology does not extend tolerances for laboratory measurement uncertainty during market sampling audits. A device exceeding statutory radiated emission ceilings during an FCC surveillance scan faces immediate grant suspension or import blocks, leaving the manufacturer liable for commercial recall costs.
Subclause 5.2 of ISO/IEC 17025 specifies that when reporting statements of conformity, the laboratory must document the decision rule applied, taking into account the level of risk associated with the decision mechanism.

Margin
Engineers apply numerical buffers to measured test values to prevent market compliance failure. Accounting for multi-laboratory measurement uncertainty requires incorporating guardbands into initial product specification targets during design qualification.

Guardband Engineering and Risk Allocation
Designing custom radio hardware or integrating pre-certified modular transmitters without sufficient test headroom creates high commercial vulnerability. Guardbands protect commercial launch dates. A standard practice allocates a minimum 3 dB safety margin below statutory limits for conducted parameters and a 6 dB safety margin for radiated parameters during initial pre-compliance scans.
Maintaining a 6 dB design margin on radiated spurious emissions absorbs measurement variance between initial test labs and secondary surveillance facilities.
Margins decay near band edges. Steep filter skirts in Wi-Fi 6E, Bluetooth Low Energy, and cellular bands demand tight production tolerances. Thermal drift, component aging, and voltage ripple erode design buffers, leaving the final assembled product exposed during secondary market retests.
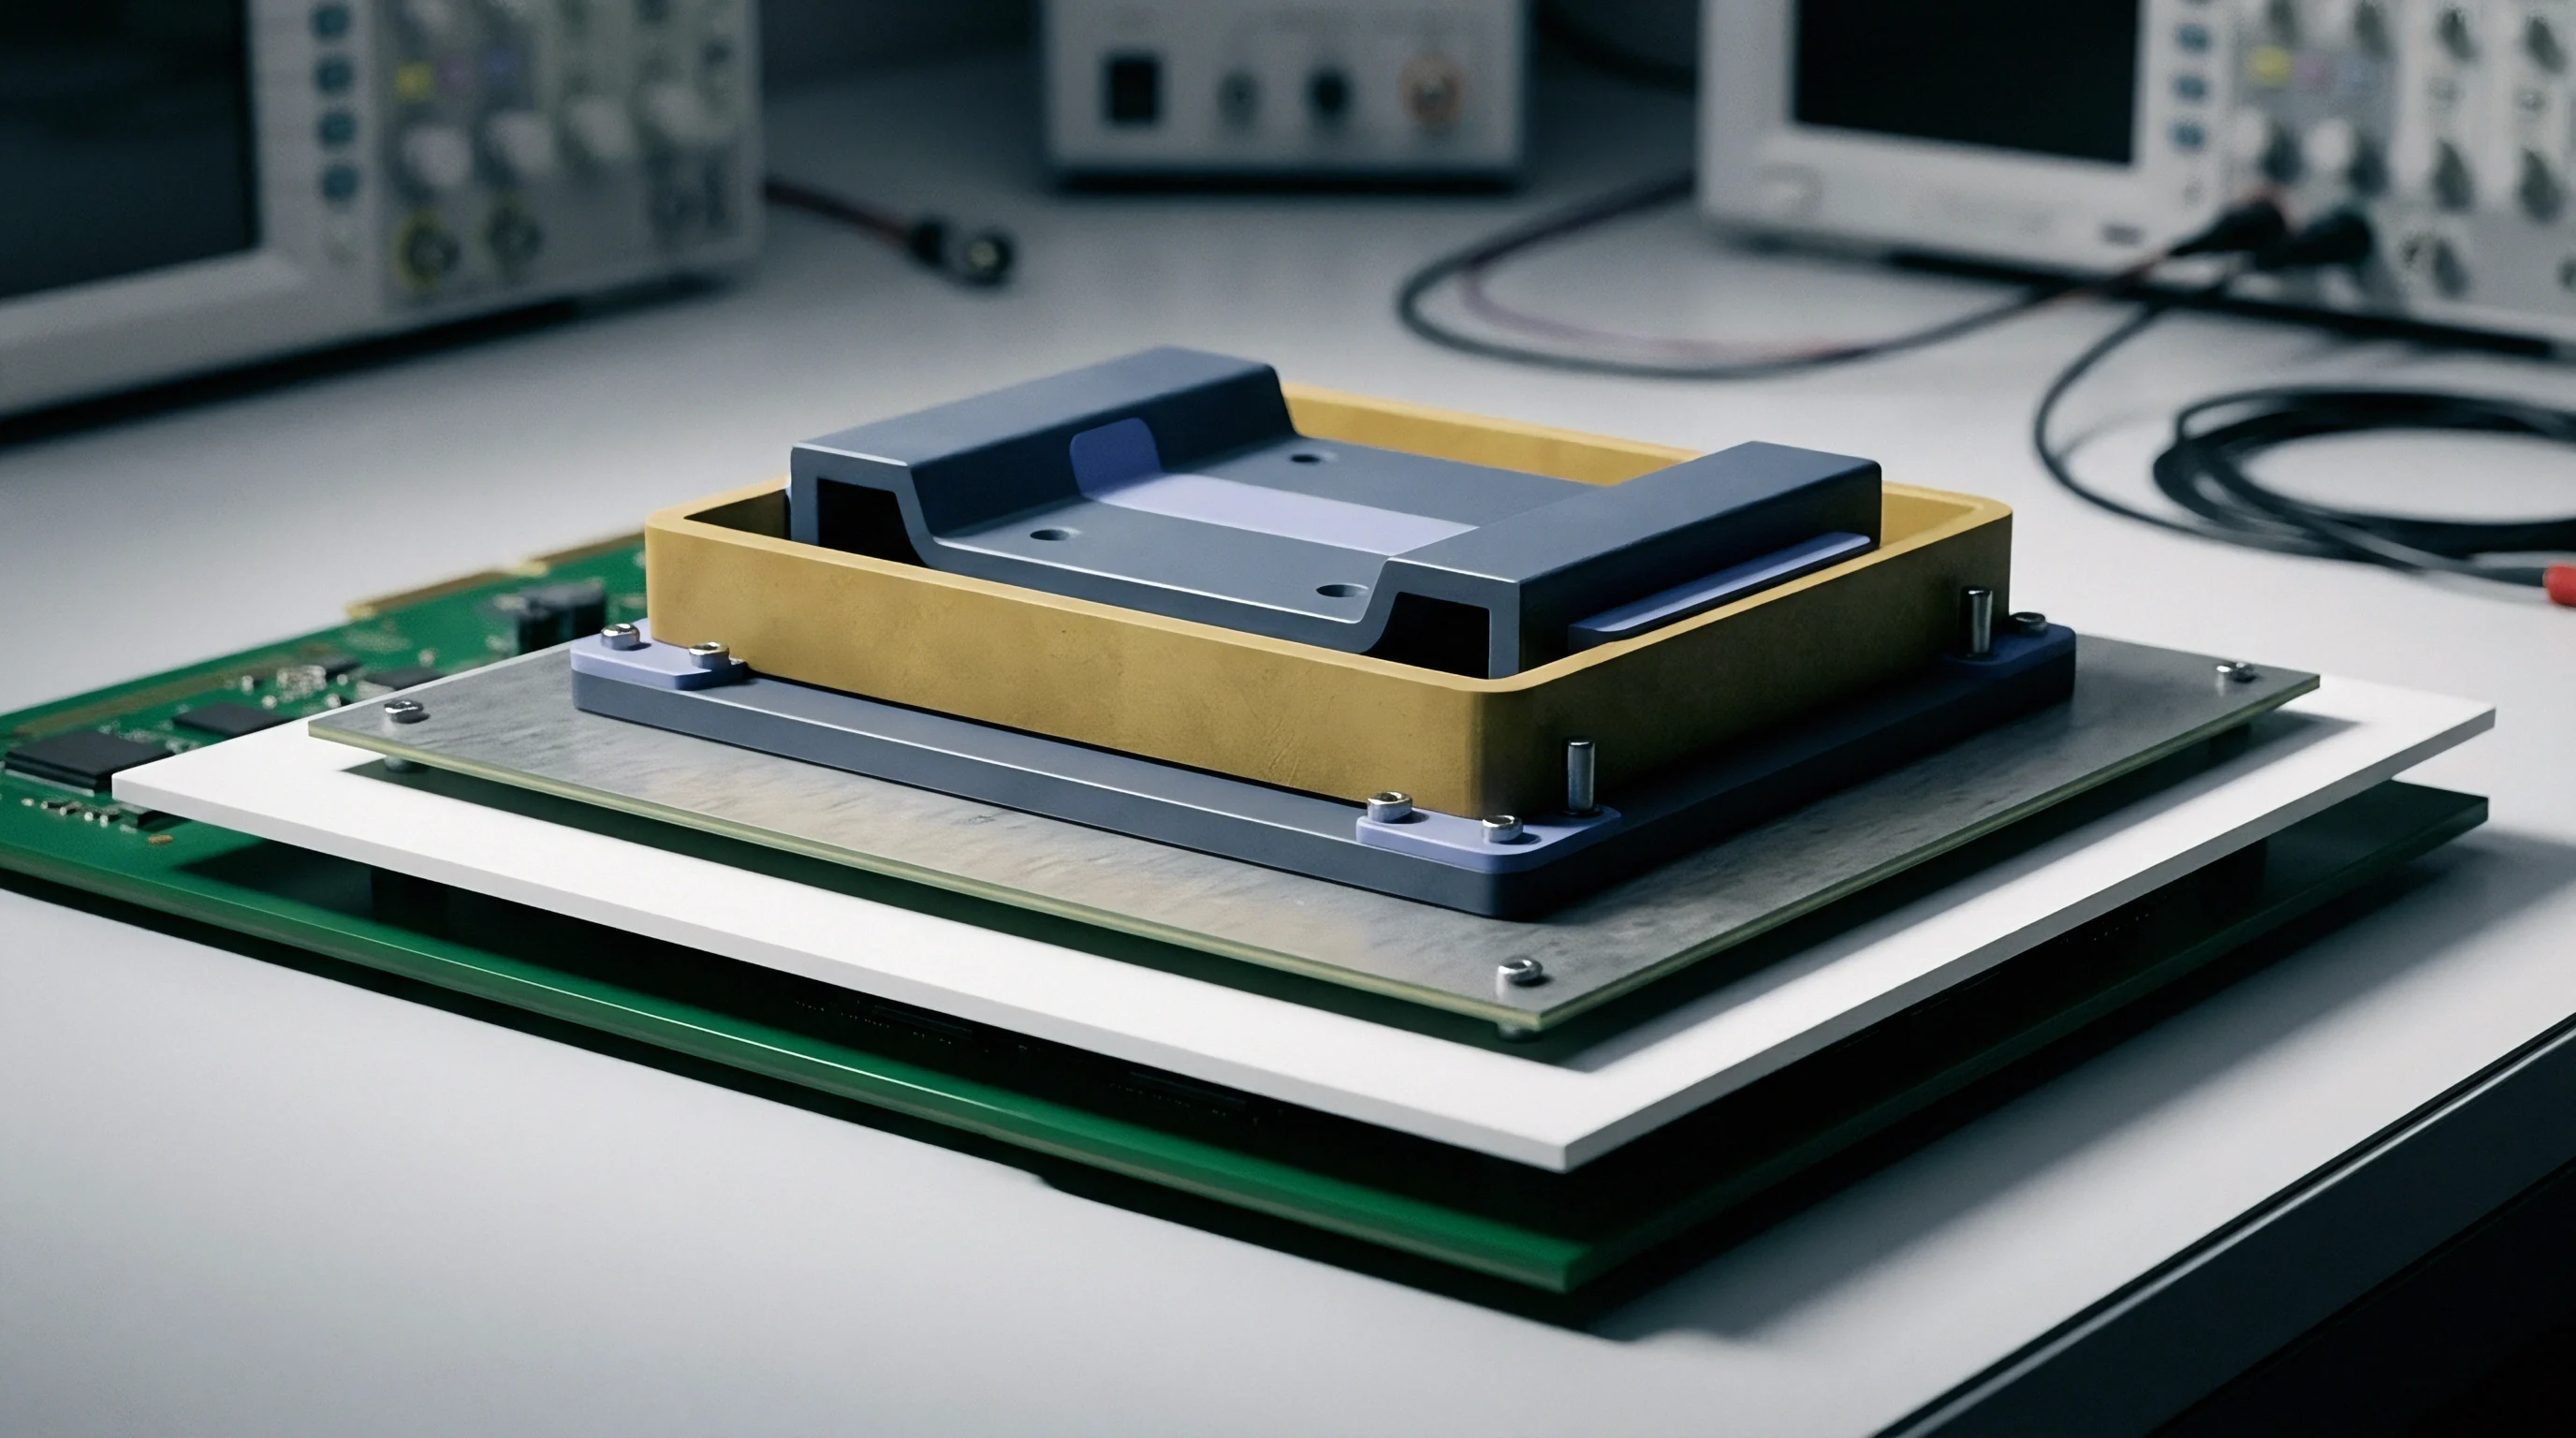
Worked Case Sensitivity of Measurement Uncertainty to Compliance Yield
Consider a 2.4 GHz radio module tested for radiated spurious emissions under ETSI EN 300 328. The legal limit for spurious emissions in the restricted band above 1 GHz stands at -30 dBm EIRP. Assume a production lot of 10,000 units exhibits a true physical emission distribution centered at -34 dBm with a manufacturing process standard deviation σm = 1.0 dB.
When evaluated at Laboratory A, which operates with an expanded measurement uncertainty UA = 3.0 dB (k=2, standard uncertainty uA = 1.5 dB), the total combined variance observed in the test results is:
σtotal, A2 = σm2 + uA2 = 1.02 + 1.52 = 3.25 dB2 σtotal, A = sqrt3.25 ≈ 1.80 dB
The distance from the mean (-34 dBm) to the legal ceiling (-30 dBm) is 4 dB. The Z-score for test failure at Laboratory A is calculated as:
ZA = frac-30 – (-34)1.80 = frac4.01.80 ≈ 2.22
This Z-score yields a statistical retest failure rate of approximately 1.32 percent (132 units out of 10,000 failing during initial screening).
If the same batch undergoes retesting at Laboratory B, where poor cable management and chamber reflections increase expanded measurement uncertainty to UB = 5.0 dB (k=2, standard uncertainty uB = 2.5 dB), the total observed standard deviation shifts:
σtotal, B2 = σm2 + uB2 = 1.02 + 2.52 = 7.25 dB2 σtotal, B = sqrt7.25 ≈ 2.69 dB
The Z-score for test failure at Laboratory B drops to:
ZB = frac-30 – (-34)2.69 = frac4.02.69 ≈ 1.49
A Z-score of 1.49 increases the statistical retest failure rate to 6.81 percent (681 units out of 10,000 failing). Discrepancies destroy shipping schedules. The broader uncertainty budget at Laboratory B increases product retest failure by over 500 percent on identical manufactured hardware.
| Mean Design Margin | Process Variation (σm) | Lab Expanded Uncertainty (Uexp) | Combined Standard Deviation | Calculated Retest Failure Rate |
|---|---|---|---|---|
| 2.0 dB | 1.0 dB | 3.0 dB (u = 1.5 dB) | 1.80 dB | 13.35 % |
| 2.0 dB | 1.0 dB | 5.0 dB (u = 2.5 dB) | 2.69 dB | 22.86 % |
| 4.0 dB | 1.0 dB | 3.0 dB (u = 1.5 dB) | 1.80 dB | 1.32 % |
| 4.0 dB | 1.0 dB | 5.0 dB (u = 2.5 dB) | 2.69 dB | 6.81 % |
| 6.0 dB | 1.0 dB | 3.0 dB (u = 1.5 dB) | 1.80 dB | 0.04 % |
| 6.0 dB | 1.0 dB | 5.0 dB (u = 2.5 dB) | 2.69 dB | 1.29 % |
Pre Compliance Margin Allocation Checklist
Deploying targeted design guardbands protects supply chain velocity across international market filings.
- Radiated spurious emissions buffer enforces a 6 dB design headroom below absolute regulatory ceilings across all harmonic frequencies.
- Band edge compliance allowance integrates a 4 dB margin on steep channel edges to absorb temperature-induced oscillator shifts.
- Conductive output power guardband maintains a 1.5 dB offset from maximum permitted grant limits to accommodate production factory calibration spread.
- Transient spurious burst allocation reserves a 5 dB safety window during burst transmitter power ramp-up cycles.
Failing to budget for laboratory measurement uncertainty during product layout causes unexpected retest failures, forced board re-spins, custom enclosure shielding additions, and multi-month customs holds at international borders.
Arbitration
Commercial agreements between product sponsors and accredited test facilities require explicit protocol definitions to resolve laboratory conflicts. Managing retest discrepancies involves structured technical audits rather than redundant commercial re-scans.
Contractual Frameworks for Cross Laboratory Retests
When secondary retest data contradicts an initial compliance report, technical teams perform a formal uncertainty budget reconciliation. The process requires exchanging raw calibration trace data, antenna factor tables, cable loss profiles, and exact chamber spatial coordinates for the non-compliant frequency points.
Comparing raw spectrum analyzer trace files alongside full antenna calibration data uncovers systematic measurement offset sources across facilities.
Sourcing practice engineers insert specific retest clauses into purchase contracts with foreign original design manufacturers and contract manufacturers. These clauses define the accredited reference laboratory whose measurement setup serves as the legal baseline if market surveillance or customs authorities challenge product compliance.
How can product teams establish legally binding reference standards across international testing facilities when national accreditation bodies evaluate measurement uncertainty budgets under different local interpretations?