Quartz Crystal Resonator Drive Level Dependency Physics Fundamentals
Drive level dependency arises from interfacial micro-slip and acoustic nonlinearity, spiking crystal resistance at low drive power and stalling radio oscillators.

Slip
Electrically driving an AT-cut quartz blank generates acoustic shear waves with displacement amplitudes tied to the applied power. Below one microwatt, acoustic losses are dominated by friction at the interface between the metal electrodes and the crystalline substrate. Microscopic asperities, localized dislocations, and chemical contaminants along the boundary between gold or silver thin films and the quartz surface cause wave amplitudes to decay quickly.
When displacements drop into the sub-nanometer range, contact points between metallization and substrate undergo partial slip instead of uniform elastic deformation. This micro-slip converts acoustic energy into heat, driving up equivalent series resistance in the effect known as drive level dependency.
Dissipation at the boundary layer scales inversely with acoustic displacement until mechanical acceleration grows strong enough to dislodge surface contaminants. Even after standard chemical etching, quartz blanks retain microscopic traces of polishing slurry, ambient hydrocarbons, and trace moisture within surface micro-cracks. Above fifty microwatts, large mechanical accelerations overcome surface van der Waals forces so the quartz surface vibrates freely without localized sticking.
At sub-microwatt excitation levels, however, these contact zones remain intact, dumping the kinetic energy of the thickness-shear mode into thermal dissipation at individual asperities.
Tribological contact forces between metallic electrodes and raw quartz govern mechanical dissipation when displacement amplitudes contract to atomic dimensions.
Interfacial Contact Shear under Microscale Excitation
Across normal drive levels, displacement amplitudes in high-frequency thickness-shear resonators range from 0.1 nanometers to 5 nanometers. Atomic force microscopy shows peak-to-valley surface roughness between 2 nanometers and 10 nanometers across the central active area of the quartz plate. Under weak electric field gradients, the shear stress developed across the piezoelectric boundary fails to shear through contaminant film monolayers, leaving boundary friction to damp the bulk acoustic wave.
Micro-slip mechanics dictate the acoustic quality factor of the vibrating volume. As the driving voltage applied across an inverted mesa or flat blank decreases, mechanical strain diminishes alongside it. The shear strain distribution across the plate profile follows a Gaussian envelope shaped by electrode beveling and contouring, while energy trapping holds the fundamental acoustic mode beneath the metallized region.
Uneven electrode adhesion creates localized stress concentrations along electrode edges, magnifying mechanical damping as the resonator moves from rest into active oscillation.
Several physical interactions within the resonator assembly contribute to frictional losses:
- Interfacial metallization adhesion defects create localized zones where thin-film electrodes partially detach under cyclic shear, introducing dry friction losses at microscopic contact interfaces.
- Organic molecular contamination layers undergo viscous shear deformation beneath the metal film, converting acoustic energy into molecular relaxation losses at minimal displacement amplitudes.
- Mounting adhesive viscoelastic creep transfers mechanical clamping stresses into the active blank center, shifting the local acoustic velocity profile when drive current fluctuates.
- Residual abrasive particulate trapping pins acoustic shear wavefronts against polishing scratches, generating localized damping sites that vanish under higher mechanical excitation power.

Contaminant Scrubbing across Active Piezoelectric Areas
Acoustic energy clears surface contamination when vibration velocity exceeds a critical threshold, sweeping particulate matter out of primary acoustic paths through scrubbing action. This phenomenon explains why crystals often show normal impedance after exposure to high drive levels, yet fail when tested cold under minimal bias. Once high-amplitude motion displaces moisture films or loose metallization flecks, contact asperities seat into stable positions, allowing the resonator to pass brief bench characterization tests.
Thermal storage or mechanical shock disrupts those settled positions. Over periods of inactive storage, mobile chemical species and moisture redeposit across the active electrode zone. When a low-amplitude excitation cycle is subsequently applied, it encounters undisturbed contaminant damping that drives equivalent series resistance past receiver circuit startup thresholds.
Radios deployed in remote field environments experience wake-up failures when microcontrollers attempt cold oscillator restarts from ultra-low-power sleep states.
Nonlinearity
Under finite strain amplitudes, quartz material properties exhibit measurable departures from linear elastic laws. Crystalline silicon dioxide belongs to trigonal crystal class 32, which carries non-zero third-order and fourth-order elastic stiffness coefficients. As acoustic shear stresses propagate through the quartz matrix, these higher-order constants induce an amplitude-dependent frequency pulling effect that couples operational frequency directly to mechanical power dissipated inside the resonator.
Anharmonic potential wells govern interatomic forces between silicon and oxygen atoms within the quartz lattice. Under elevated excitation currents, mechanical strain approaches levels near 10 raised to the power of negative five. At these strain amplitudes, quadratic and cubic terms in the stress-strain equations contribute measurably to restoring forces, causing mechanical motion to mirror a classical Duffing oscillator that shifts resonance frequency and distorts the symmetric Butterworth-van Dyke admittance circle.

Anharmonic Elastic Potentials in Thickness Shear
Third-order elastic stiffness coefficients govern the nonlinear frequency shift observed in AT-cut crystal plates: the primary coefficient c111, alongside cross-coupling terms c112 and c124, introduces stress-dependent elasticity. For AT-cut plates oriented at approximately 35 degrees and 15 minutes from the crystallographic Z-axis, the amplitude-frequency coefficient exhibits a positive sign, causing resonance frequency to rise as drive power increases. The frequency shift follows a quadratic relationship relative to the vibrating current passing through the motional arm.
Mechanical stress alters lattice spacing, modifying the acoustic wave propagation velocity inside the plate. Fundamental resonance frequency derives from acoustic velocity divided by twice the effective plate thickness. Because acoustic velocity tracks higher-order elastic stiffness terms, mechanical acceleration across the active plate volume creates an amplitude-dependent velocity gradient.
At drive levels exceeding 200 microwatts, this spatial velocity gradient causes localized phase mismatches across electrode boundaries, inducing higher-order acoustic mode coupling and degrading spectral purity.

Frequency Jumps Governed by Duffing Mechanics
Duffing-type nonlinear restoring forces bend the admittance curve toward higher frequencies, introducing multi-valued response regions and amplitude hysteresis. Sweeping drive frequency upward past motional resonance produces an abrupt downward step in admittance once the trajectory reaches the saddle-node bifurcation boundary. Sweeping downward traces a separate trajectory, delaying the transition until a lower bifurcation point.
This hysteresis loop compromises automatic frequency control loops in high-speed radio transceivers.
Selecting an operating point along this bifurcated curve fixes the reference clock frequency while sharply elevating phase noise. When transceivers step internal oscillator amplifiers through variable-gain modes to trim battery drain, the instantaneous shift in drive power pulls the reference frequency by several parts per million. Channel center frequencies within narrow-band protocols shift off-grid, provoking sudden packet demodulation failures at the receiver.
The exact interaction between internal blank stress, mounting geometry, and Duffing hysteresis under transient temperature ramps remains an open physical question.
Resistance
Motional loss parameters within the Butterworth-van Dyke model vary continuously as drive power sweeps across four decades of magnitude. The lumped element equivalent circuit contains motional inductance L1, motional capacitance C1, shunt capacitance C0, and motional resistance R1. Among these parameters, motional resistance R1 exhibits the highest sensitivity to excitation power.
High-reliability radio transceivers demand stable motional parameters to maintain phase lock and guarantee oscillation startup across thermal excursions.
Batch production measurements reveal distinct behavioral regimes for motional resistance. At excitation levels between 10 microwatts and 100 microwatts, R1 stabilizes near its nominal design value, representing pure acoustic damping and bulk material dissipation. Lowering drive power below five microwatts exposes drive level dependency, causing R1 to climb steeply in defective or contaminated blanks.
Conversely, excitation levels approaching one milliwatt introduce thermal dissipation spikes and mechanical stress degradation.
Drive level sweeps conducted from 0.01 microwatts to 200 microwatts under IEC 60444-6 reveal equivalent series resistance variations exceeding 300 percent in contaminated blanks.
Can Low Drive Levels Induce Sleeping Sickness?
Electromechanical coupling failures occurring exclusively at sub-microwatt drive levels carry the historical trade designation of sleeping sickness. When a crystal sits unpowered for extended periods, particulate contamination and moisture settle across the blank surface, making initial motional resistance upon application of a weak bias voltage measure substantially higher than nominal specifications. If the negative resistance of the oscillator circuit fails to overcome this elevated initial resistance, oscillation cannot initiate.
A temporary electrical transient can clear startup failures instantly: applying a high-amplitude voltage pulse generates sufficient mechanical shear force to dislodge particulate contact zones, returning motional resistance to nominal values. Standard factory automated test equipment often applies fixed 100-microwatt drive levels during production testing, completely bypassing the low-drive regime where sleeping sickness resides. Units passed by factory test protocols fail later inside battery-powered transceivers whose sleep clock circuits deliver less than 0.5 microwatts to the crystal blank.
| Drive Level (uW) | Nominal Blank R1 (Ohm) | Defective Blank R1 (Ohm) | Frequency Shift (ppm) | Equivalent Current (mA RMS) |
|---|---|---|---|---|
| 0.01 | 28.4 | 184.2 | -0.12 | 0.019 |
| 0.10 | 26.1 | 142.6 | -0.08 | 0.062 |
| 1.00 | 24.3 | 88.5 | -0.02 | 0.203 |
| 10.0 | 23.8 | 35.1 | +0.05 | 0.648 |
| 50.0 | 23.5 | 24.2 | +0.28 | 1.458 |
| 100.0 | 23.6 | 23.8 | +0.65 | 2.058 |
| 250.0 | 24.1 | 24.4 | +1.82 | 3.220 |
| 500.0 | 25.8 | 26.1 | +4.15 | 4.402 |
Equivalent Parameter Spikes across Excitation Sweeps
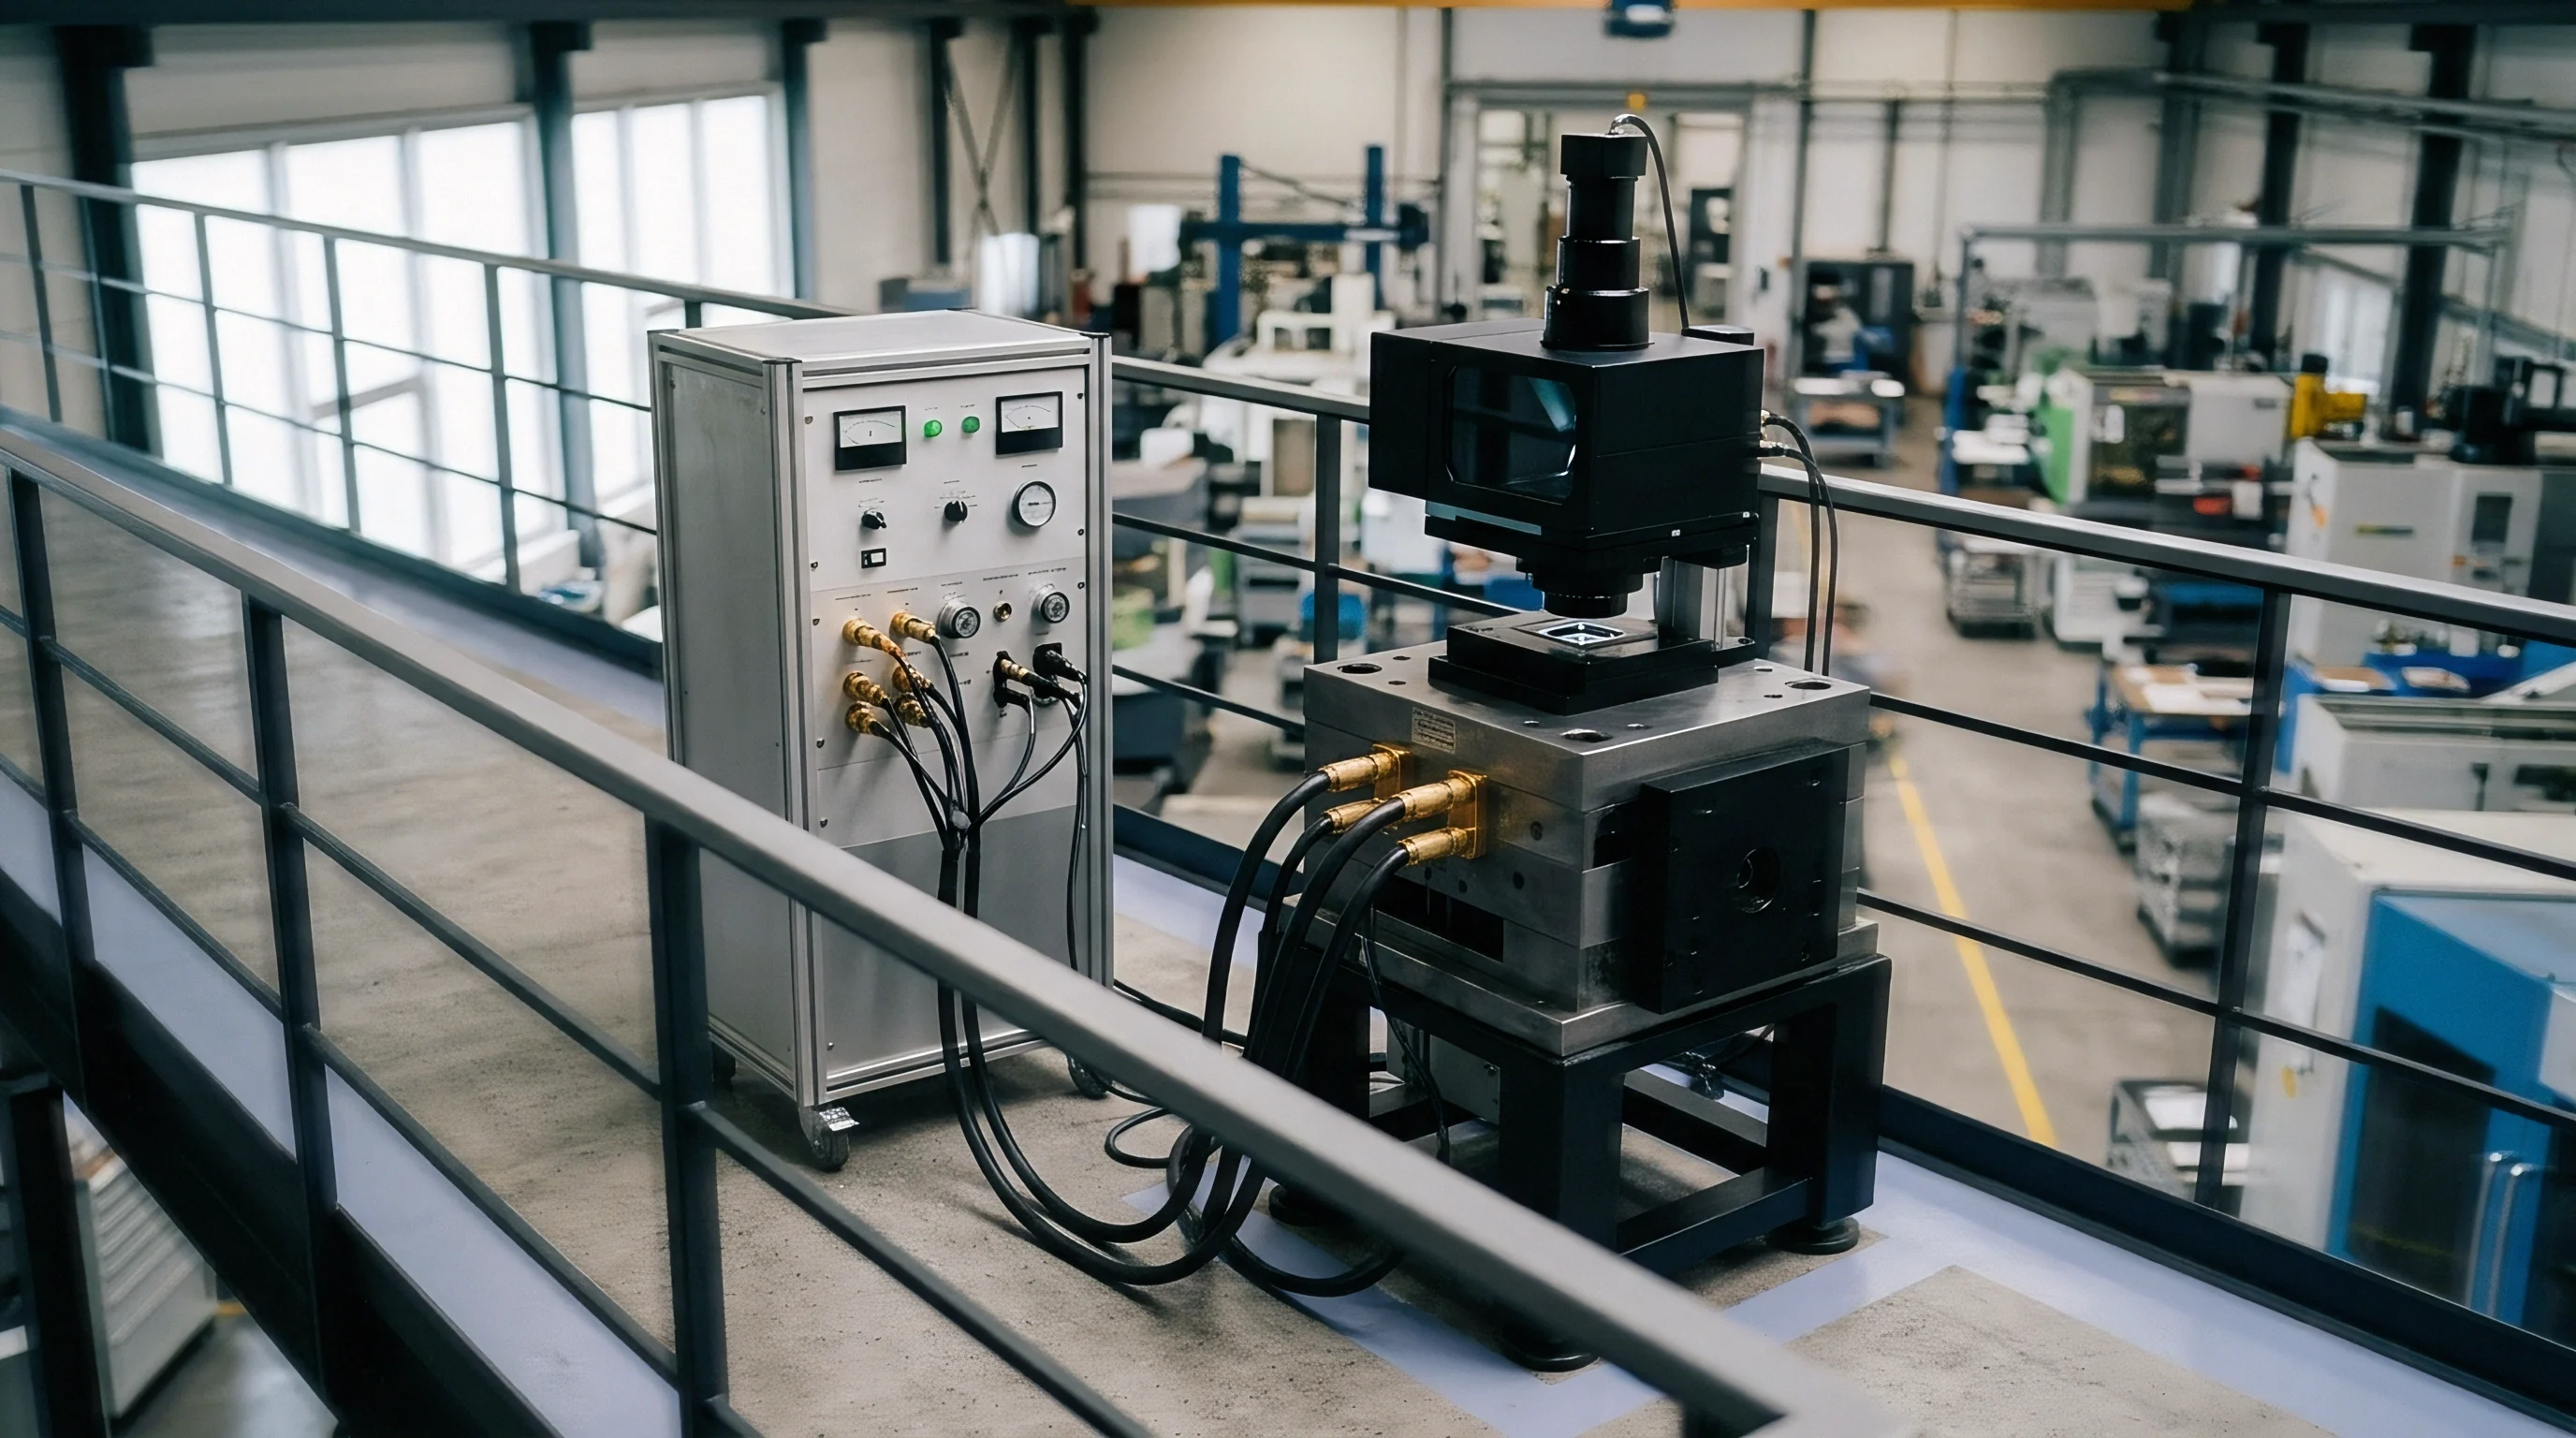
Characterizing crystal resonators across broad excitation ranges requires automated measurement routines capable of resolving microvolt signal levels. Standard network analyzer reflection methods fail at nanowatt powers due to thermal noise floors. Specialized transmission fixtures configured per IEC 60444-6 utilize calibrated step attenuators and low-noise preamplifiers to execute continuous multi-level sweeps.
Rigorous characterization follows a strict measurement progression designed to capture transient damping behavior:
- Mount the crystal unit inside a passive pi-network test fixture offering verified fifty-ohm source and load terminations.
- Cool the test chamber to the minimum specified operating temperature to freeze surface contaminants and maximize mechanical boundary viscosity.
- Apply the lowest drive power step of 0.01 microwatts and capture the admittance spectrum without applying preliminary high-power excitation signals.
- Step the excitation power upward logarithmically through thirty discrete points terminating at the maximum rated drive level of 200 microwatts.
- Reverse the sweep direction immediately, capturing downward points to quantify mechanical hysteresis and determine whether high drive power cleared boundary damping.
Drive level dependency is sometimes treated as a manageable circuit phenomenon resolved by increasing oscillator inverter bias, though higher bias cannot clear underlying mechanical defects.
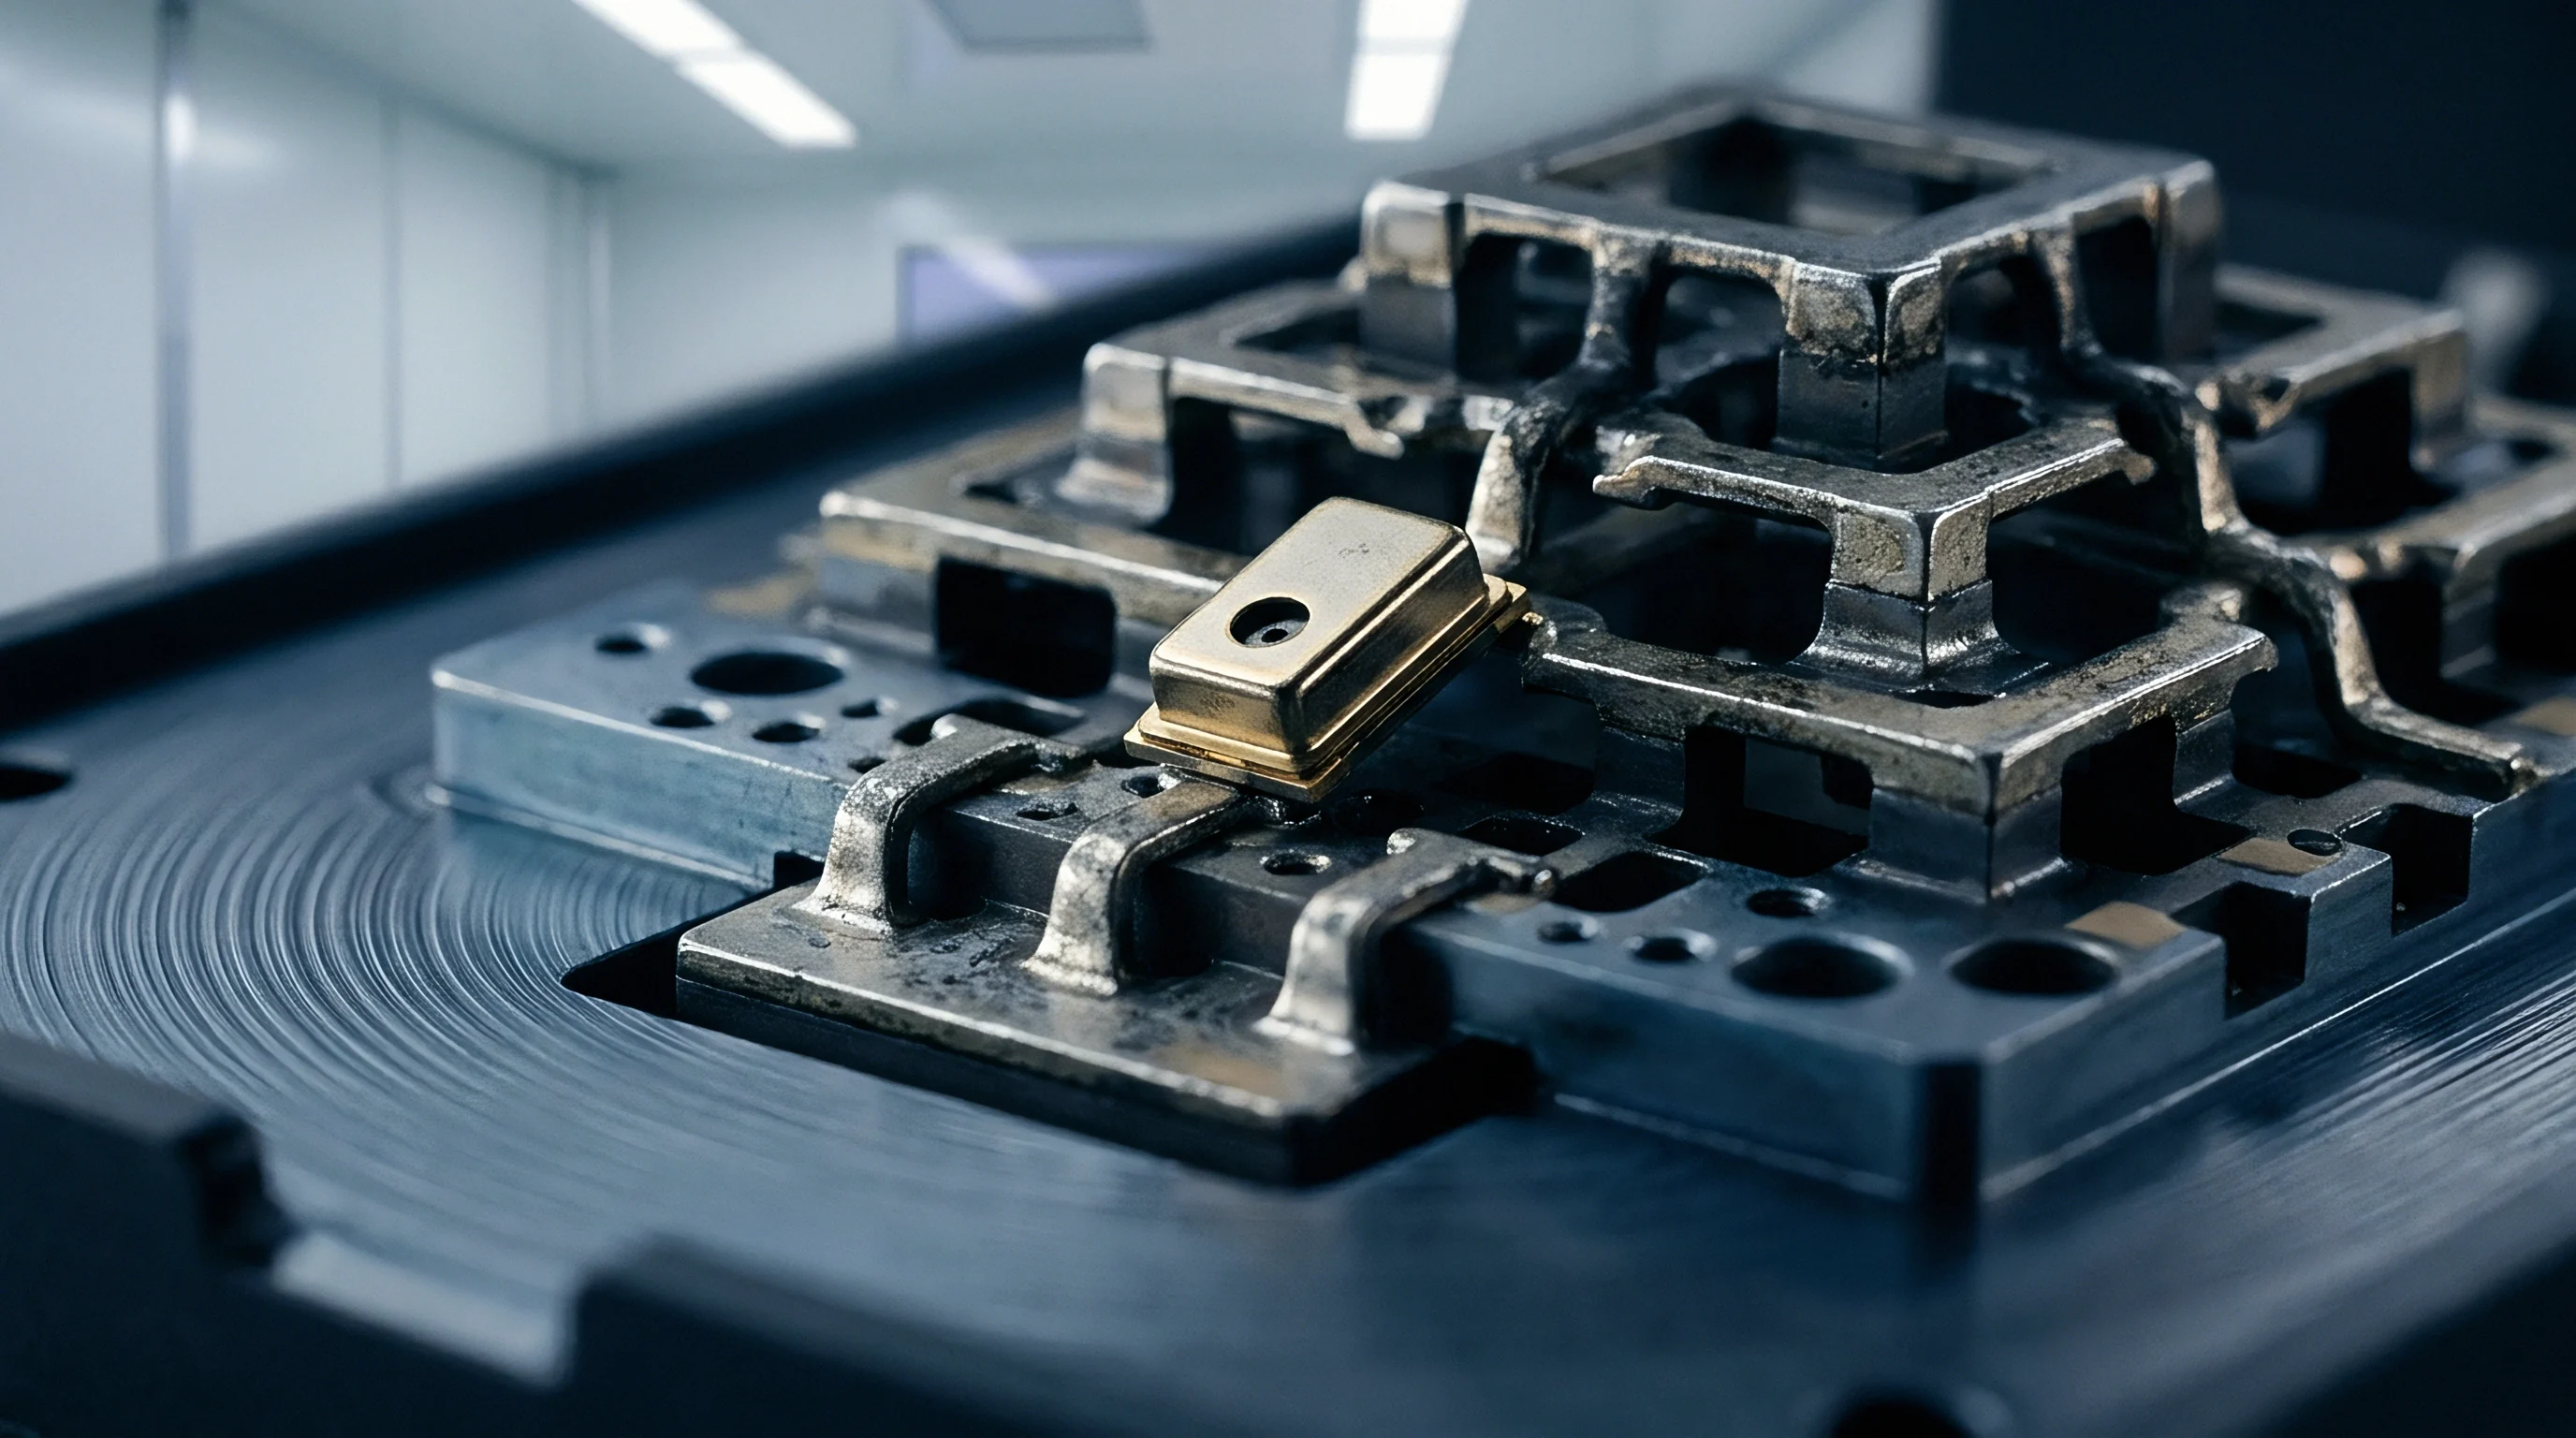

Oscillator
Transceiver sleep states prioritize current conservation to extend battery lifespans toward multi-year targets. Silicon designers achieve microamp-level quiescent currents by throttling internal inverter transconductance within Pierce oscillator stages. Modern sub-GHz and 2.4 GHz systems utilize 32.768 kHz tuning forks for sleep timing and high-frequency reference crystals between 24 MHz and 52 MHz for radio frequency synthesis.
Constraining inverter current limits the negative resistance delivered by the active circuit, degrading the gain margin available to start the clock.
Pierce oscillator architectures balance gain against internal power dissipation through feedback capacitors C1 and C2. The active inverter provides negative real impedance, expressed as negative transconductance divided by the product of operating frequency squared and load capacitances. Stable oscillation requires this negative resistance to exceed equivalent series resistance by a factor known as the oscillation allowance.
When drive level dependency spikes equivalent series resistance at cold startup, loop gain drops below unity, preventing the regeneration of ambient thermal noise into a sustained sinusoidal waveform.
Oscillator circuits provide reliable startup when negative resistance exceeds five times the maximum low-drive motional resistance across all thermal operating limits.
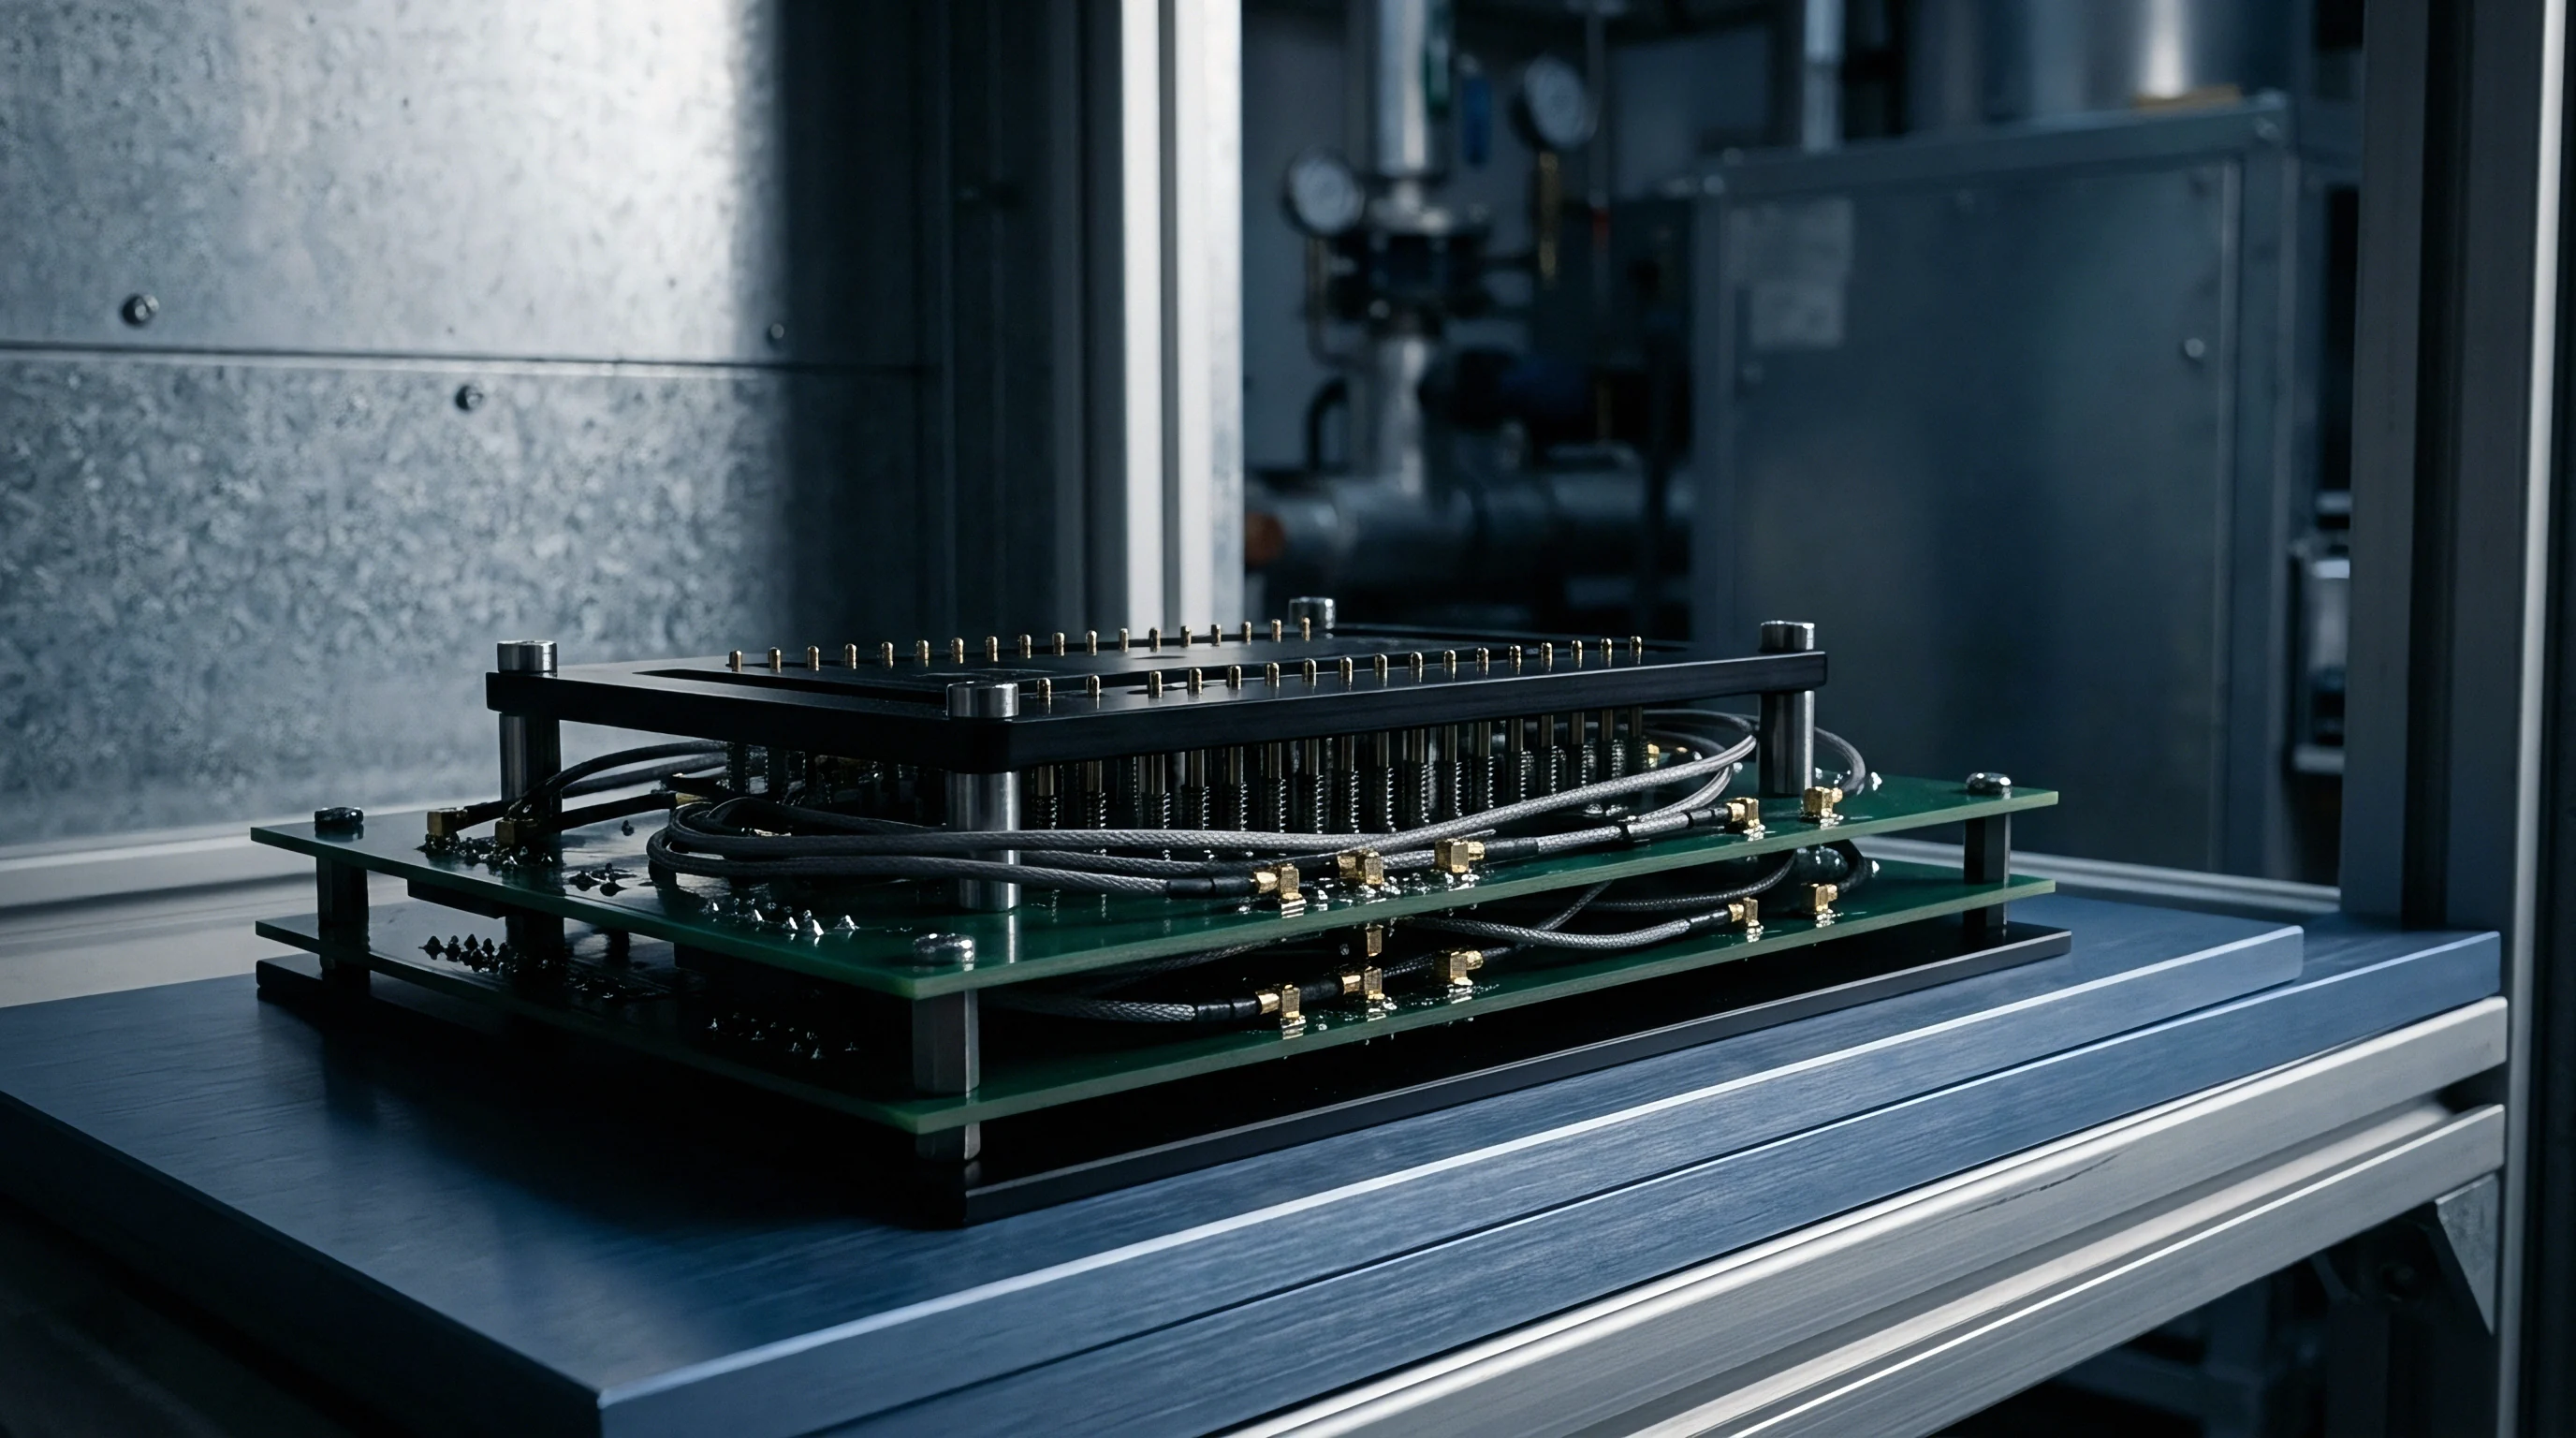
Negative Transconductance Collapse at Low Voltages
Transceiver supply rails often decay over operating lifetimes as primary cell chemistries deplete. Lithium manganese dioxide and lithium thionyl chloride cells exhibit voltage drops under heavy pulse discharge or sub-zero ambient temperatures. When internal core regulators drop from 1.2 volts to 0.9 volts, the transconductance of complementary metal-oxide-semiconductor inverters falls nonlinearly, shrinking the negative resistance generated across crystal pins simultaneously.
Degrading loop gain through current starvation amplifies minor component variations. If a crystal displays negligible drive level dependency at room temperature, its motional resistance remains within datasheet thresholds. Exposure to -40 degrees Celsius combined with low excitation voltages causes defective crystal blanks to exhibit motional resistances exceeding 150 ohms.
Startup time expands tenfold. If transconductance falls below the critical threshold during this window, the oscillator stalls completely, hanging the microcontroller core in a continuous reset loop.
| Transceiver Category | Reference Frequency (MHz) | Typical Drive Level (uW) | Negative Resistance (-Ohm) | Max Allowable R1 (Ohm) | Target Margin Ratio |
|---|---|---|---|---|---|
| BLE Single-Chip SoC | 32.000 | 15 to 40 | 350 | 40 | 8.75 |
| Sub-GHz LoRa Transceiver | 32.000 | 20 to 60 | 420 | 50 | 8.40 |
| Cellular NB-IoT Module | 26.000 / 38.400 | 50 to 120 | 280 | 35 | 8.00 |
| Ultra-Low-Power Sleep Clock | 0.032768 | 0.1 to 0.5 | 150,000 | 50,000 | 3.00 |
| Direct-Drive RF Synthesizer | 52.000 | 30 to 80 | 220 | 30 | 7.33 |
Does Negative Resistance Margin Mask Crystal Defects?
High loop gain overcomes initial motional resistance spikes through brute mechanical acceleration. A robust inverter stage delivering five hundred ohms of negative resistance easily starts an AT-cut crystal displaying an anomalous resistance peak of one hundred ohms. This rapid startup conceals serious manufacturing defects inside the crystal package: physical contamination causing the resistance anomaly remains trapped beneath the hermetic seal, mobile under vibration and thermal cycling.
Field failures emerge months after initial deployment as repeated temperature transitions cause contaminants to migrate across the active electrode zone. When microcontrollers execute fast wake-up sequences, firmware timers establish rigid deadlines for clock stabilization, typically allocating between 200 microseconds and one millisecond. As contaminant redistribution exacerbates drive level dependency, startup latency drifts beyond firmware timeout limits, triggering watchdog resets and premature battery exhaustion.
Oscillator loops operating close to critical startup margins require specific design verifications:
- Tri-temperature negative resistance mapping establishes whether inverter transconductance remains sufficient across extreme thermal boundaries.
- External series resistance substitution testing identifies the precise point of loop gain collapse by inserting discrete non-inductive resistors in series with the crystal blank.
- Supply voltage sensitivity sweeping tracks the decay of negative resistance as the power source drops toward cut-off thresholds.
- Start-up waveform envelope analysis flags abnormal amplitude plateaus or frequency hesitations indicative of localized motional resistance anomalies.
A crystal exhibiting steep drive level variations will eventually find an operating corner where negative resistance fails to overcome mechanical losses.
Dossier
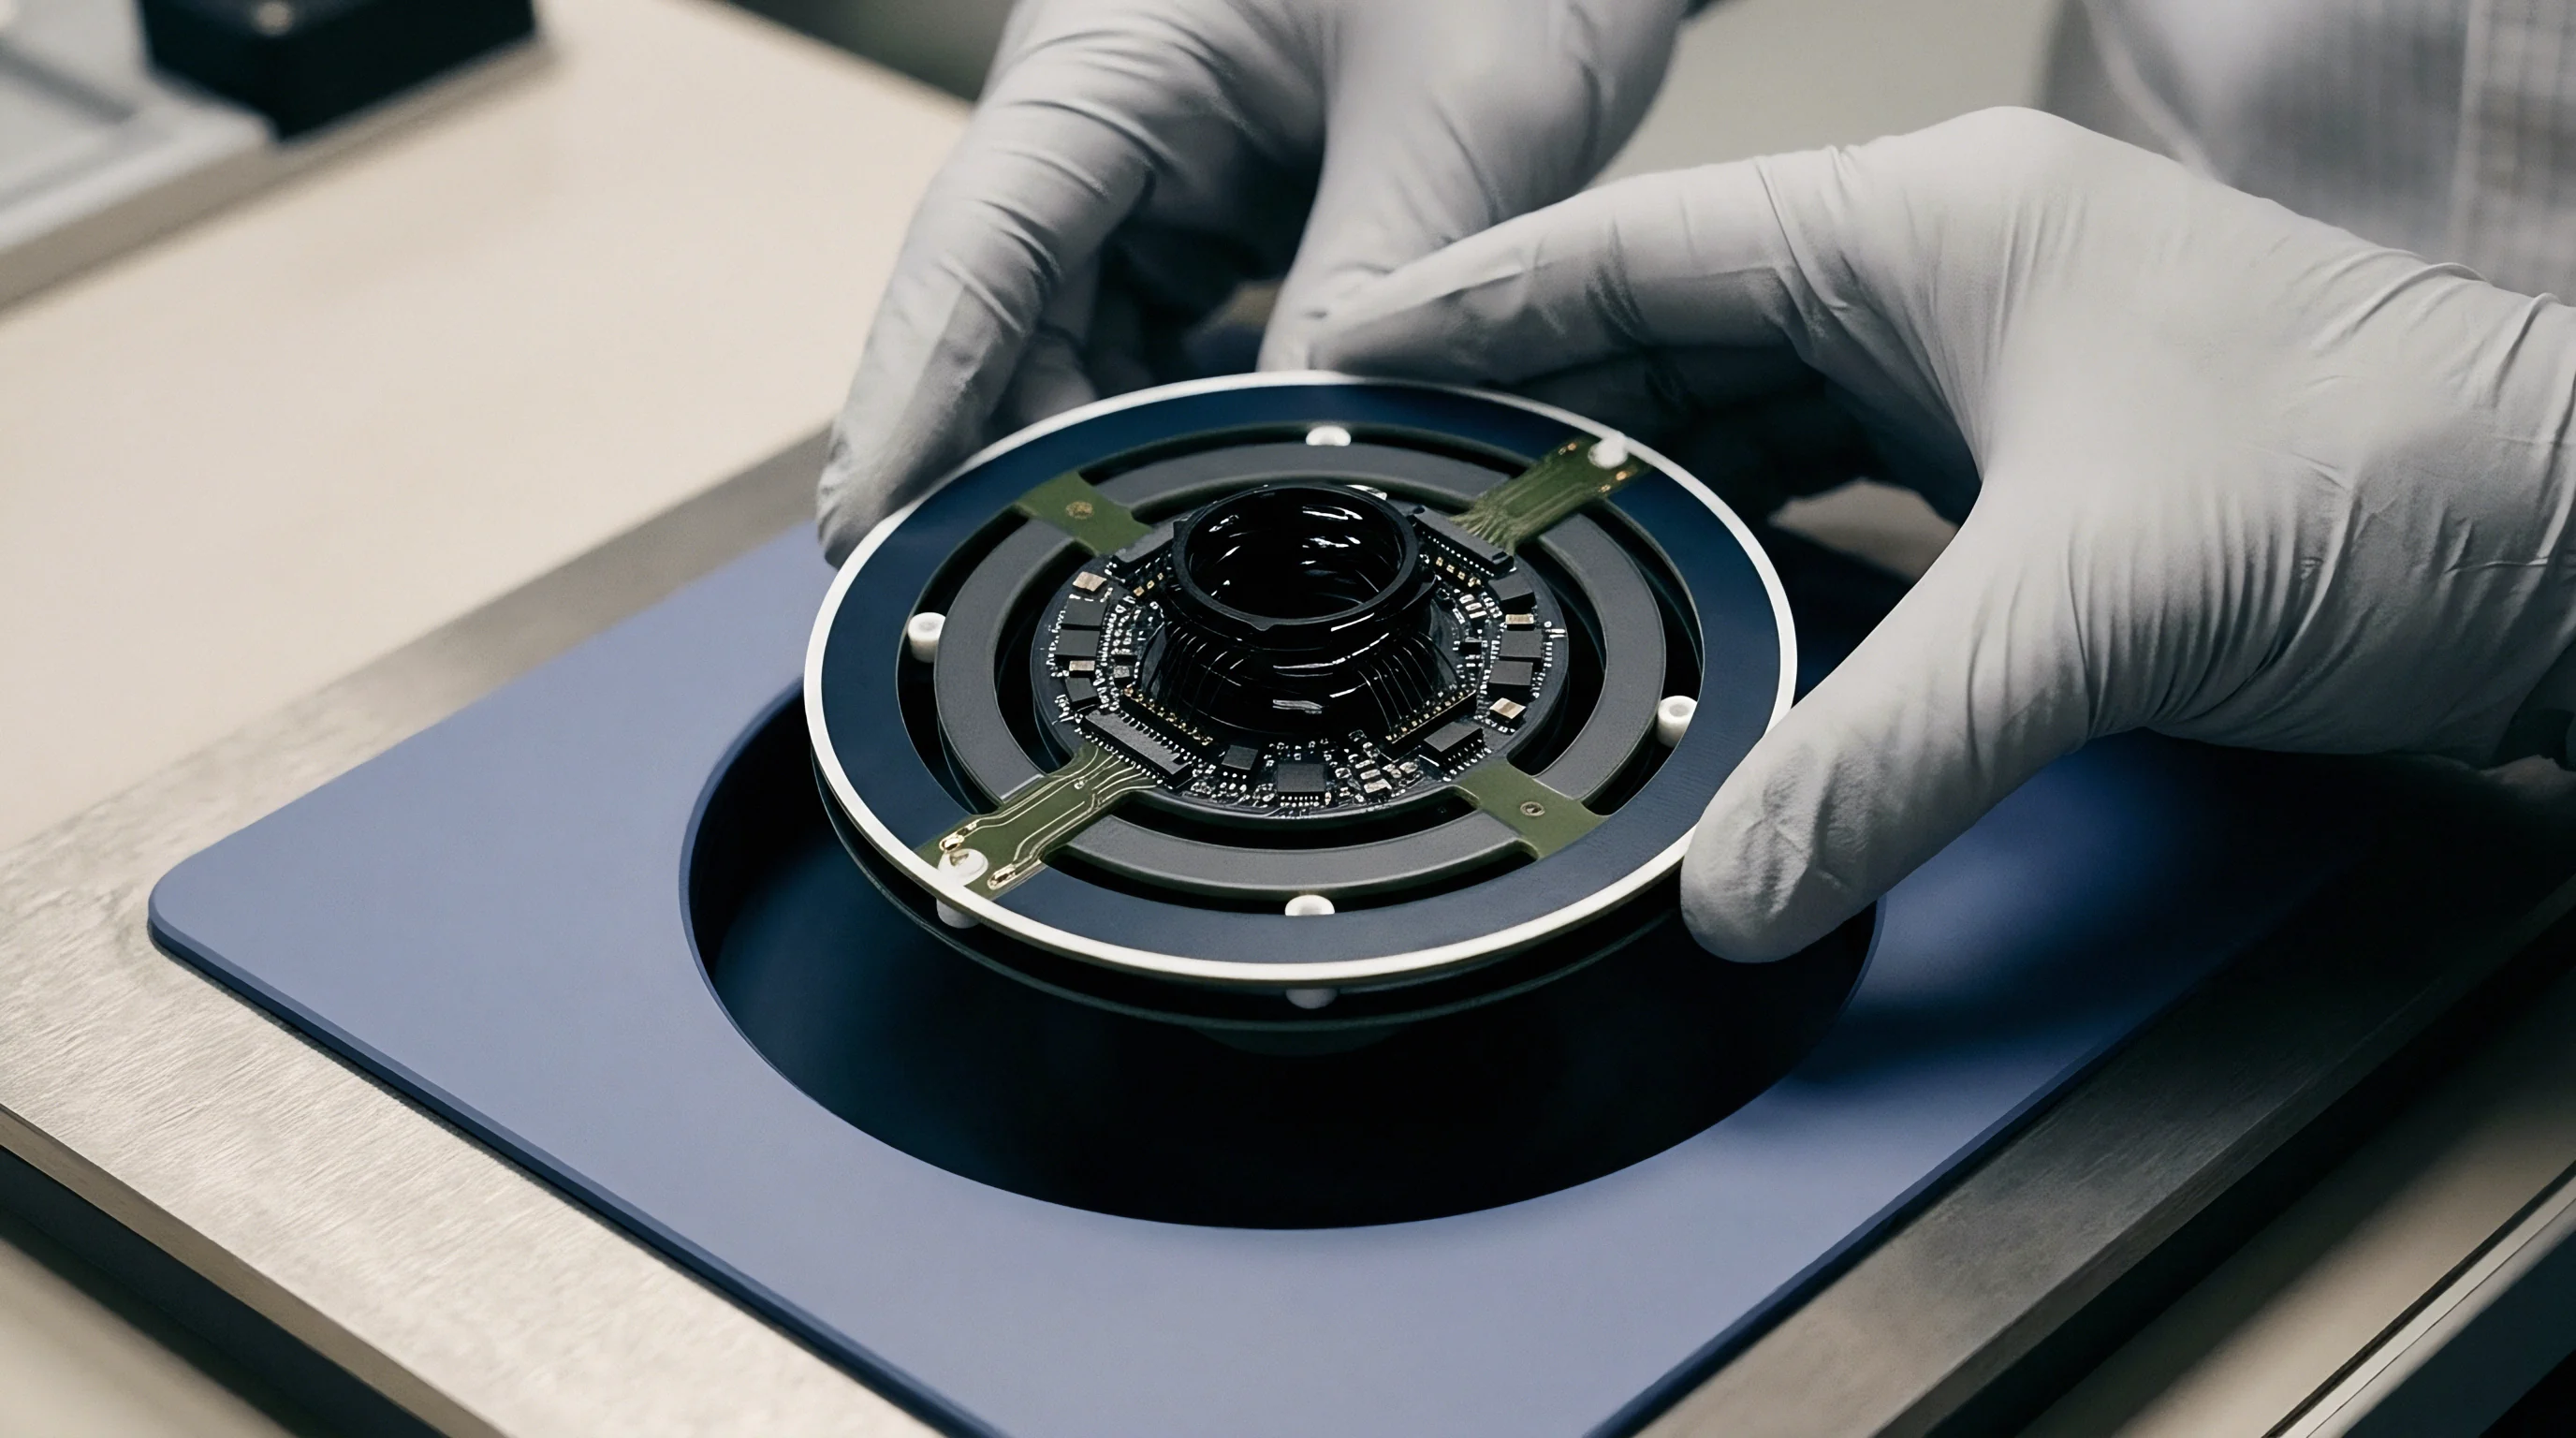
Procurement dossiers for radio frequency crystals must eliminate vague baseline specifications that omit multi-level drive testing. Standard commercial datasheets quote nominal motional resistance at a single drive level, typically 10 microwatts or 100 microwatts ~ a single-point specification that provides zero protection against low-drive startup failures or high-drive frequency hopping. Sourcing organizations managing volume production for connected devices must enforce complete drive level dependency characterization across every qualified component variant.
Component qualification frameworks require supplier documentation of raw blank manufacturing controls, chemical cleaning protocols, and hermetic sealing atmospheres. Quartz blanks processed in facilities with sub-standard cleanroom controls exhibit drive level failure rates up to three orders of magnitude higher than blanks manufactured in Class 100 environments. Without explicit contractual test mandates, suppliers deliver lots screened solely at nominal power levels, shifting the economic burden of field failures back to device manufacturers.
Quality agreements that omit multi-drive screening transfer the operational risk of sleep-mode wake-up failures entirely onto device assembly lines.
Measurement Procedures per International Electrotechnical Specifications
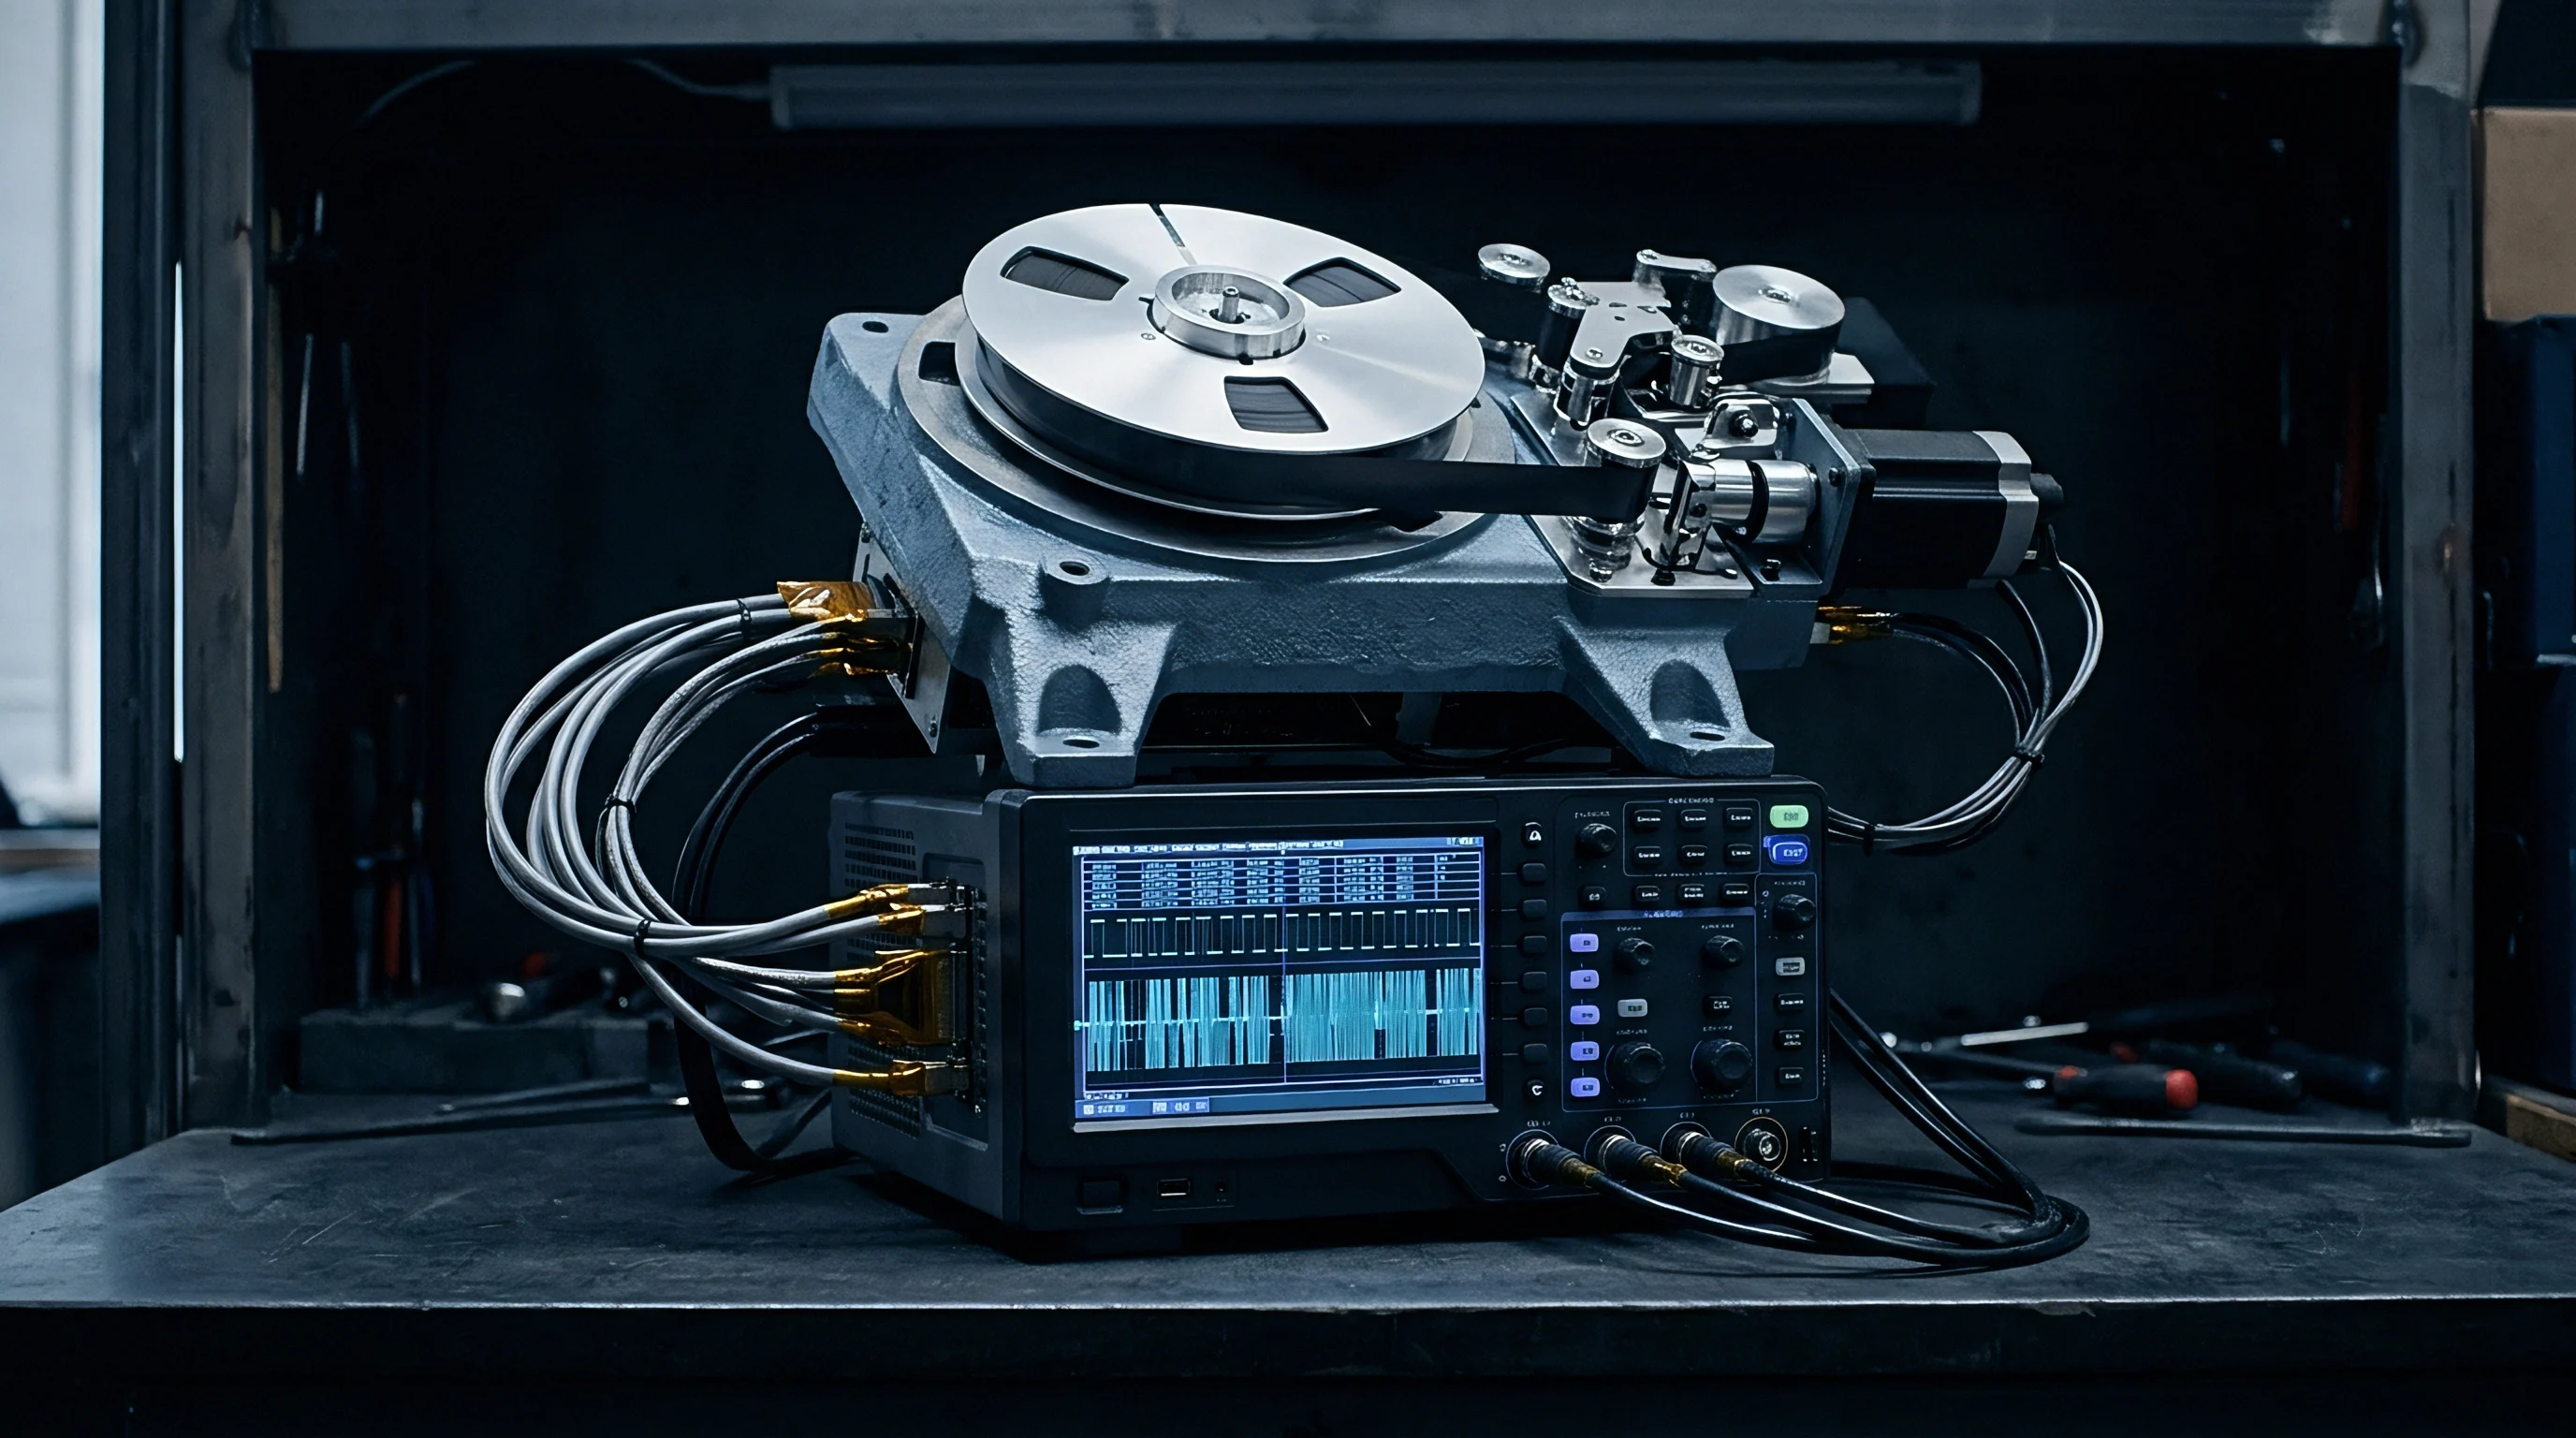
Standardized measurement protocols define testing regimes to quantify parameter stability. Specification IEC 60444-6 establishes standardized methods for measuring drive level dependency in quartz crystal units using transmission network techniques. The standard specifies multi-level power sweeps across two decades minimum, mandating calculations of resistance differences and frequency pull ranges across the entire operating window.
The standard mandates computation of the drive level dependency resistance coefficient, defined as the maximum motional resistance minus the minimum motional resistance measured across the specified drive range. For high-reliability radio transceivers, maximum permissible resistance variation must remain below ten percent of nominal motional resistance across drive ranges from 0.1 microwatts to 100 microwatts. Blank designs exceeding this envelope suffer from defective electrode metallization or inadequate vacuum sealing, justifying immediate lot rejection.
Batch Acceptance Limits for Low Power Radios
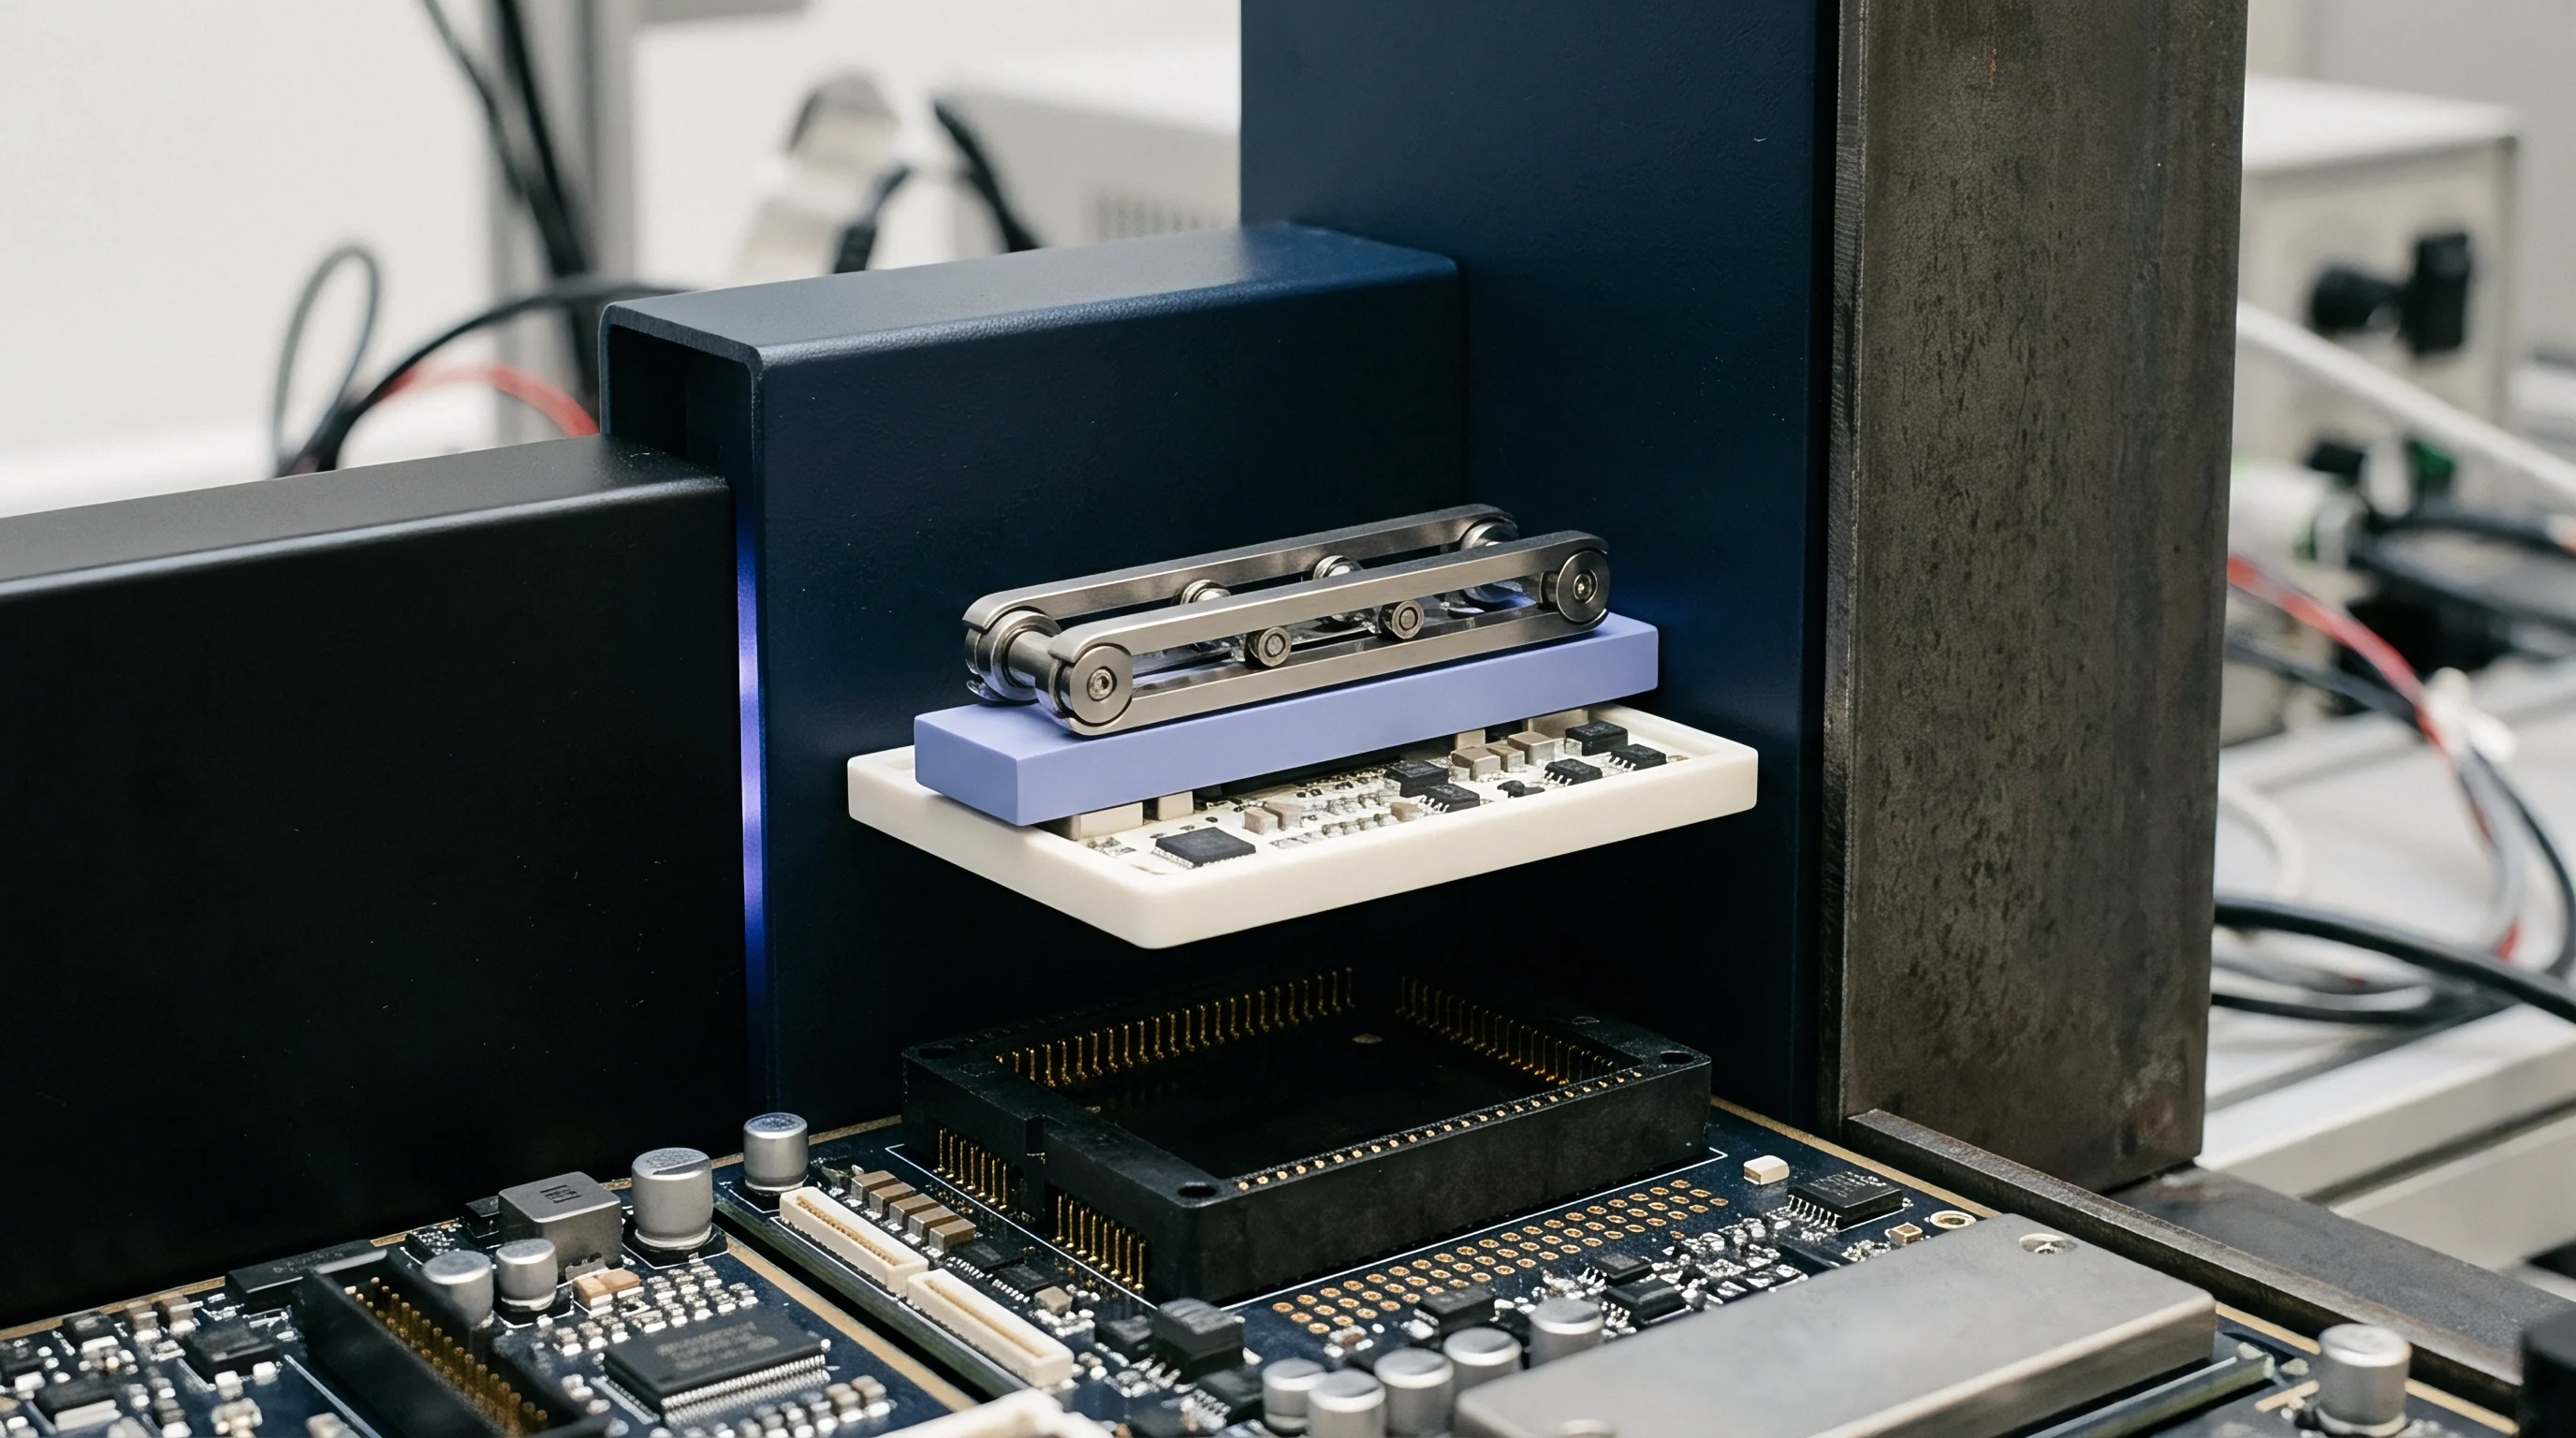
Procurement contracts dictate sampling plans and automated screening thresholds for inbound shipments. Component verification protocols require suppliers to implement 100 percent screening of high-frequency reference crystals across multi-level drive steps prior to tape-and-reel packaging. Incoming inspection lots must face destructive audit testing across thermal extremes to verify that resistance anomalies remain suppressed at low temperatures.
Specification files incorporate mathematical boundaries governing permissible parameter shifts. Maximum frequency displacement across the entire excitation spectrum must not exceed plus or minus two parts per million for narrow-band Internet of Things and Bluetooth Low Energy applications. Lots displaying non-monotonic frequency shifts or resistance step discontinuities must be quarantined immediately to prevent contaminated blanks from entering high-speed surface mount assembly lines.
Contractual procurement language governing high-frequency resonators enforces compliance with IEC 60444-6 clause 5.3, mandating that the ratio of maximum equivalent series resistance measured at one microwatt to nominal equivalent series resistance measured at one hundred microwatts remain strictly below 1.25 across all production lots.