W Band Free Space Polymer Dielectric Testing Basics
Free-space W-band polymer testing requires precise spot-focused optics, strict sample thickness tolerances, and validated TRL calibration to prevent radome detuning and costly regulatory re-certification delays.
Permittivity

Complex Refractive Index and Phase Delay Mechanics
Electromagnetic wave propagation through polymer media between 75 GHz and 110 GHz follows Maxwell’s wave equation adapted for complex constitutive parameters. The real part of relative permittivity determines phase velocity within the material, shifting the electrical length and resonant frequency of printed radiators. The imaginary part quantifies energy dissipation per unit wavelength, setting the attenuation in decibels per millimeter along an interconnect or radome.
Across W-band frequencies, free-space characterization captures phase shift and amplitude loss from a plane wave passing through a flat material sample mounted between horn antennas with spot-focusing dielectric lenses.
Vector network analyzers down-convert W-band signals through frequency multiplier chains and waveguide extension modules to record scattering parameters S11, S21, S12, and S22. Accurate transmission phase measurements depend on sub-micron placement relative to the focal plane. Because phase errors scale linearly with frequency, a 10-micron displacement at 100 GHz creates a 1.2-degree shift in transmission phase measurements.
Resolving real permittivity to three decimal places requires tracking thermal expansion in both the test fixture and the sample during execution.
At millimetre-wave frequencies, polarization in polymer dielectrics is driven primarily by electronic and atomic displacement. The dipolar relaxation mechanisms common at lower microwave frequencies taper off before reaching 75 GHz, leaving electronic cloud deformation as the main interaction mechanism. Low-loss polymers like polytetrafluoroethylene, liquid crystal polymers, and cyclic olefin copolymers maintain loss tangents between 0.0003 and 0.0015 across the W-band.
Local anisotropy from resin purity, filler dispersion, or polymer chain alignment can shift effective permittivity depending on how the electric field aligns with the extrusion axis.
Free-space transmission phase shift at 77 GHz resolves real permittivity to within 0.005 when sample thickness variation stays below 2 microns across the illuminated beam spot.
Complex Permittivity Equations in Free Space
Extracting constitutive parameters from measured S-parameters relies on inversion algorithms based on the Nicolson-Ross-Weir formulation or non-iterative conversion routines. Scattering equations frame transmission and reflection as functions of sample thickness, wave impedance, and propagation constant within the polymer slab.
The total transmission factor inside the dielectric sample accounts for multiple internal reflections at the air-polymer interfaces:
S21 = ( (1 – R^2) P ) / (1 – R^2 P^2)
Here, R represents the reflection coefficient at the front interface for normal incidence, expressed as:
R = (1 – sqrt(eps_r)) / (1 + sqrt(eps_r))
The phase propagation term P across thickness d relates to the complex wave propagation constant gamma inside the material:
P = exp(-gamma d) = exp(-j (2 pi f / c) sqrt(eps_r) d)
For high-loss materials, iterative root-finding algorithms resolve phase ambiguities when electrical length exceeds one wavelength. Low-loss polymers produce quarter-wavelength transmission nulls where S11 drops toward the VNA receiver’s noise floor. Selecting sample thickness to avoid half-wavelength integer multiples prevents phase inversion singularities, maintaining stable loss tangent extraction across the full 35 GHz span of the W-band allocation.
Regulatory Impact on Millimetre-Wave Transmitters
Radio approval standards for millimetre-wave transmitters directly tie dielectric precision to radiated power compliance and spurious emissions limits. Under FCC Part 95 rules for 76 GHz to 81 GHz automotive radar, equivalent isotropically radiated power limits apply at the outer radome surface. A 2 percent deviation in real permittivity from nominal design values alters the focal length of integrated dielectric lenses, degrading antenna directivity and altering sidelobe levels.
Lower directivity reduces boresight gain while raising off-axis emissions into adjacent frequency bands.
European approval under ETSI EN 301 091-1 sets strict spectral power density and out-of-band emission boundaries. If an uncharacterized polymer batch enters production, dielectric constant variations detune microstrip patch arrays, steering antenna beams off-boresight by up to 1.5 degrees. Retesting finished transmitters in anechoic chambers for permissive changes adds three weeks to approval timelines.
Sourcing teams use free-space bench testing to verify incoming material batches before committing resin lots to radome injection molding runs.
Uncertainty in real permittivity feeds directly into antenna gain calculation errors during compliance testing. Standard laboratory protocols treat the radome as a calibrated loss element, subtracting calculated dielectric absorption from raw field strength measured on a three-meter turntable. Miscalculating the loss tangent by 0.001 introduces a 0.8 dB error in derived equivalent isotropically radiated power ~ risking regulatory rejection from over-reported field strength, or masking non-compliant transmitter states due to under-reporting.
Free-space testing provides the baseline dielectric properties needed to build electromagnetic solver models for regulatory dossiers. Certification bodies review these properties during technical construction file audits to confirm that simulated antenna patterns match physical chamber measurements across operating temperatures. Accurate permittivity data prevents discrepancies between modeled antenna performance and physical chamber scans during formal type approval testing.
Precise dielectric data eliminates expensive retests caused by unexpected antenna detuning in host enclosures.

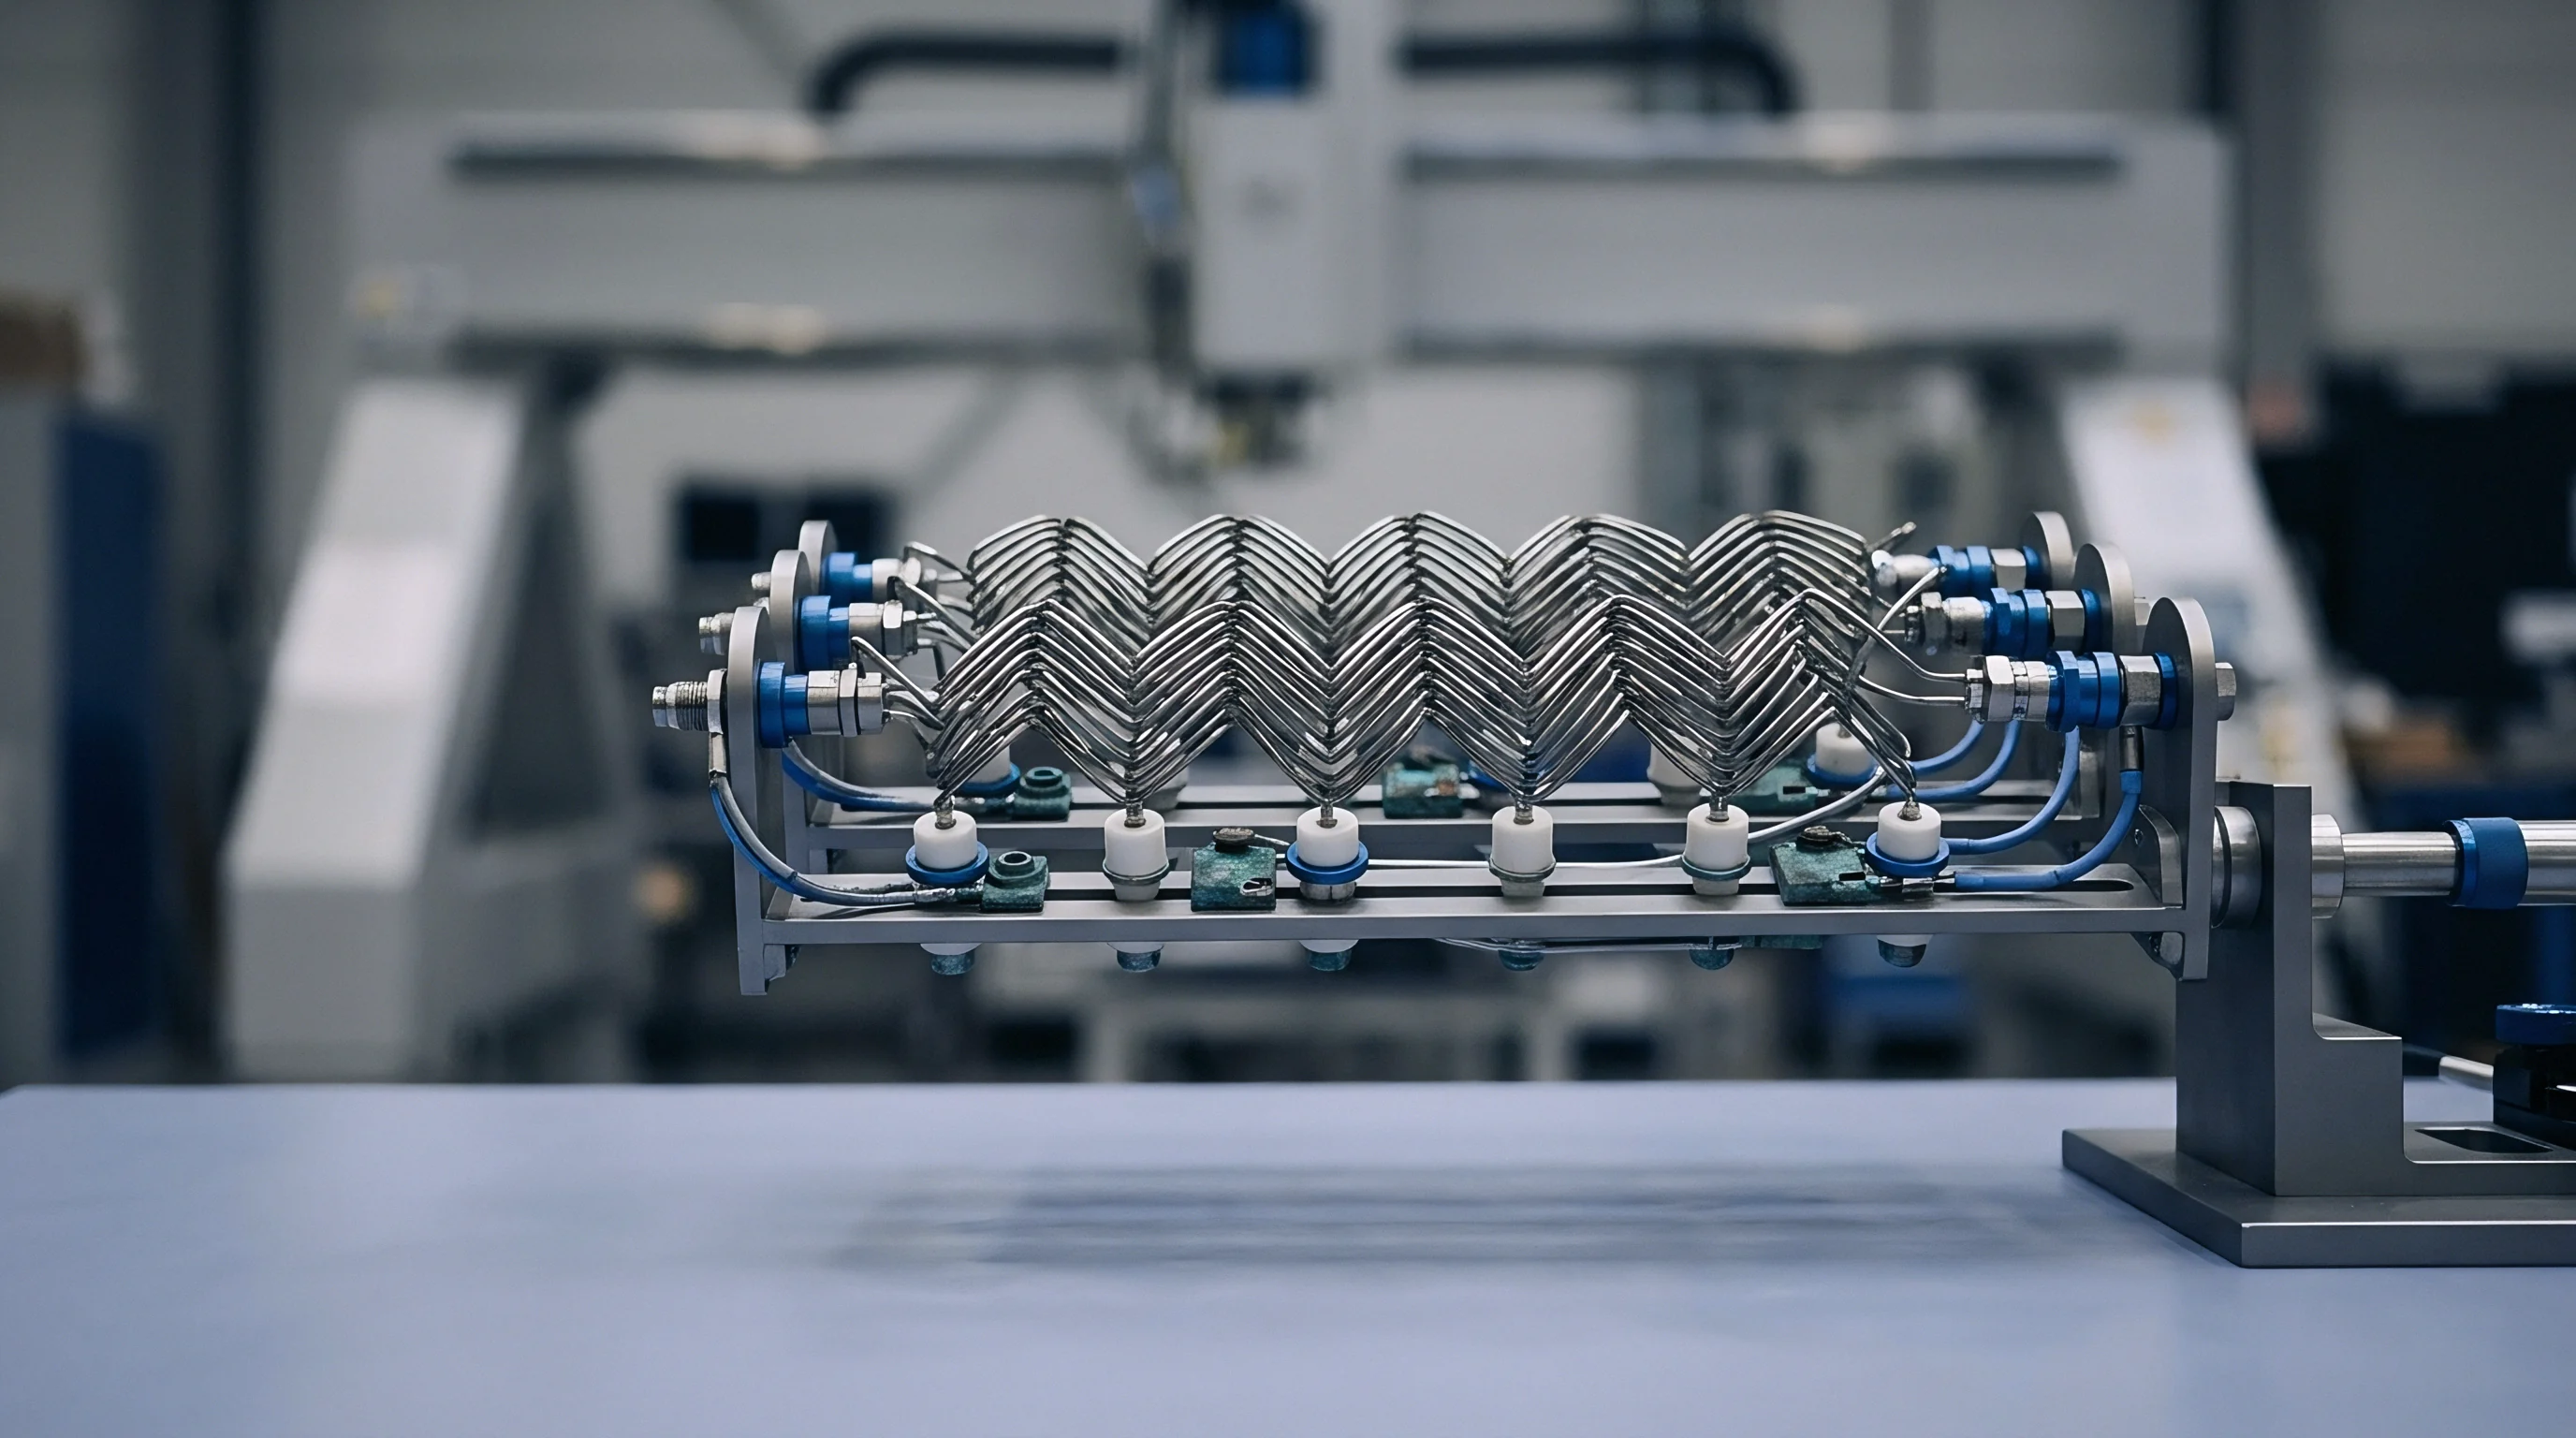
Slab

Sample Preparation and Geometry Specifications
Free-space dielectric testing requires tight control over slab dimensions, surface planarity, and edge perpendicularity. The illuminated sample area must exceed the Gaussian beam waist diameter by a factor of three to keep diffraction at specimen boundaries below negative 40 dB relative to the main transmission path. At 94 GHz, a spot-focusing horn antenna system with a 15 mm beam waist requires samples at least 55 mm wide and tall.
Smaller samples allow edge-diffracted waves to reach the receive horn, contaminating S-parameter phase data with multipath interference.
Sample thickness dictates measurement accuracy for both real permittivity and loss tangent. Ideally, specimen thickness matches an odd multiple of quarter-wavelengths in the material at the center frequency. At 77 GHz, a polymer with a real permittivity of 2.10 yields a quarter-wavelength thickness of 0.67 mm.
Machining slabs to 2.01 mm yields three quarter-wavelengths of phase delay, maximizing S11 reflection sensitivity while avoiding phase wrap ambiguities during Nicolson-Ross-Weir extraction. Thicker samples increase total insertion loss, improving S21 dynamic range for ultra-low-loss materials like high-density polyethylene.
| Polymer Family | Target Thickness at 77 GHz (mm) | Thickness Tolerance (mm) | Min Lateral Dimension (mm) | Max Surface Roughness Ra (um) |
|---|---|---|---|---|
| PTFE (Unfilled) | 2.01 | +/- 0.003 | 60.0 | 0.4 |
| Liquid Crystal Polymer | 1.34 | +/- 0.002 | 55.0 | 0.2 |
| Cyclic Olefin Copolymer | 2.05 | +/- 0.002 | 55.0 | 0.2 |
| Polyetheretherketone (PEEK) | 1.58 | +/- 0.004 | 60.0 | 0.5 |
| Fluorinated Ethylene Propylene | 1.98 | +/- 0.003 | 60.0 | 0.3 |
Surface roughness introduces air gaps and wave scattering at the material interface. Polishing sample faces to an Ra roughness below 0.4 microns prevents phase wavefront distortion across the beam diameter. Tool marks or surface tilt produce non-uniform phase delays across the wavefront, broadening the measured S11 beam width and adding artificial loss to the calculated dissipation factor.
Precision CNC milling or diamond turning prepares polymer slabs without causing localized thermal degradation.
Parallelism between front and rear surfaces must stay within 0.005 mm across the entire sample face. Non-parallel faces act as weak optical wedges, refracting the transmitted beam away from the receiving horn axis. A 0.01 mm thickness taper across a 60 mm sample redirects the beam path by several milliradians, causing a 1.5 dB artificial drop in S21 amplitude at 110 GHz.
Testing labs measure thickness at nine points across the sample using digital micrometers calibrated against gauge blocks before mounting.
Mechanical Clamping and Orientation Dynamics
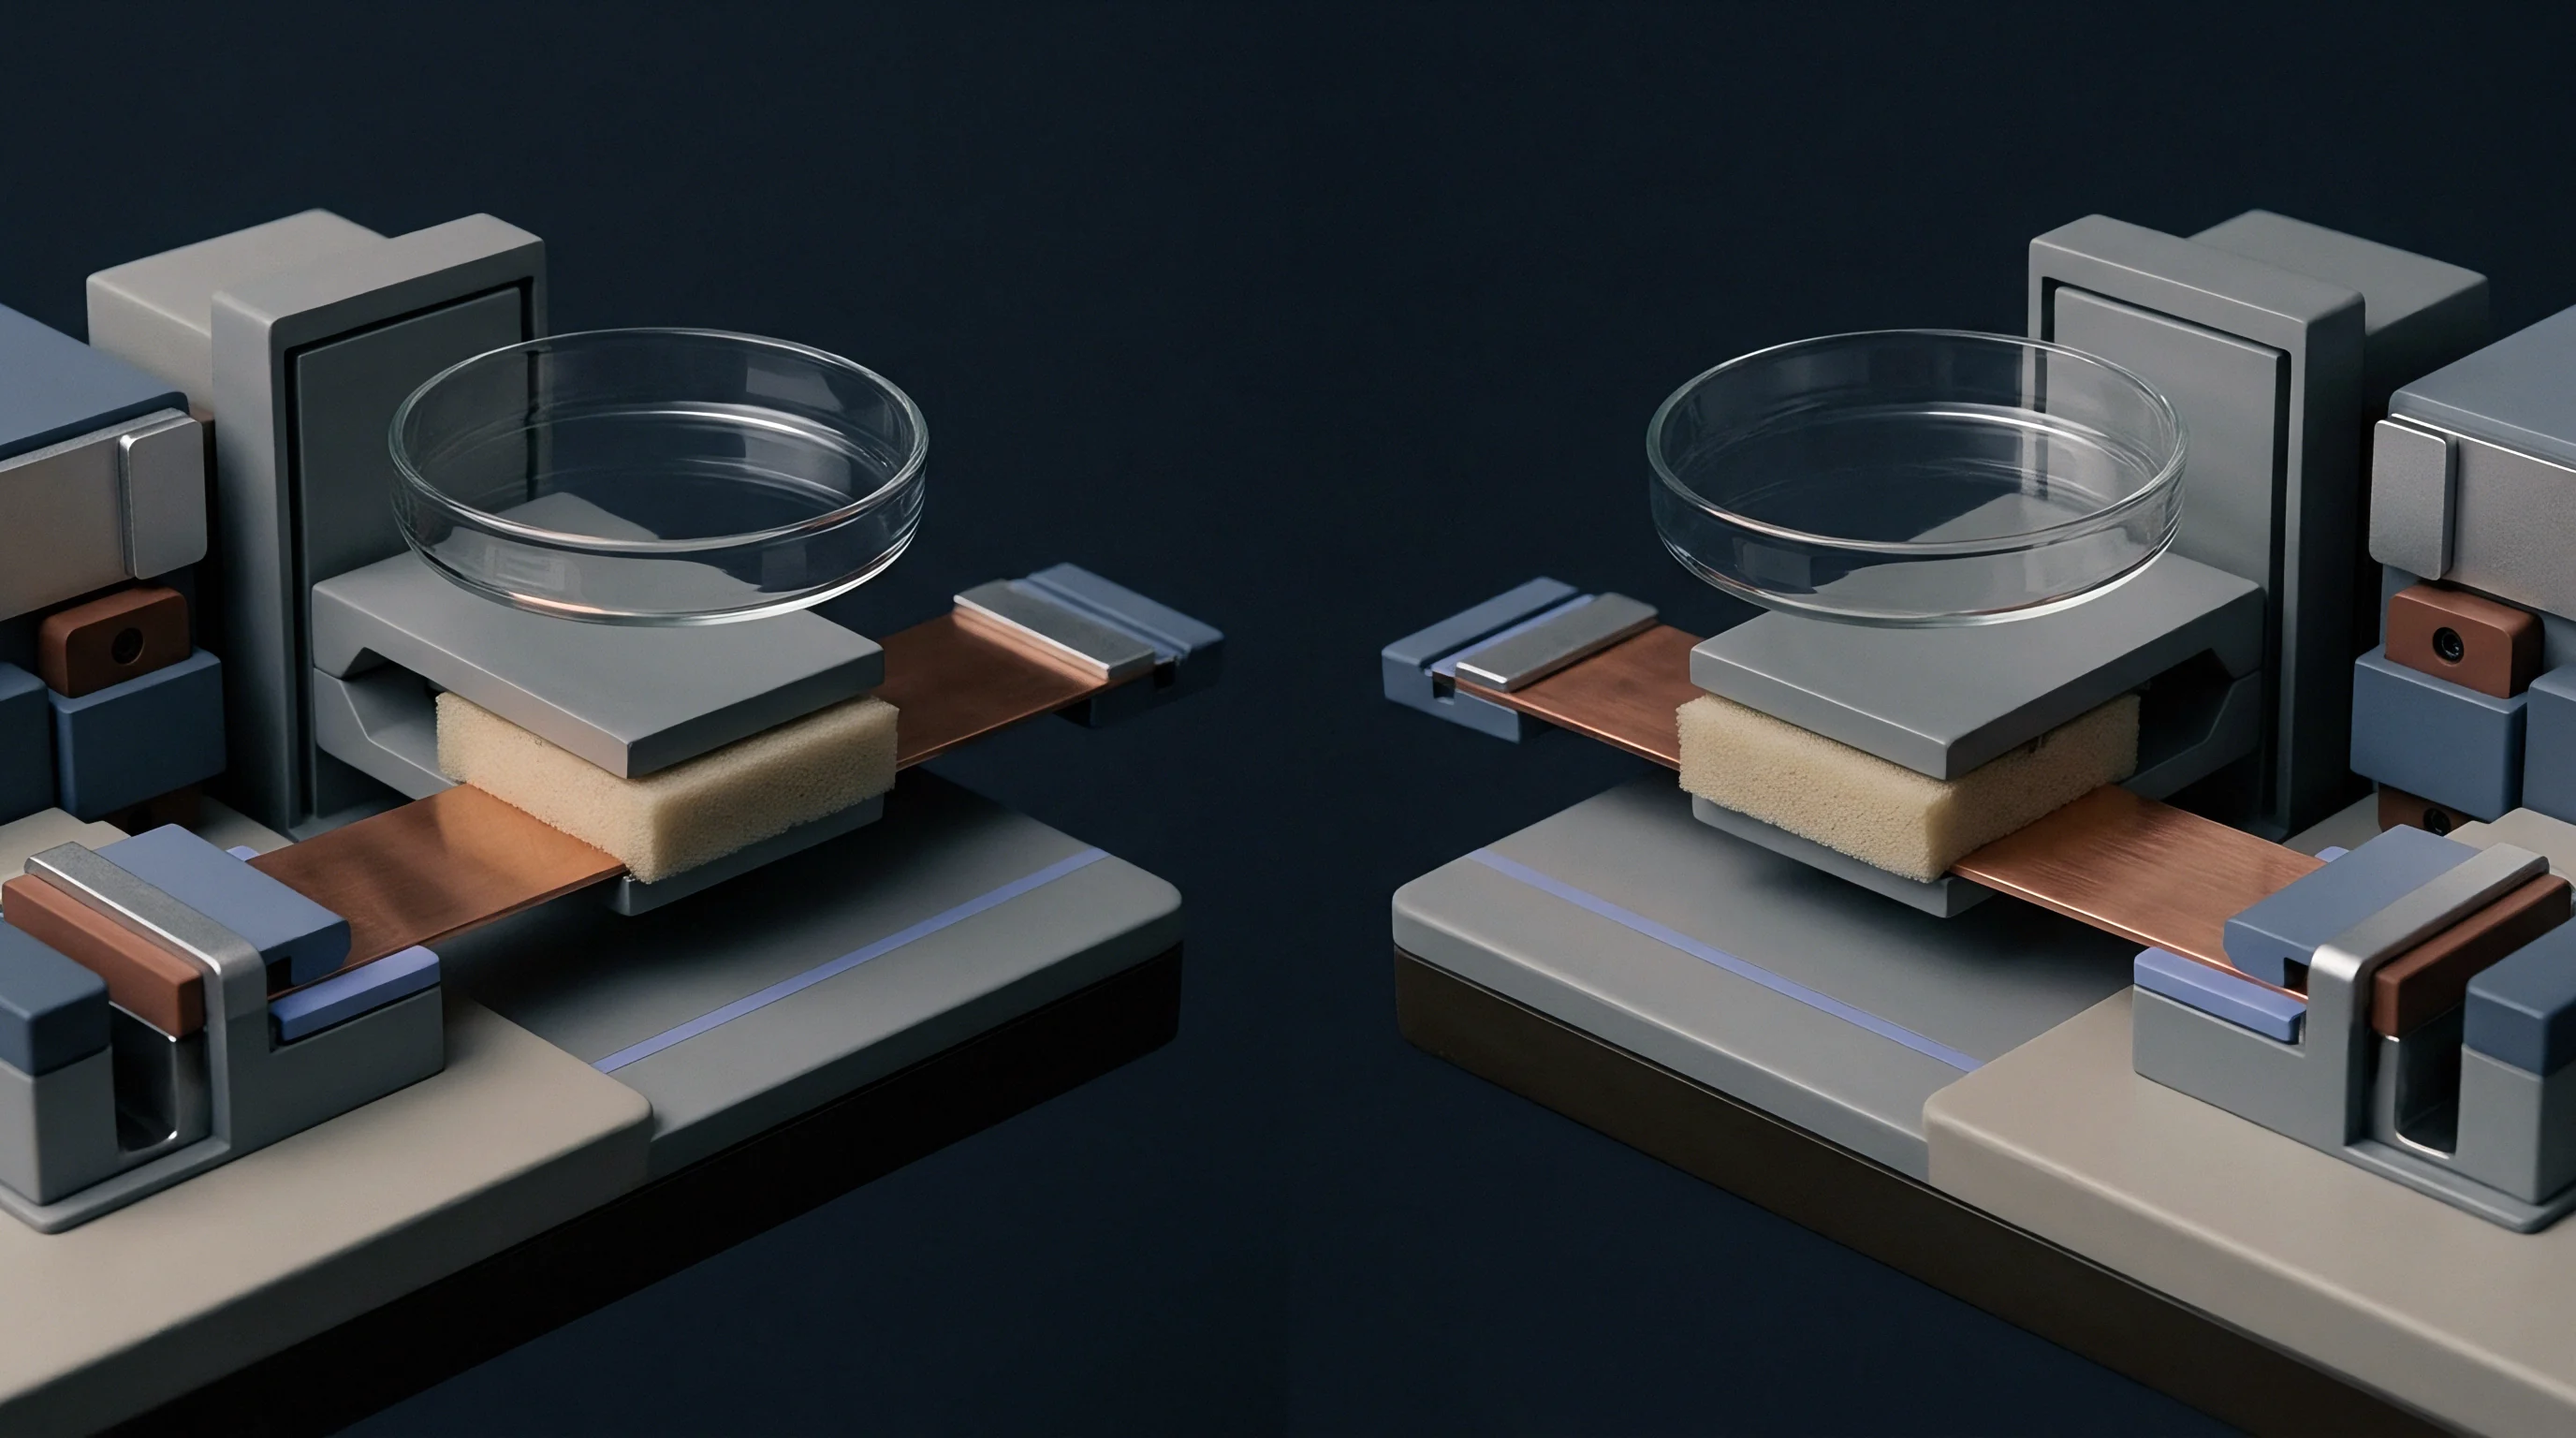
Securing the polymer slab in the optical path requires a holder that applies uniform radial tension without straining the material. Excessive clamping deforms softer polymers like PTFE, shifting local density and permittivity in the beam path. Fixture frames use radar-absorbent material along aperture edges to damp stray reflections from metal brackets.
Positioning the holder perpendicular to the optical axis minimizes cross-polarization conversion during transmission runs.
A two-micron variation in sample thickness across the beam waist introduces a larger phase error at 94 GHz than a one-degree tilt in mechanical fixture alignment.
Anisotropy testing requires controlled rotation of the polymer slab relative to the electric field vector. Extruded polymers exhibit molecular alignment in the machine direction, resulting in higher real permittivity parallel to extrusion than perpendicular to it. Rotating the sample in 15-degree increments around its optical axis maps these polarization-dependent variations.
Quantifying anisotropy prevents unexpected beam tilt when polymer sheets are converted into commercial radomes.
Gaps between the sample and holder frame create edge diffraction that degrades low-signal accuracy. Precision mounts use flexible elastomeric gaskets along the periphery to seal edges without intruding into the aperture. Maintaining alignment prevents phase front distortion across the W-band sweep.
Poor mechanical preparation often forces labs to reject samples, causing reporting delays and schedule slippage.
Ignoring sample surface planarity and thickness tolerance leads to inaccurate permittivity values that derail downstream radio equipment approvals.

Optics
Gaussian Beam Architecture and Spot-Focusing Lens Horns
Free-space mm-wave characterization replaces standard waveguide sample holders with open-air quasi-optical paths. Rectangular waveguides like WR-10 create difficult machining requirements and wall air-gap errors at W-band. Quasi-optical benches avoid these issues by focusing electromagnetic energy into narrow spot beams using scalar horn antennas and plano-convex or biconvex dielectric lenses.
Beam propagation follows Gaussian optics rules, where waist size determines spatial resolution at the sample.
Designing Gaussian beam paths requires calculating waist radius, Rayleigh range, and phase front curvature across 75 GHz to 110 GHz. The beam waist radius w0 at the focal plane depends on wavelength lambda, lens focal length f, and clear aperture diameter D:
w0 = (lambda f) / (pi w_lens)
Here, w_lens is the beam radius at the lens surface. To maintain quasi-optical propagation without edge diffraction, lens aperture diameters must be at least twice the beam radius at the lens plane. Polyethylene or PTFE lenses with anti-reflection grooves optimize power transmission across W-band, suppressing internal reflections that create ripple artifacts in raw S-parameter sweeps.
Bench alignment requires laser-guided positioning fixtures to maintain optical axis continuity between transmitter and receiver heads. Displacing the focal plane along the optical axis moves the beam waist off the sample surface, exposing the material to curved phase fronts rather than plane waves. Curved wavefronts violate the normal-incidence assumption in Nicolson-Ross-Weir extraction equations, introducing errors into real permittivity calculations.
Waveguide extension modules mount directly behind scalar horn antennas, minimizing cable movement during calibration and sample handling. Flexing coaxial or waveguide cables alters phase calibration paths and degrades VNA measurement stability. Rigid benches assemble all components on vibration-isolated optical tables to preserve micrometer-level structural stability over long test sequences.
Calibration Sequences and Gated-Reflect-Line Protocols
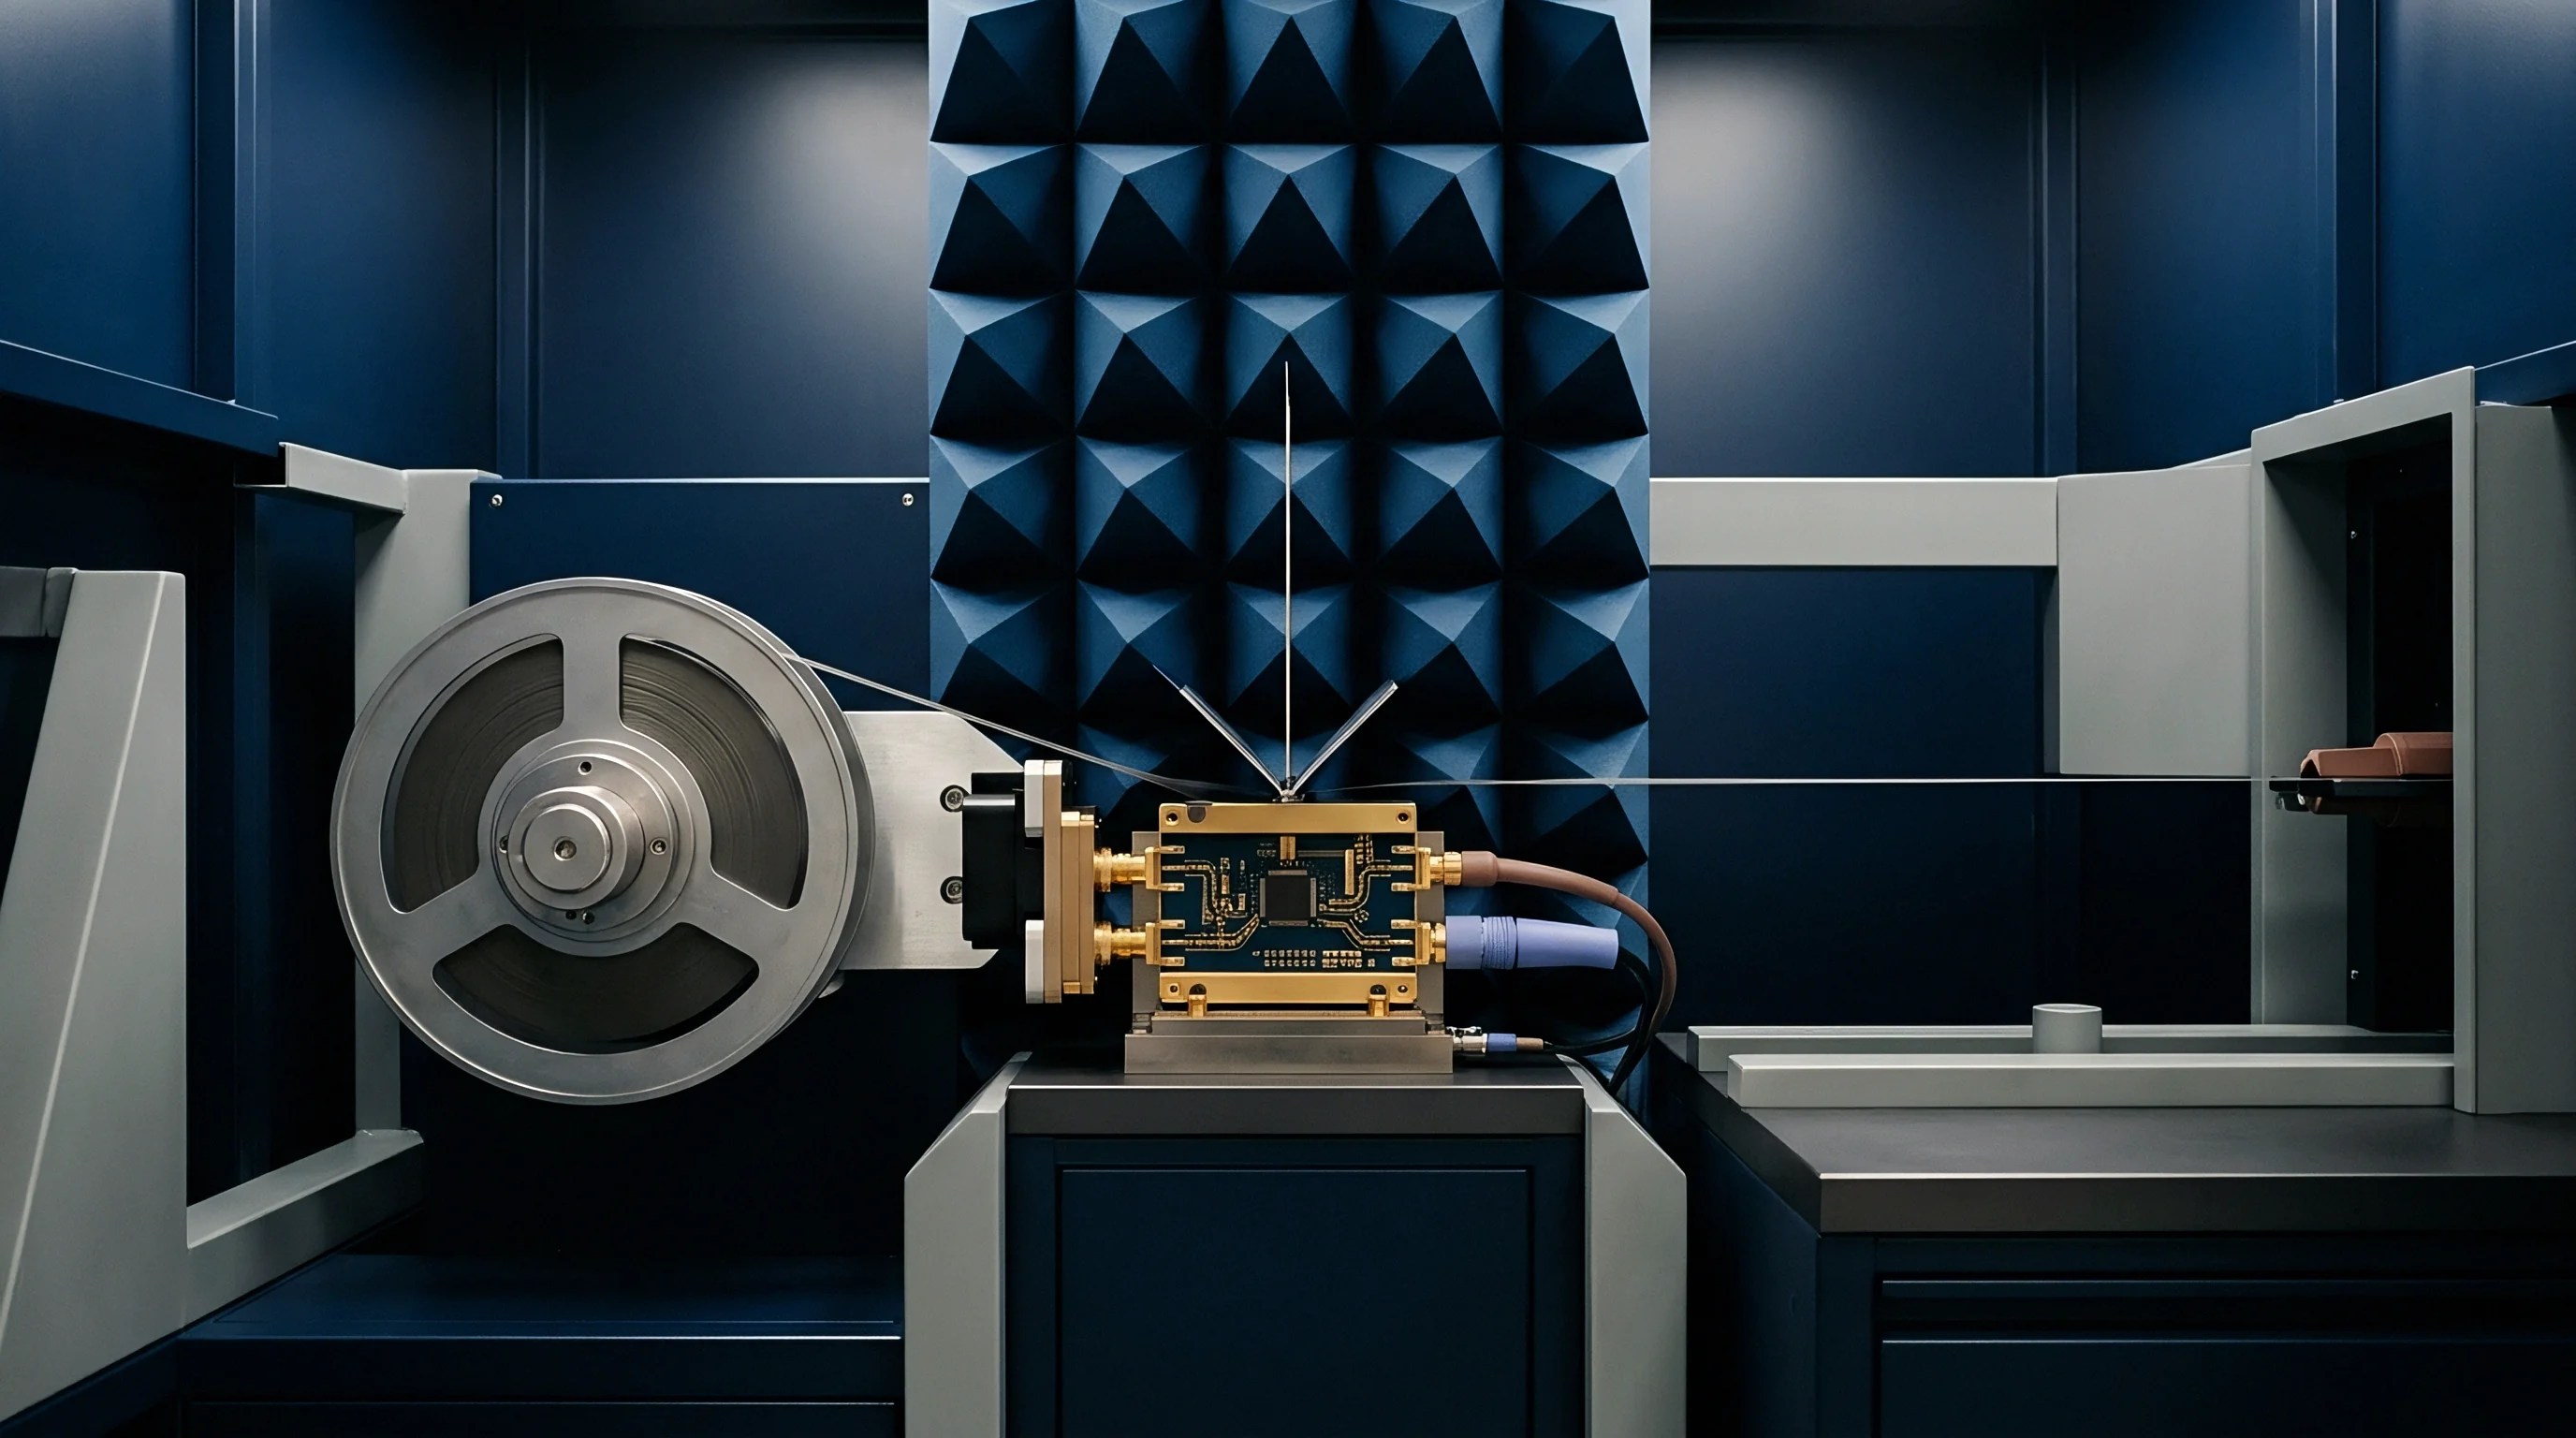
Calibrating quasi-optical systems requires eliminating systematic errors from internal horn reflections, lens mismatches, and beam spreading. Standard SOLT calibrations used for coaxial lines cannot be performed in open air. Free-space setups use Thru-Reflect-Line or Gated-Reflect-Line protocols designed for quasi-optical paths.
- Thru Calibration Standard establishes the primary phase and amplitude reference by recording S21 transmission through an empty fixture with focal planes precisely touching or separated by a known offset distance.
- Reflect Calibration Standard places a polished precision aluminum plate at the focal plane, reflecting incident energy back to the transmitting horn to calibrate S11 and S22 phase responses.
- Line Calibration Standard shifts the receive horn back by a precise quarter-wavelength at the center frequency, providing phase dispersion reference data across the full band.
- Gated Time-Domain Filtering isolates the main dielectric sample response by applying a mathematical window in the time domain, trimming away lingering antenna structural reflections and room scatter.
Time-domain gating removes standing wave ripple caused by residual reflections between lens surfaces and the sample face. A software gate duration of 0.5 nanoseconds isolates the direct transmission impulse while filtering multi-path reflections from surrounding lab equipment. Setting the gate width too narrow truncates the sample step response, degrading loss tangent resolution for ultra-low-loss polymers.
Calibration verification uses reference materials with known dielectric properties, such as fused silica plates. Dynamic range checks ensure signal-to-noise ratios exceed 40 dB across 75 GHz to 110 GHz, supporting accurate evaluation of high-loss polymers. Frequent re-calibrations mitigate environmental drift caused by temperature shifts in the lab.
Supplier datasheets often state that dielectric loss tangents measured in waveguide fixtures apply directly to free-space radome designs, though edge-gap errors in closed mounts routinely understate losses at W-band frequencies.

Metrology

Vector Network Analyzer Sweep Execution and Noise Floor Control
Precision dielectric metrology at millimetre-wave frequencies requires careful setup of Vector Network Analyzer sweep parameters. Millimetre-wave extension modules use internal frequency multipliers to scale microwave source signals up to the 75 GHz to 110 GHz range. Signal attenuation in waveguide components and optical paths reduces power levels at the sample plane, making receiver noise control critical when measuring low-transmission samples.
Setting intermediate frequency bandwidth balances sweep speed against receiver noise floor limits. An IF bandwidth of 100 Hz yields a noise floor near negative 85 dBm across W-band, providing enough dynamic range for thick or filled polymer samples. Dropping the IF bandwidth to 10 Hz lowers the noise floor by 10 dB but extends sweep times per trace, increasing vulnerability to thermal phase drift in unjacketed RF cabling.
Averaging 16 to 32 consecutive frequency sweeps smooths trace noise, allowing accurate extraction of loss tangents down to 0.0005.
| Measurement Parameter | Standard Value | Optimization Target | Operational Trade-off |
|---|---|---|---|
| IF Bandwidth | 100 Hz | Maximize Dynamic Range | Lower noise floor increases sweep duration |
| Trace Averaging | 16 Sweeps | Reduce Random Noise | Suppresses trace ripple, extends test time |
| Frequency Points | 401 Points | Phase Resolution | Detailed spectral data increases processing load |
| RF Output Power | -5 dBm | Linear Receiver Response | Prevents receiver compression during Thru calibration |
| Time-Domain Gate Span | 0.8 ns | Multipath Elimination | Removes room reflections without truncating signal |
Raw S-parameter measurements capture magnitude and phase across the entire 35 GHz span. Phase unwrapping converts measured phase angles into continuous phase delay curves, preventing 360-degree mathematical discontinuities during real permittivity calculations. Unwrapping relies on initial estimates of sample thickness and nominal permittivity to select the correct phase velocity mode.
Thermal stability inside the test enclosure governs phase measurement repeatability during long runs. Temperature shifts change optical path lengths as aluminum support structures expand or contract. A 1.0 degree Celsius shift expands a 500 mm aluminum bench frame by 11.5 microns, altering phase measurements at 100 GHz by 1.38 degrees.
Climate-controlled enclosures maintaining room temperature within +/- 0.5 degrees Celsius preserve calibration integrity during compliance testing.
Systematic phase drift degrades loss tangent calculations faster than amplitude noise. Verification checks run empty-path transmission scans every two hours during extended testing. Detecting phase drift above 0.5 degrees triggers immediate re-calibration to prevent corrupted S21 phase measurements from entering regulatory filings.

Uncertainty Budgets and Phase Error Propagation
Calculating dielectric measurement uncertainty requires evaluating sources across sample preparation, mechanical alignment, and electronic instrumentation. Combined standard uncertainty follow standard metrology practices, combining individual variance components through partial derivative sensitivity coefficients.
The total uncertainty in real permittivity eps_r derives from sensitivity contributions tied to sample thickness d, measured S21 phase angle phi, and optical path length L:
u(eps_r)^2 = (d(eps_r)/dd)^2 u(d)^2 + (d(eps_r)/d(phi))^2 u(phi)^2 + (d(eps_r)/dL)^2 u(L)^2
Thickness uncertainty u(d) dominates the budget for thin polymer films, while VNA phase uncertainty u(phi) dominates for thick low-loss slabs. At 77 GHz, a thickness uncertainty of +/- 0.002 mm propagates into an uncertainty of +/- 0.008 in real permittivity for a 2.0 mm slab.
Measuring loss tangents below 0.0005 requires a VNA receiver dynamic range exceeding 80 dB and ambient room thermal stability within 0.5 degrees Celsius.
Loss tangent uncertainty depends on S21 amplitude accuracy and time-domain gating window selection. Magnitude uncertainties of +/- 0.05 dB translate to a loss tangent uncertainty of +/- 0.0002 in low-loss polymers. Noise floor limitations prevent standard free-space optical benches from resolving loss tangents below 0.0001 without using high-Q Fabry-Perot open resonator fixtures.
Verification testing validates uncertainty budgets by measuring reference materials calibrated by national metrology institutes. Inter-laboratory comparison programs track variations across facilities, confirming consistency for global type-approval filings. Documenting full uncertainty budgets satisfies ISO/IEC 17025 accreditation requirements for test houses.
How can laboratories reliably distinguish intrinsic polymer dielectric relaxation loss from parasitic wave scattering caused by sub-micron internal filler voids when evaluating loss tangents below 0.0005?

Variability
Thermal Permittivity Coefficients and Environmental Drift
Polymer dielectrics experience shifts in complex permittivity under changing environmental conditions. Automotive radomes and outdoor millimetre-wave hardware operate across ambient temperatures from negative 40 degrees Celsius to positive 85 degrees Celsius. Over this range, thermal expansion alters volumetric density while temperature-dependent molecular mobility shifts dielectric response.
The thermal coefficient of real permittivity tracks fractional changes in permittivity per degree of temperature shift. Unreinforced polyolefins generally show negative thermal coefficients, as thermal expansion reduces volumetric density and lowers real permittivity. Fluoropolymers like PTFE exhibit crystalline phase transitions near 19 degrees Celsius and 30 degrees Celsius, causing non-linear step changes in real permittivity that can alter radar beam patterns during cold starts.
Moisture absorption is another major cause of dielectric variability in engineering polymers. Water has a real permittivity near 34 and a high loss tangent across W-band. Nylon and polyamides absorb up to 2.5 percent atmospheric moisture by weight, raising real permittivity from 2.8 to 3.4 and increasing loss tangents by an order of magnitude.
Hydrophobic polymers like cyclic olefin copolymers and liquid crystal polymers absorb under 0.02 percent moisture, keeping dielectric performance stable in humid environments.
Environmental testing subjects polymer slabs to chamber conditioning before free-space dielectric evaluation. Measuring samples immediately after removal from high-humidity chambers quantifies water uptake effects on W-band transmission loss. Specifications for automotive radar radomes require dielectric stability across thermal cycling and damp heat exposures to preserve radar range calibration over the vehicle’s lifespan.
Controlling process variability during sheet extrusion requires monitoring resin lot purity, mold temperature profiles, and regrind ratios. Adding recycled regrind increases molecular weight distribution variance, introducing localized dielectric heterogeneities that scatter W-band signals. Sourcing contracts enforce strict raw material limits to ensure consistency between type-approval test samples and full-scale factory output.
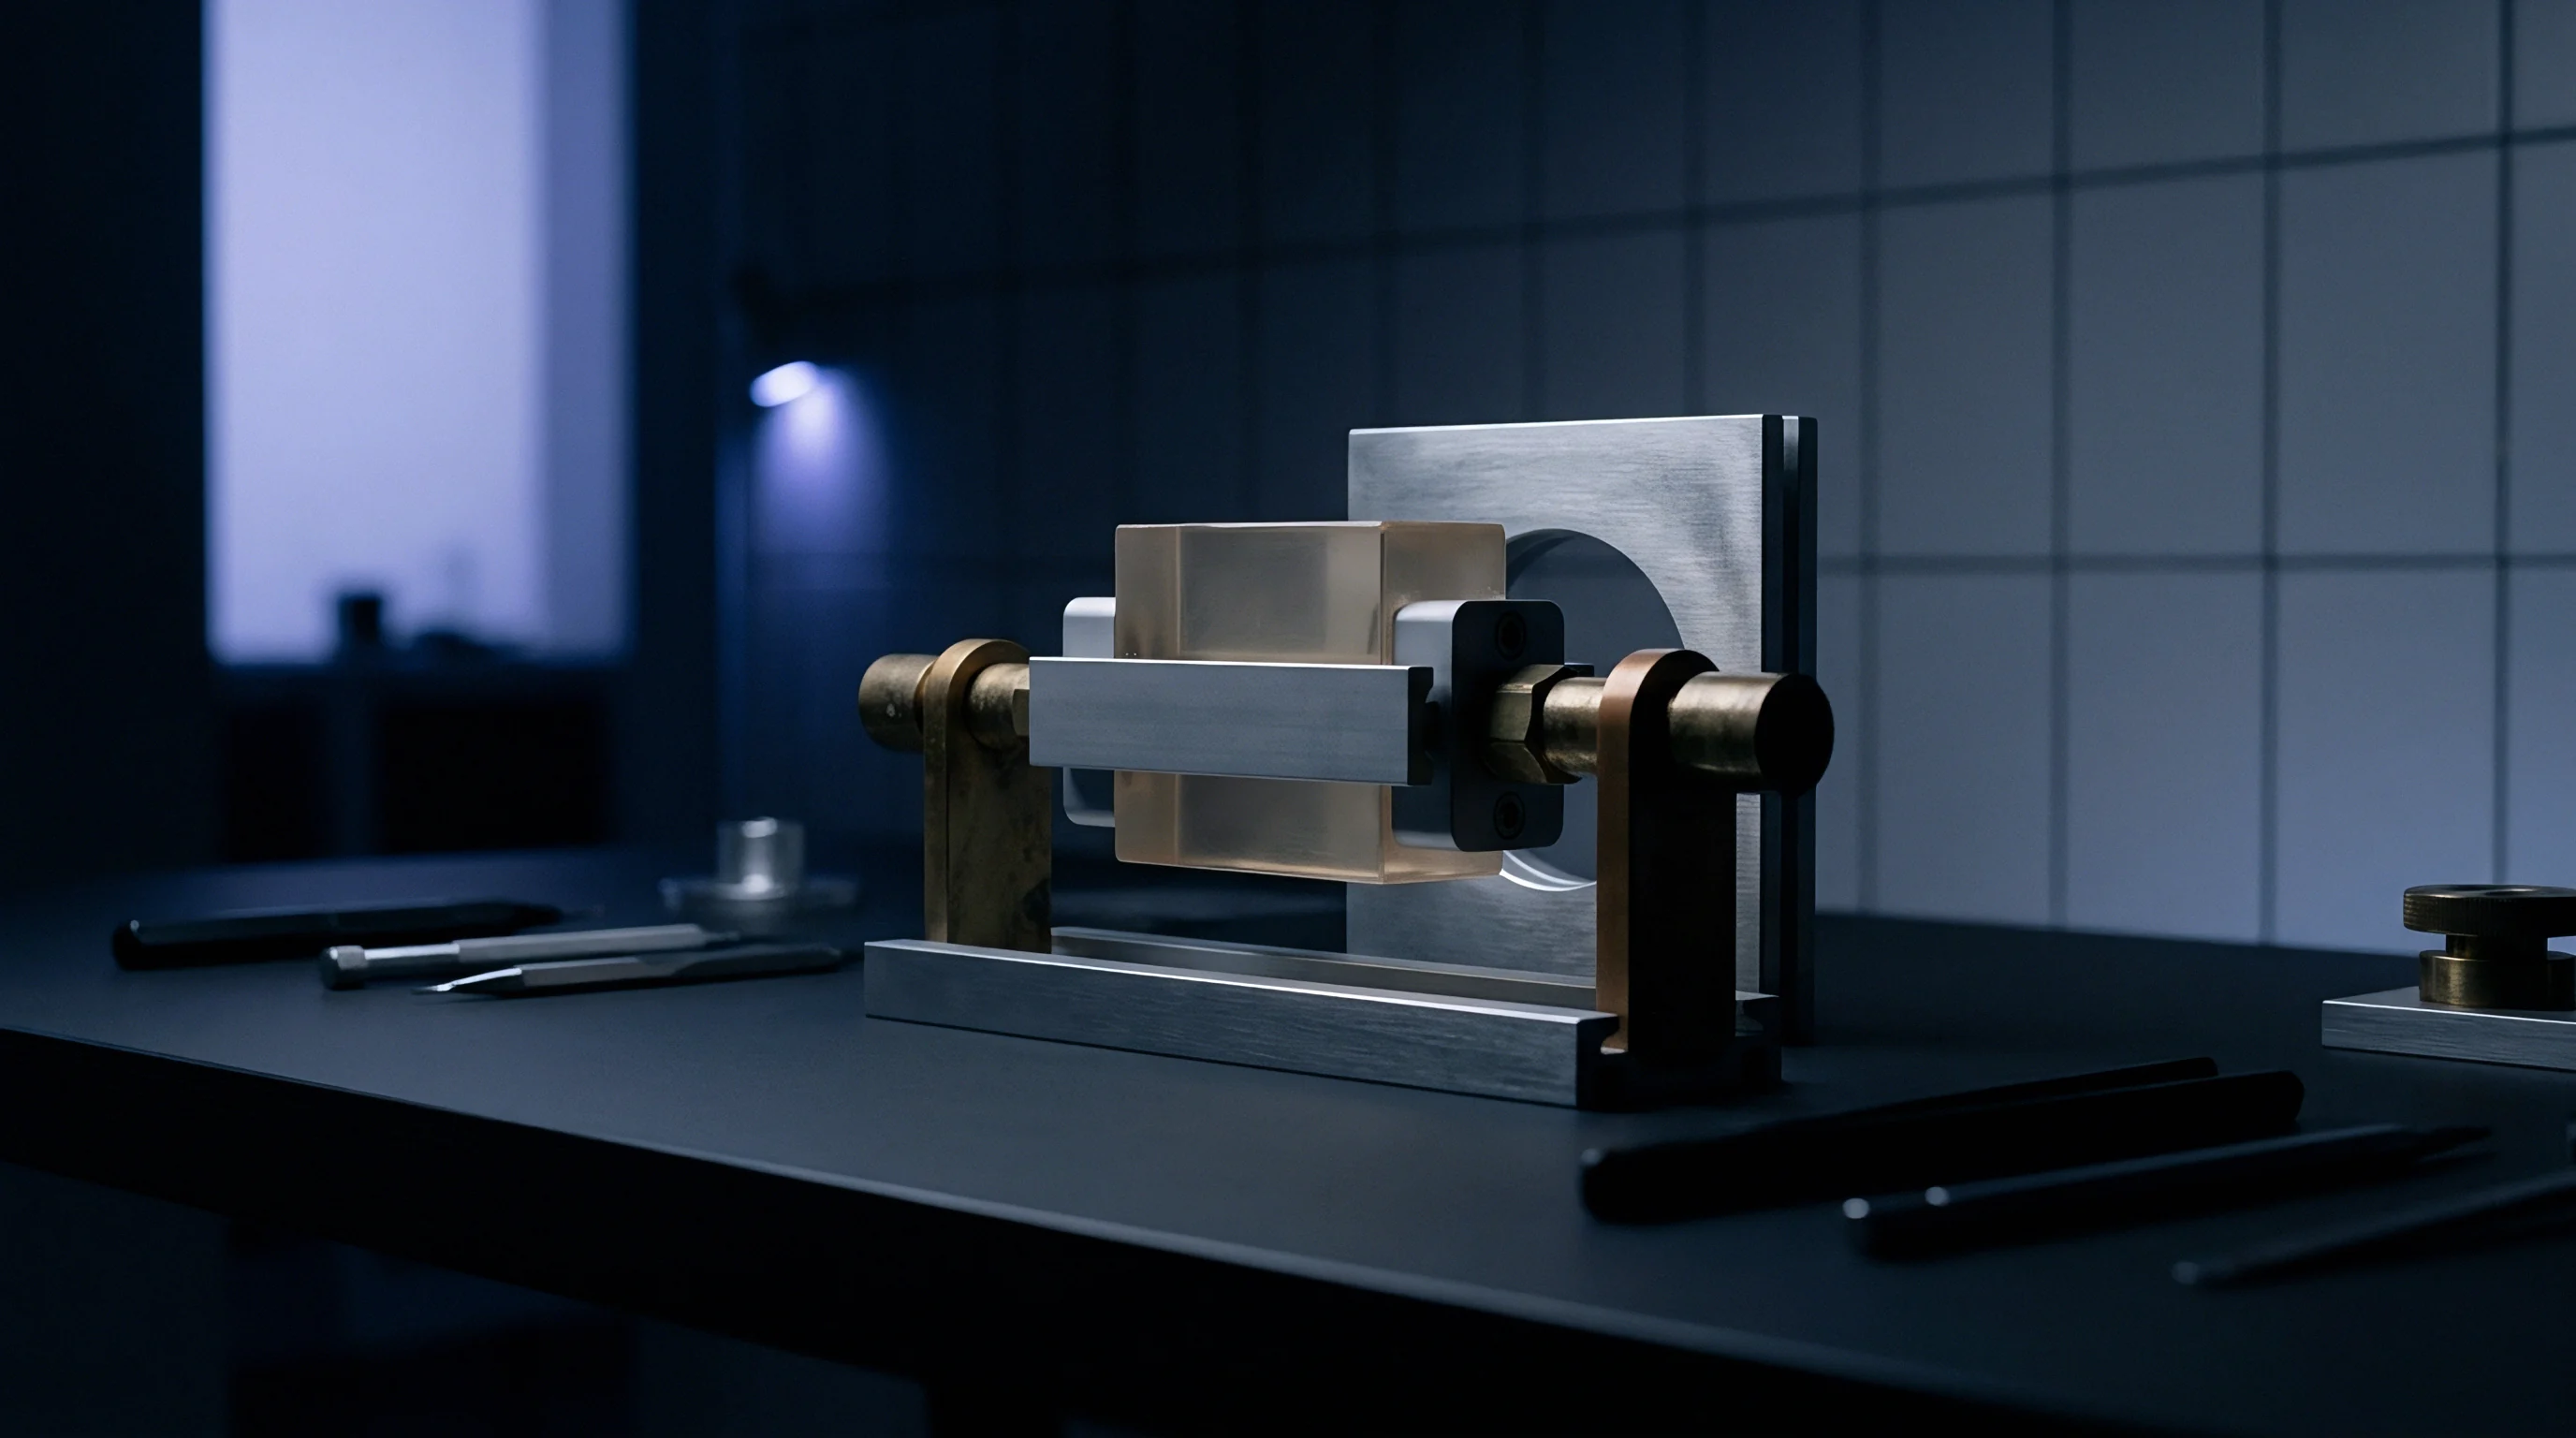
Why Do Polymer Dielectric Tolerances Derail Automotive Radar Grant Approvals?
Automotive radar systems operating under FCC Part 95.333 and ETSI EN 301 091-1 rely on precise antenna beam patterns to satisfy directional radiation rules and avoid out-of-band interference. Sensor housings use plastic front covers as protective radomes, incorporating focusing lenses or frequency-selective surface structures into the mold. If resin permittivity strays more than 1.5 percent from design targets, antenna impedance matching degrades, shifting operating beam angles and lowering main-lobe gain.
A drop in main-lobe gain forces radar transmitters to increase output power to maintain detection range, risking non-compliance with maximum equivalent isotropically radiated power limits. Conversely, beam pattern broadening elevates off-axis emissions beyond out-of-band mask limits at allocation edges. Compliance failures during final grant testing halt product shipments, requiring mold tool re-machining or resin reformulation to correct dielectric misalignments.
Host manufacturers face compliance challenges when mounting pre-certified radar modules behind custom vehicle bumpers or emblem covers. Bumper paints containing metallic flake pigments alter local complex permittivity, introducing phase front aberrations that detune radar sensor arrays. Module grants require host integration guidelines specifying clear dielectric permittivity ranges and maximum allowable thickness variations for bumper materials covering the sensor aperture.
Permissive change procedures govern approval updates when host manufacturers switch radome polymer suppliers or molding facilities. A Class II permissive change filing under FCC rules requires submitting updated radiation pattern measurements and radiated spurious emission test reports showing that new material suppliers do not degrade compliance margins. Performing free-space dielectric qualification on incoming polymer lots verifies material equivalence before running expensive full-vehicle chamber tests.
In accordance with ETSI EN 301 091-1 Clause 7.1.2, any modification to the radome material composition or geometric profile that increases equivalent isotropically radiated power by more than 1.0 dB invalidates existing compliance test records and mandates full radiated re-certification of the transmitter assembly.
Qualification
Supplier Attestation Audits and Certificate Scope Bounds
Procuring polymers for millimetre-wave applications requires reviewing supplier material declarations, datasheet values, and certificate of analysis scopes. Standard datasheets often list dielectric properties measured at 1 MHz or 1 GHz using ASTM D150 capacitive methods. Extrapolating low-frequency dielectric constants to 77 GHz or 94 GHz introduces significant error, because relaxation modes, filler resonances, and resin anisotropy produce vastly different constitutive parameters at millimetre-wave frequencies.
Qualifying incoming polymer shipments requires laboratory verification reports generated via accredited free-space W-band test methods. Compliance engineers verify that testing laboratories hold ISO/IEC 17025 accreditation scopes explicitly listing millimetre-wave free-space dielectric measurement procedures. Test reports must detail sample preparation metrics, ambient test conditions, VNA calibration protocols, and full measurement uncertainty budgets to support regulatory technical files.
- Material Lot Traceability Certificates trace raw polymer resin batches from chemical synthesis plants through compounders and final extrusion lines, confirming consistent additive loading.
- W-Band Dielectric Characterization Reports supply complex permittivity and loss tangent curves across the full 75 GHz to 110 GHz band, establishing baseline material performance.
- Environmental Reliability Test Dossiers document dielectric stability following thermal shock, UV degradation, moisture absorption, and chemical exposure stress testing.
- Host Integration Guidelines define acceptable thickness, surface planarity, and permittivity tolerance bands for host radome assembly manufacturing.
Material qualification records form an integral part of technical construction files submitted to Notified Bodies for European CE marking under the Radio Equipment Directive. Technical documentation must demonstrate that material property variations do not cause production units to exceed essential radio spectrum requirements. Maintaining verified dielectric test documentation protects manufacturers during post-market surveillance audits by national spectrum authorities.
Procurement specifications translate regulatory safety margins into clear incoming inspection metrics for polymer suppliers. Contracts mandate lot-by-lot free-space sample testing for critical dielectric parameters, establishing financial remedies and lot rejection rights if incoming resin batches breach real permittivity tolerances. Rigorous material qualification protects manufacturing schedules and prevents unexpected regulatory compliance failures.
Filing Schedules and Retest Cost Models
Market access timelines for W-band radio products depend directly on execution efficiency during material qualification and regulatory compliance testing stages. Unintended retests caused by uncharacterized dielectric variations introduce long delays into launch schedules. Booking chamber time at accredited testing facilities requires lead times of four to eight weeks, making chamber availability a major bottleneck during new product introductions.
| Filing Phase | Standard Timeline (Weeks) | Retest Delay (Weeks) | Direct Chamber Cost (USD) | Operational Risk Level |
|---|---|---|---|---|
| Material Bench Qualification | 1 to 2 | 1 | $2,500 | Low: Bench testing catches lot errors early |
| Pre-Scan Chamber Validation | 1 to 2 | 2 to 3 | $6,000 | Medium: Detuned antennas identified prior to filing |
| Formal Compliance Testing | 2 to 4 | 6 to 10 | $18,000 | High: Failures void scheduled lab slots |
| Grant Permissive Change Filing | 3 to 6 | 4 to 8 | $8,500 | High: Product launch delayed pending grant update |
Financial risk models calculate the total cost of compliance failures by combining direct laboratory fees, engineering redesign costs, and market delay penalties. Standard W-band compliance test suites cost between $15,000 and $30,000 per sample submission, depending on the scope of spurious emission scans and directional gain evaluations. Failing a compliance scan due to radome detuning forfeits the lab fee while requiring mold tooling adjustments that add $25,000 to $60,000 in re-tooling costs.
Market entry delays carry severe financial consequences in competitive automotive and industrial technology sectors. Missing an OEM vehicle platform launch date due to delayed radio approvals triggers contractual late-delivery penalties and risks losing design wins to qualified competitors. Spending $3,000 on upfront free-space dielectric material testing provides cheap insurance against regulatory retests that can disrupt product launch dates.
Strategic compliance planning sequences material qualification steps to minimize schedule risk. Sourcing teams perform free-space dielectric testing on prototype resin slabs before cutting injection mold steel, verifying material properties prior to tooling commitment. Validating materials early allows design teams to adjust radome wall thickness and lens geometry, ensuring target antenna patterns are achieved on the first compliance pass.
Establishing clear material qualification protocols aligns engineering design, procurement sourcing, and regulatory compliance teams toward common launch milestones. Rigorous free-space material testing provides the empirical foundation needed to secure global market approvals, ensuring millimetre-wave radio products deliver high performance while meeting international spectrum regulations.