Automotive Radar Radome Reflection Minimization via Precise Dielectric Characterization
Precise W-band dielectric characterization suppresses radome reflection, preventing boresight errors and eliminating costly regulatory recertification cycles.

Resin
Thermoplastic compounds used in front-facing automotive radar covers operate between 76 GHz and 81 GHz. At these millimetric frequencies, free-space wavelengths range from 3.70 mm to 3.95 mm, meaning small material variations directly alter wave propagation through the radome. Resin selection depends on measuring two key parameters at 77 GHz: real relative permittivity (dielectric constant, Dk) and dissipation factor (loss tangent, Df).
Together, these properties determine phase velocity, internal reflections, and signal absorption of transmitted FMCW chirps.
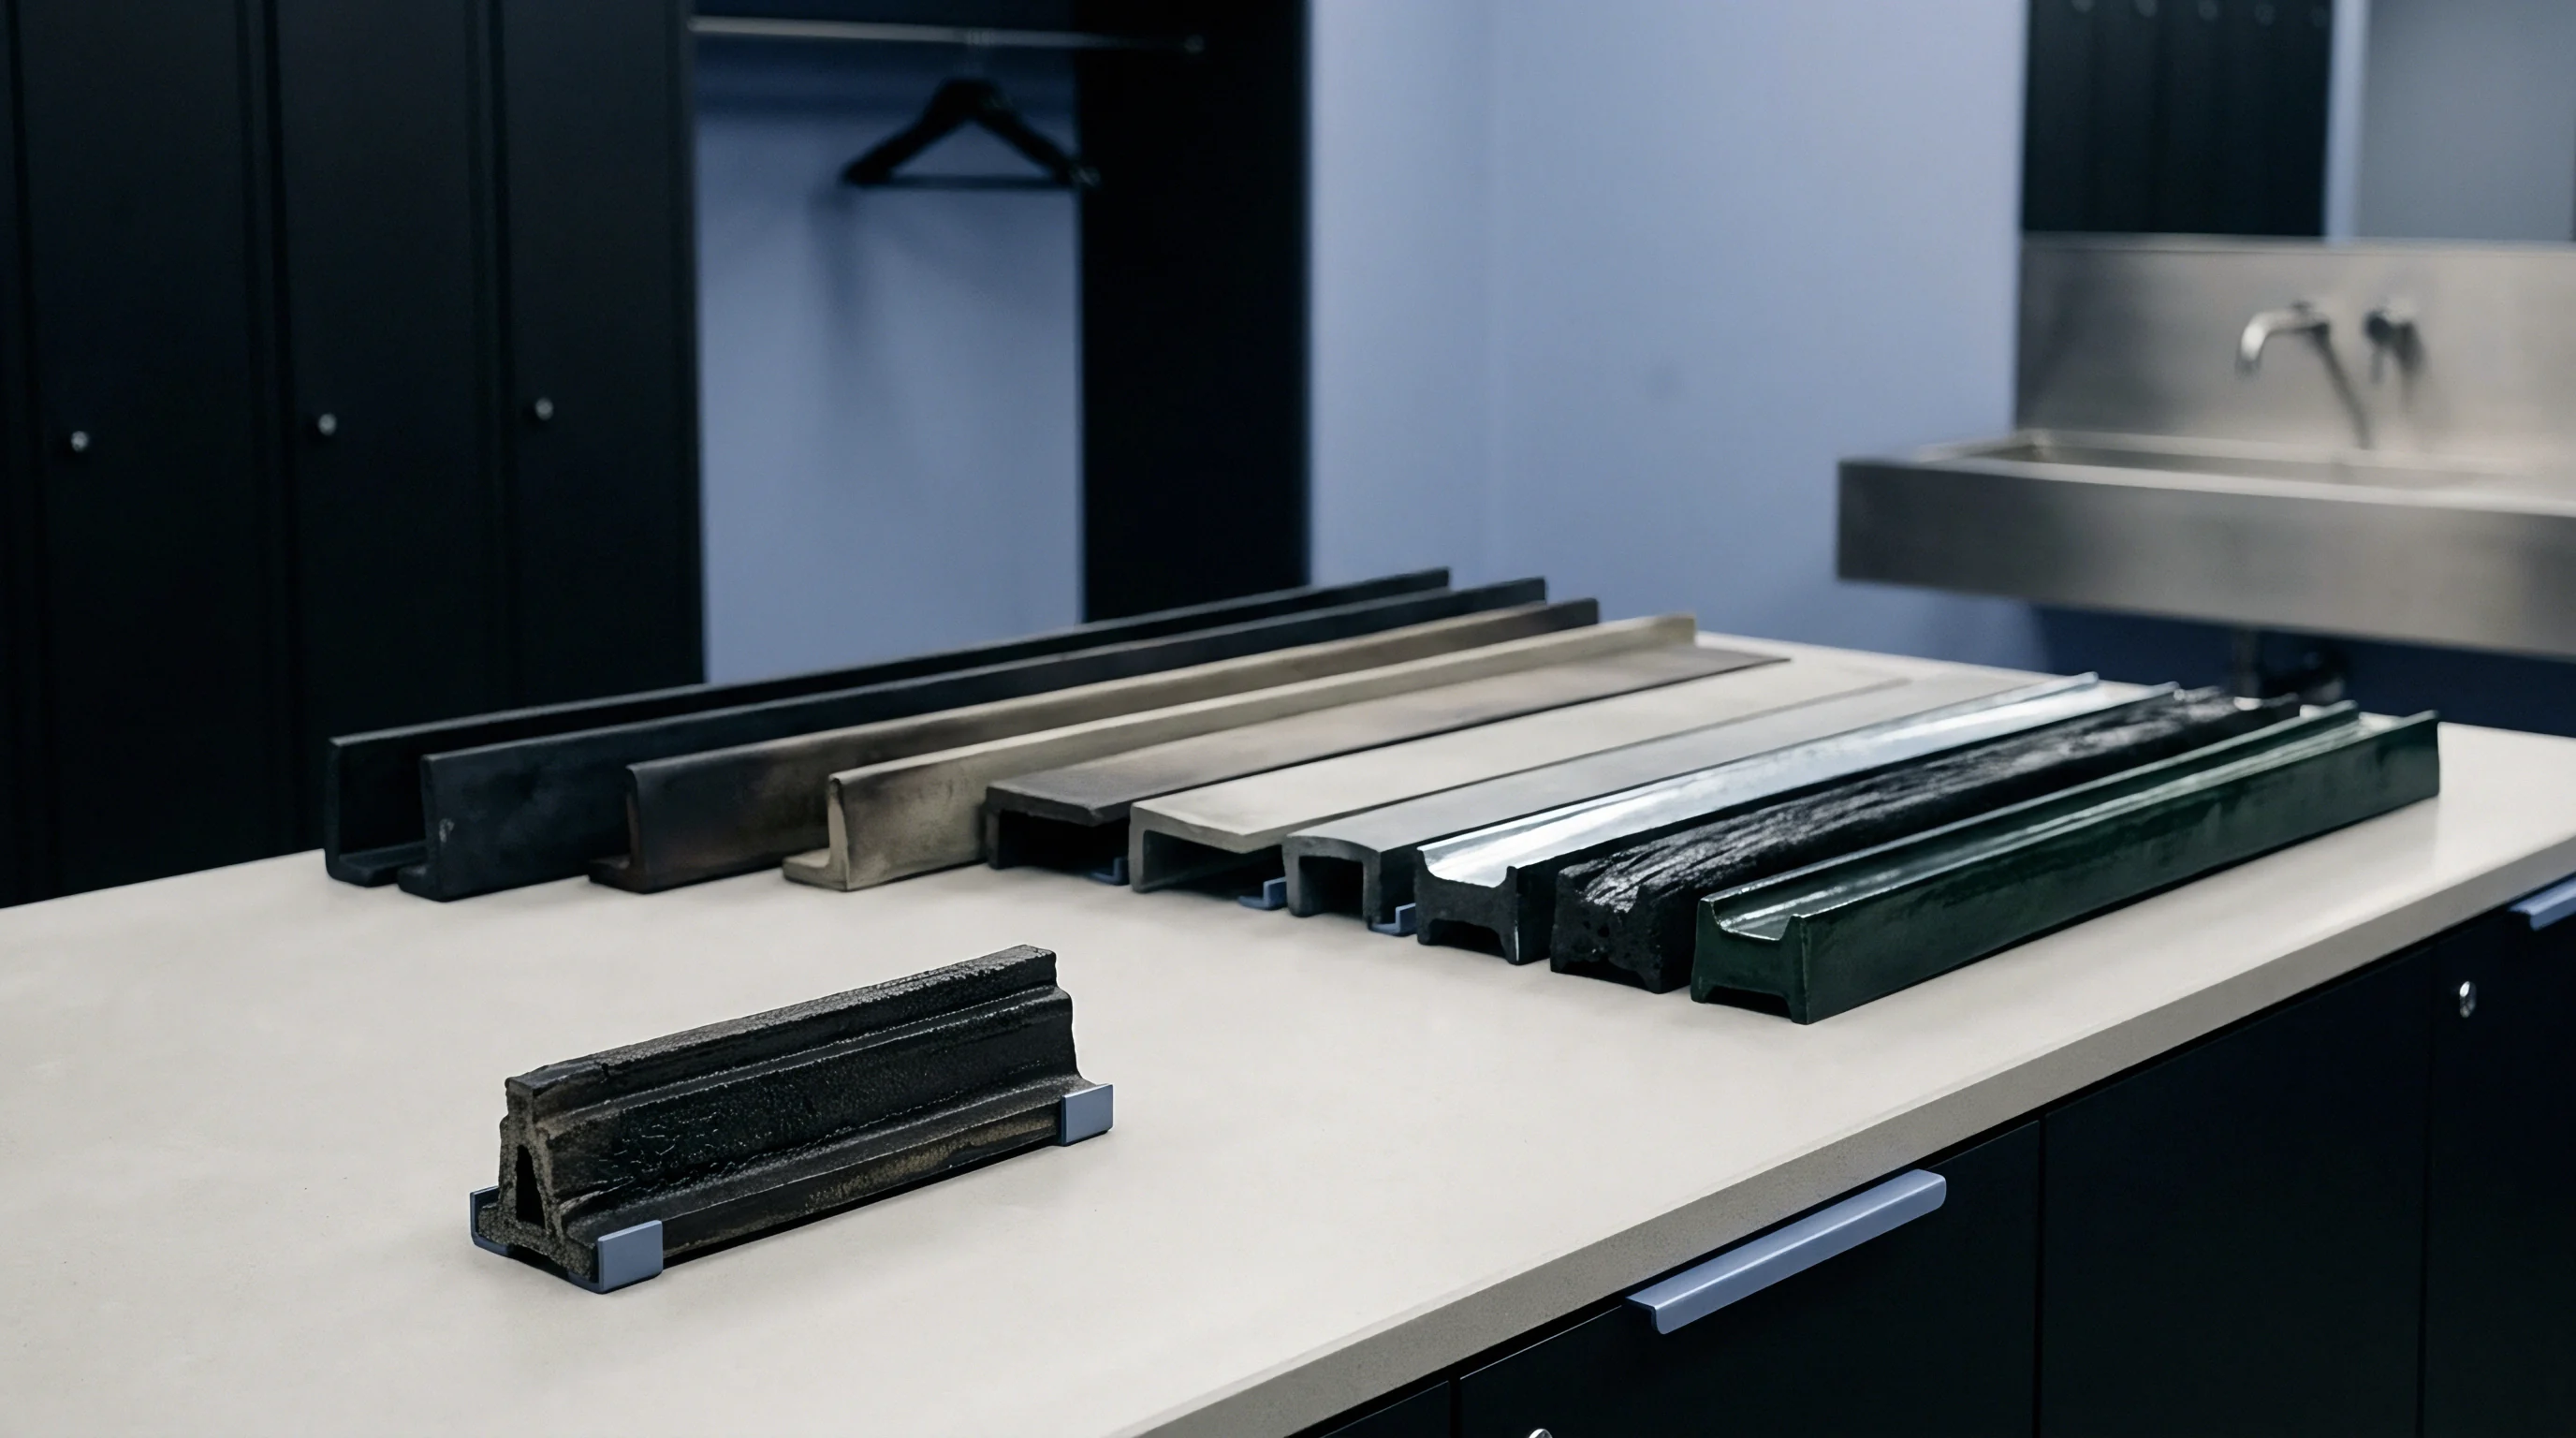
Polybutylene terephthalate, polycarbonate, liquid crystal polymers, and polyetheretherketone form the main resin families used in automotive sensor housings. Adding glass fibers or mineral fillers increases structural rigidity and better matches the thermal expansion of aluminum chassis backplates. Fiber loading, however, creates localized dielectric variations.
Glass fibers have a dielectric constant near 6.2 at 77 GHz, while unfilled base polymers fall between 2.3 and 2.9. Fiber alignment along mold flow paths also causes anisotropy: waves polarized parallel to the flow encounter a higher effective permittivity than those polarized orthogonally.
Hydrophobic resin blends maintain predictable dielectric properties across ambient humidity shifts while hydrophilic polymers require constant moisture compensation.
Moisture absorption is another primary source of dielectric drift in the field. Polybutylene terephthalate and polycarbonate can absorb up to 0.4 percent water by weight in humid air. Because polar water molecules have a real relative permittivity near 34 at 77 GHz, absorbed water raises the overall dielectric constant of the molded wall and increases signal loss.
A 0.2 percent gain in water weight adds up to 1.8 dB of two-way attenuation through a standard half-wavelength wall, cutting maximum detection range in long-range radar systems.
Molding strain also alters local permittivity. Variables like melt temperature, holding pressure, and cooling rate change material density across the radome face. Even unfilled resins show density shifts of up to 3.5 percent between the gate and end-of-fill regions.
Denser areas carry higher dielectric constants, distorting wavefront symmetry across the antenna aperture and introducing phase shifts that degrade azimuth target calculations in digital beamforming algorithms.
| Polymer Compound | Dielectric Constant (Dk) | Loss Tangent (Df) | 24-Hour Water Absorption (%) | Isotropic Consistency |
|---|---|---|---|---|
| Unfilled PBT | 2.88 | 0.0055 | 0.08 | High |
| PBT with 30% Glass Fiber | 3.42 | 0.0082 | 0.15 | Low |
| Unfilled Polycarbonate | 2.82 | 0.0068 | 0.20 | Medium |
| Unfilled Polyetherimide | 3.15 | 0.0025 | 0.25 | High |
| Liquid Crystal Polymer | 3.20 | 0.0018 | 0.02 | Very Low |
Designing a radome wall starts with identifying potential polymer failure modes in W-band operation, which can compromise both RF performance and long-term mechanical integrity.
- Anisotropic Permittivity Shift occurs when directional glass fiber orientation creates unequal propagation velocities for horizontal and vertical field polarizations.
- Hydrophilic Attenuation Elevation occurs when atmospheric moisture absorption increases the material dissipation factor, causing direct power loss at 77 GHz.
- Thermal Expansion Mismatch occurs when elevated structural expansion rates alter wall thickness dimensions relative to internal electrical wavelengths.
- Environmental Stress Cracking occurs when exposure to road salts or washer fluids degrades polymer surface integrity, creating micro-fractures that scatter RF energy.
Batch-to-batch permittivity variations that exceed published datasheet tolerances often occur because raw materials are manufactured to standard melt-flow index specifications rather than high-frequency optical standards.

Gauge
Single-layer reflection suppression depends on sizing the physical wall to an exact half-wavelength based on propagation velocity in the medium. When an un-matched dielectric boundary meets a planar electromagnetic wave, reflections generate at both front and rear surfaces. Destructive interference cancels these reflections when front- and back-surface waves are equal in magnitude and 180 degrees out of phase.
For normal incidence, this resonant thickness depends on operating frequency and dielectric constant.
Calculating the half-wavelength thickness inside the material determines the resonant wall dimension. Internal wavelength equals the free-space wavelength divided by the square root of the dielectric constant, with physical wall thickness set to integer multiples of this value. At 77 GHz, free-space wavelength is 3.89 mm.
In an unfilled polybutylene terephthalate substrate with a dielectric constant of 2.88, the internal wavelength measures 2.29 mm, yielding a primary resonant half-wavelength thickness of 1.146 mm.

Single Layer Half Wavelength Resonant Matching
Destructive interference between front and back reflections requires the internal phase length to equal half the operating wavelength. Any deviation from this dimension degrades performance: a 50-micrometer thickness error shifts the reflection minimum away from 77 GHz by roughly 3.2 GHz. At the design center frequency, return loss degrades from -28 dB to -14 dB, reflecting four percent of transmitter power back toward the array.
Temperature shifts also affect resonant dimensions. Thermoplastics have positive thermal expansion coefficients between 50 and 110 ppm per degree Celsius, so temperature swings from -40 degrees Celsius to +105 degrees Celsius alter wall thickness by up to 15 micrometers. As temperature rises, thermal expansion reduces material density, lowering the dielectric constant.
Together, these effects drift the reflection null across operating limits and narrow the usable RF bandwidth.
Multi Layer Impedance Gradient Engineering
Broadening transmission bandwidth across the 5 GHz band requires intermediate dielectric layers between air and the structural substrate. Quarter-wavelength layers act as impedance transformers, where the ideal permittivity equals the square root of the product of adjacent dielectric constants. For an air-to-PBT interface, this target dielectric constant is near 1.70, which can be provided by microcellular foams, expanded fluoropolymers, or low-density composites.
A twenty-micrometer variance in wall thickness shifts the reflection minimum by 2.4 GHz in polybutylene terephthalate substrates operating at 77 GHz.
A symmetrical three-layer sandwich uses a central structural core flanked by two outer quarter-wave skins. These skins soften the wave impedance step at the air interface, lowering boundary reflection coefficients. This structure keeps reflection coefficients below -20 dB across 76 GHz to 81 GHz, providing margin against manufacturing tolerances and thermal shifts.
Worked Calculations for Wall Thickness Tolerances
A polybutylene terephthalate slab with a nominal dielectric constant of 2.88 illustrates how return loss responds to physical variations. At a center frequency of 78.5 GHz (free-space wavelength of 3.819 mm), the nominal half-wavelength thickness is 1.125 mm. Standard high-precision injection molding controls wall thickness within plus or minus 25 micrometers.
Three manufacturing cases represent lower limit, nominal, and upper limit gauges.
Case A models a thin wall at 1.100 mm. The shorter path length shifts optimal reflection cancellation upward to 80.3 GHz, increasing the reflection coefficient magnitude at 78.5 GHz to S11 = 0.141 (a return loss of -17.0 dB). Case B models the nominal 1.125 mm wall, where destructive interference gives an S11 magnitude of 0.022 and a return loss of -33.1 dB.
Case C models a thick wall at 1.150 mm. The extra path length drops the cancellation frequency to 76.8 GHz, degrading return loss at 78.5 GHz to -16.8 dB.
| Parameter | Case A (-25 µm) | Case B (Nominal 1.125 mm) | Case C (+25 µm) |
|---|---|---|---|
| Physical Thickness | 1.100 mm | 1.125 mm | 1.150 mm |
| Resonant Frequency | 80.3 GHz | 78.5 GHz | 76.8 GHz |
| Reflection Coefficient (|S11|) | 0.141 | 0.022 | 0.145 |
| Return Loss (S11) | -17.0 dB | -33.1 dB | -16.8 dB |
| Transmission Loss (S21) | -0.52 dB | -0.18 dB | -0.55 dB |
| Insertion Phase Error | -8.2 deg | 0.0 deg | +8.5 deg |
Tight control over molding process variables keeps wall gauge deviations within required tolerances.
- Mold Cavity Steel Dimensions must incorporate resin volumetric shrinkage factors verified at 77 GHz rather than relying on room-temperature defaults.
- Injection Packing Pressure Profiles maintain uniform melt density across flow paths to prevent spatial wall thickness variations.
- Mold Tool Thermal Zoning controls local cooling rates to prevent non-uniform sinking and post-molding warpage.
- Raw Material Pre-Drying Routines prevent moisture-induced viscosity drops that lead to flashing or filling instability during injection.
Deviating from calculated matching dimensions by more than twenty micrometers causes strong aperture reflections that reduce radar detection range and can force costly mold re-machining.
Chamber
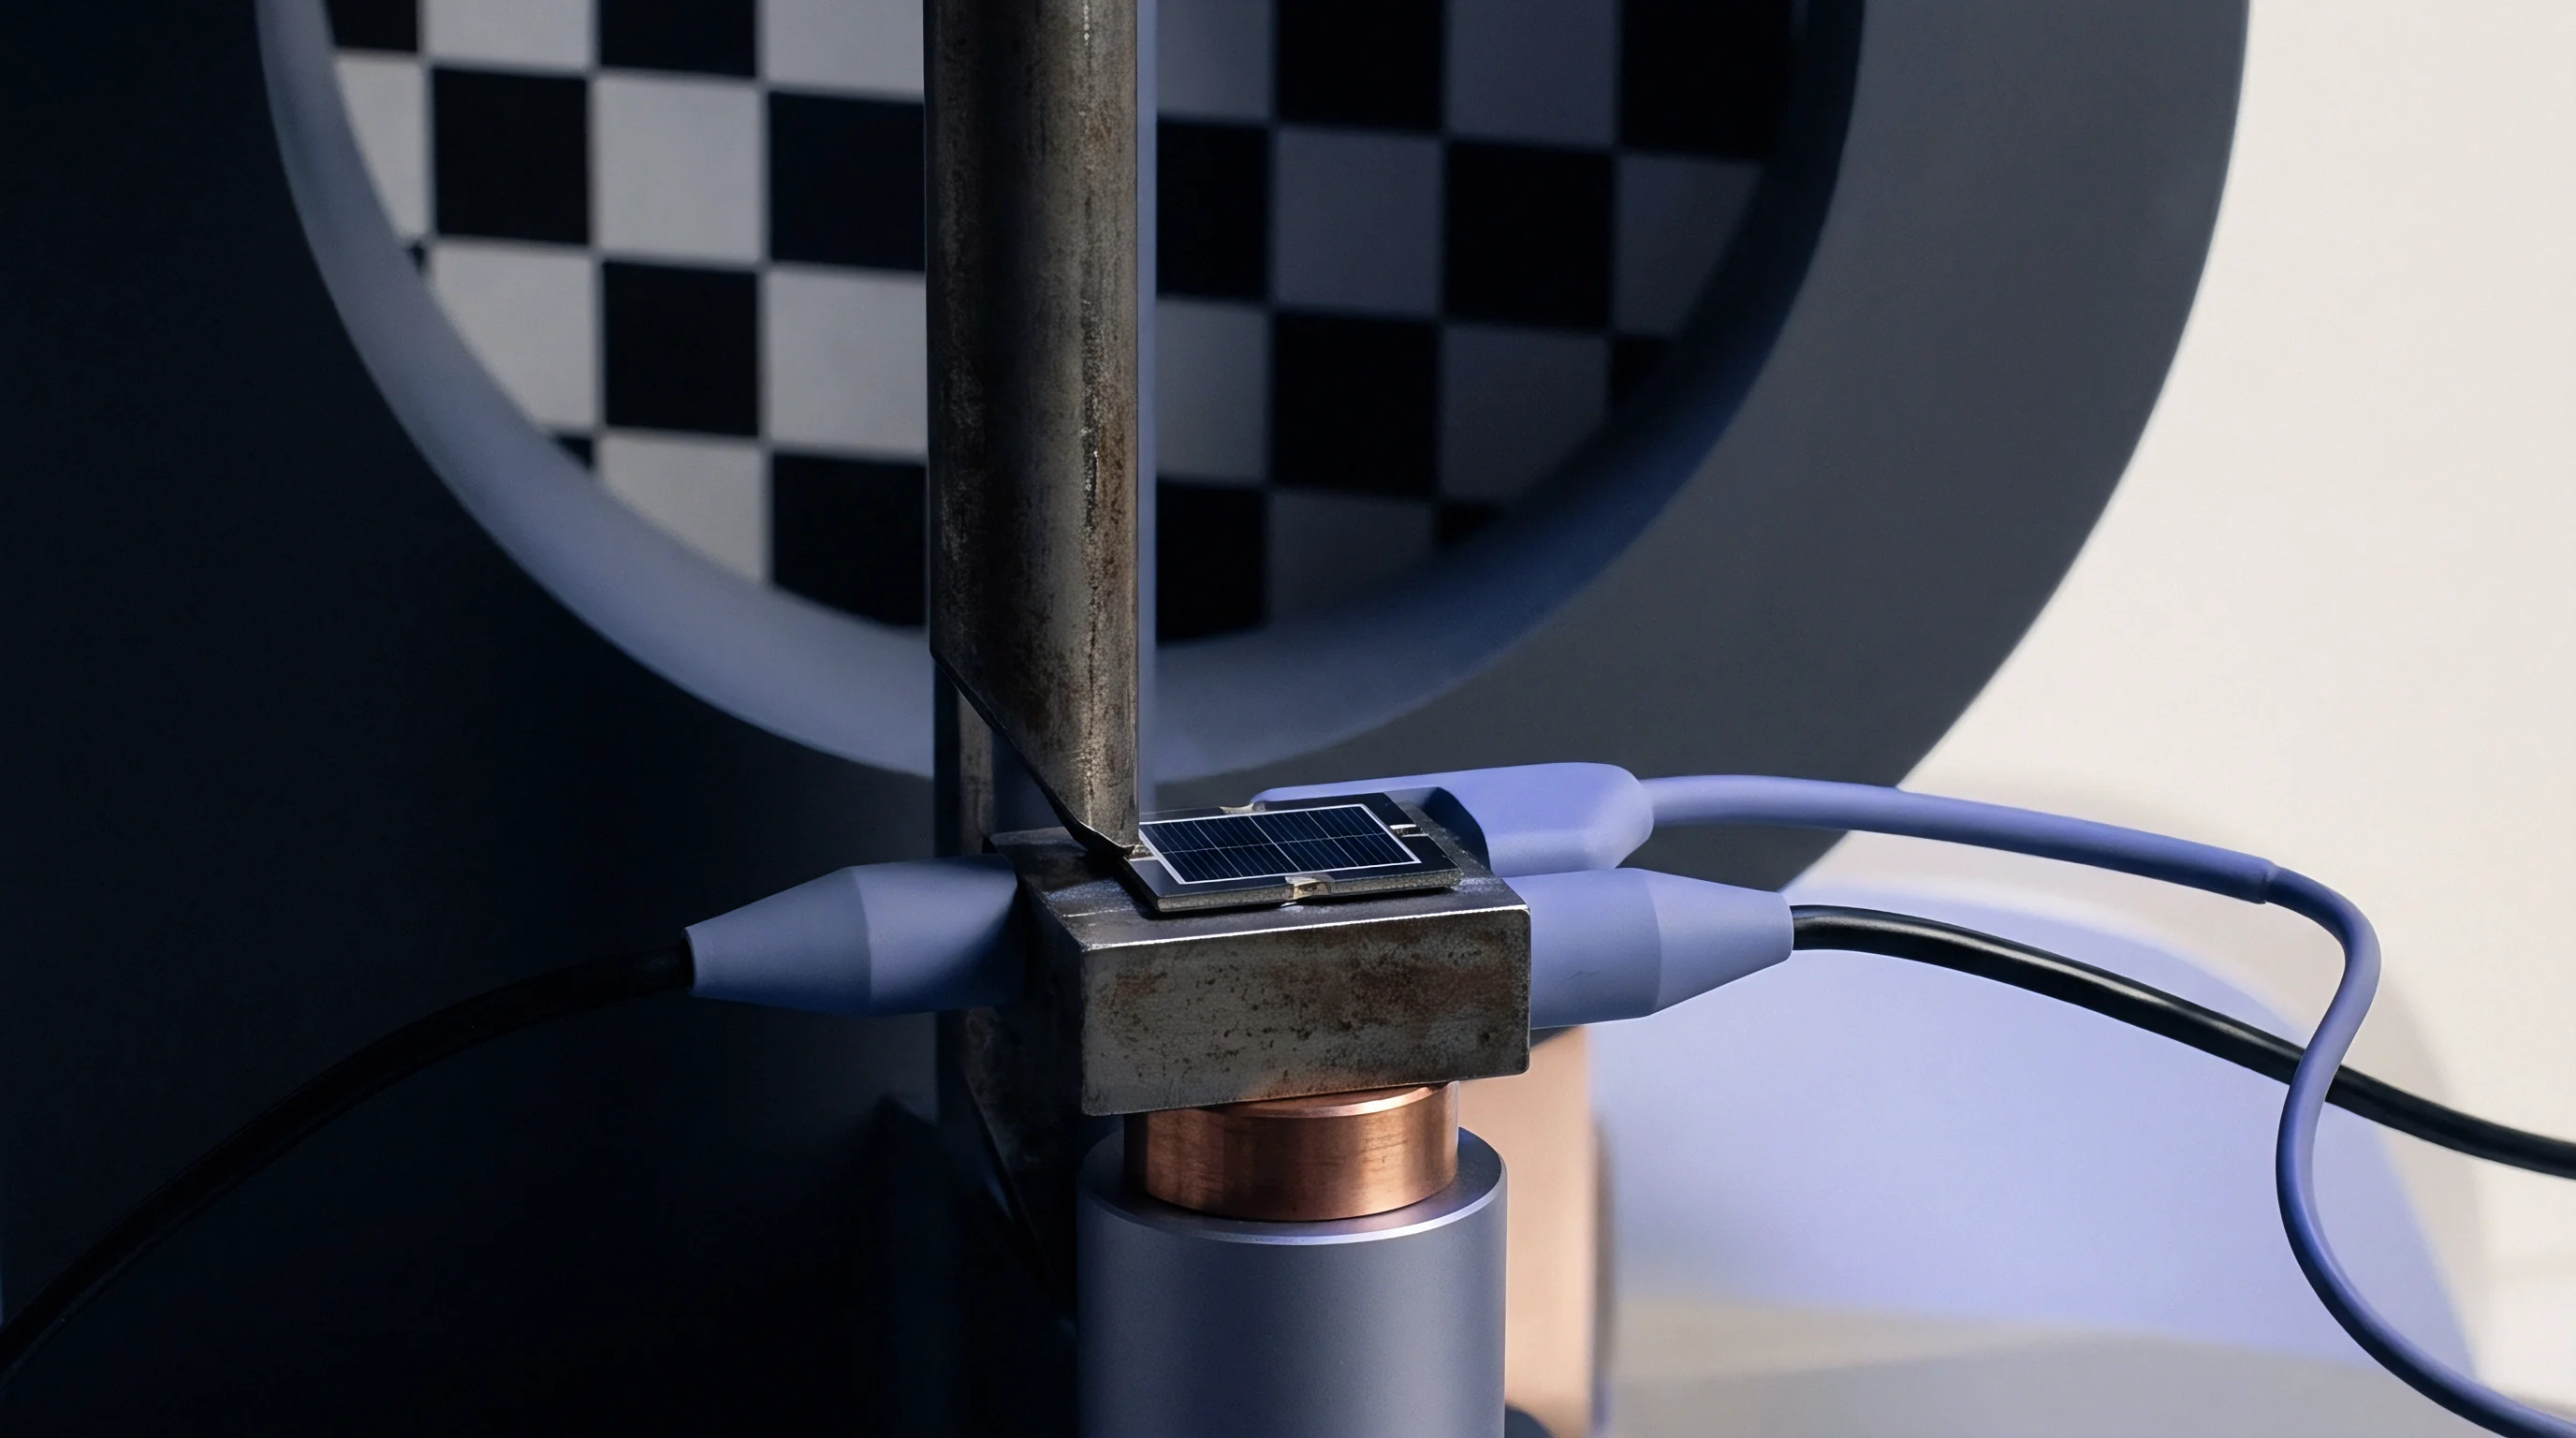
Precise metrology at 79 GHz requires specialized RF test setups to isolate subtle dielectric shifts. Low-frequency contact probes fail at W-band frequencies because of parasitic capacitance, surface roughness, and positioning errors. Characterizing radome materials instead requires non-destructive free-space quasi-optical benches or resonant cavity fixtures that can extract complex permittivity (varεr’ – jvarεr”) with high repeatability.
Focused Beam Quasi Optical Metrology Setups
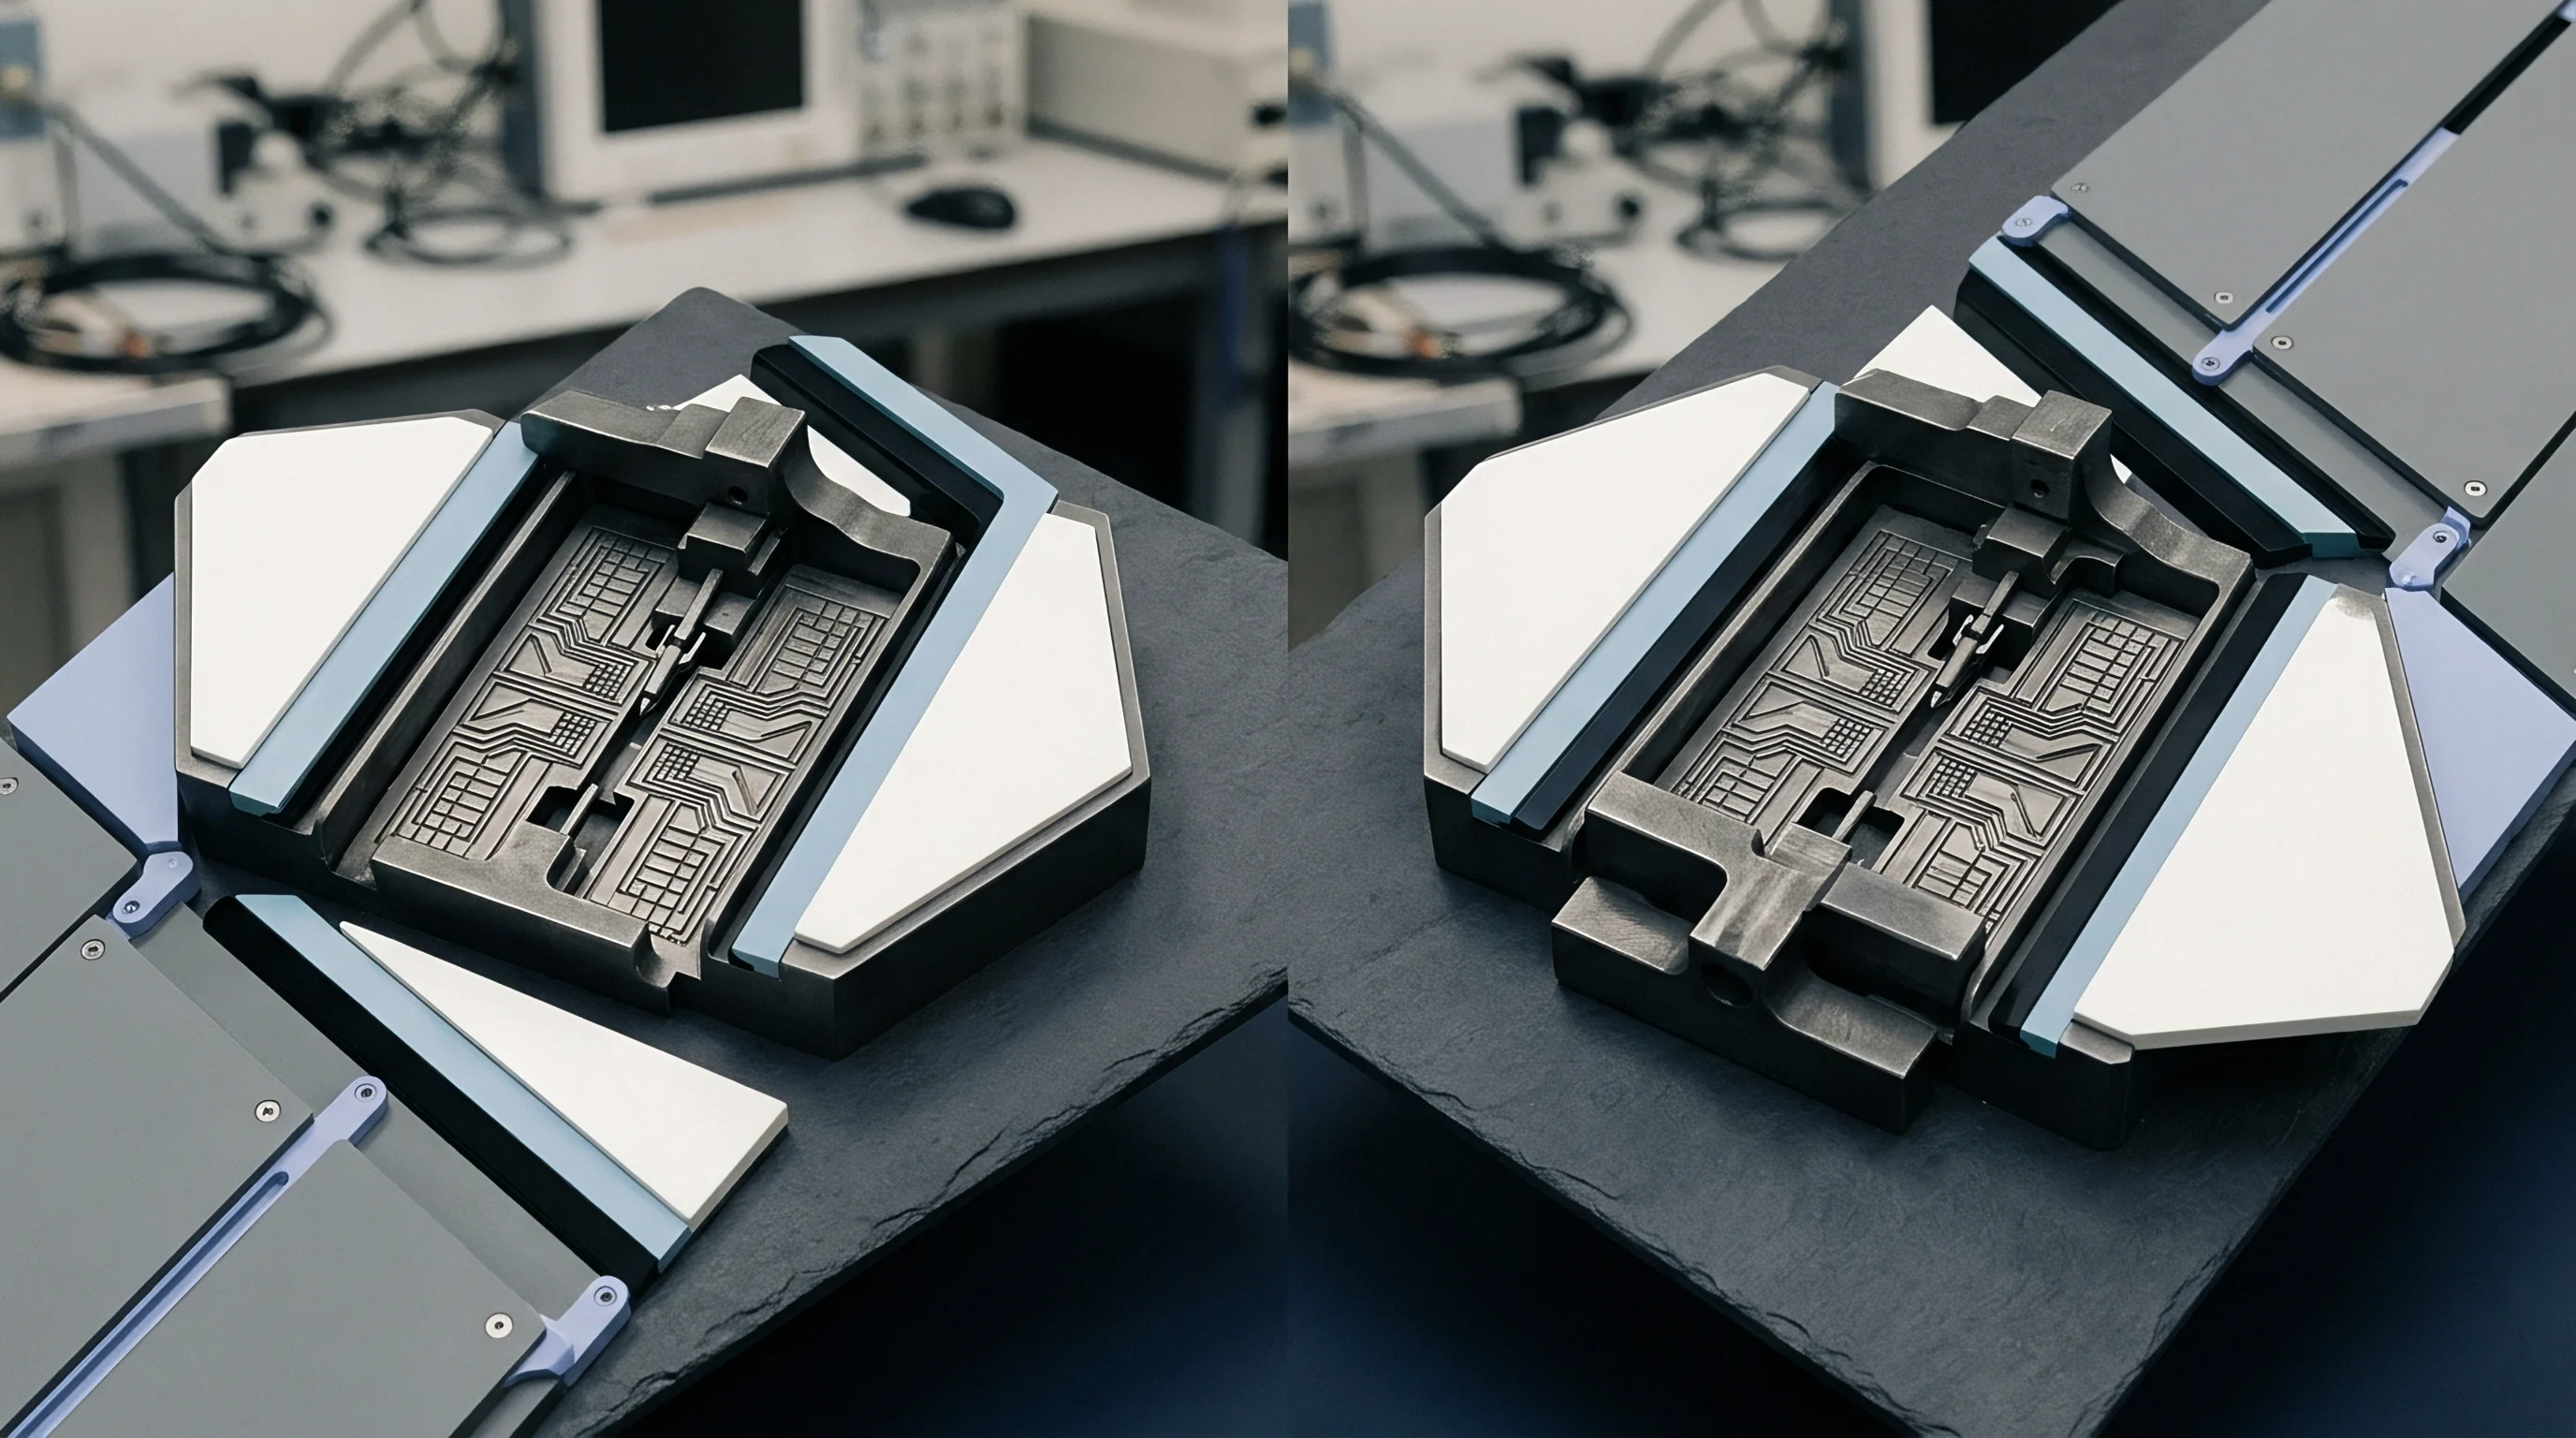
Gaussian beam spots focused through dielectric lenses isolate flat sample plaques from frame diffraction. Two corrugated horn antennas with planoconvex teflon lenses create a focused beam waist at the sample plane. To prevent edge diffractions from corrupting transmission metrics, beam spot diameter must remain under half the plaque width.
A two-port vector network analyzer connected through WR-10 rectangular waveguides measures complete scattering parameters (S11, S21, S12, S22) from 75 GHz to 110 GHz.
Accurate free-space measurements depend on rigorous calibration. Thru-Reflect-Line or Thru-Reflect-Match algorithms shift the vector network analyzer reference planes directly to the sample faces, while time-domain gating isolates primary transmission signals from room scattering and lens reflections. Processing measured scattering matrices through iterative conversion routines, such as the Nicholson-Ross-Weir method, extracts real permittivity and loss tangent.
Internal cavity resonance creates narrow band reflection spikes that free-space dielectric measurements on flat plaque samples fail to detect.
Obtaining reliable quasi-optical material measurements requires a systematic calibration and extraction sequence.
- Mount reference corrugated horn antennas onto precision optical rails aligned on a common boresight axis.
- Connect WR-10 frequency extension modules to vector network analyzer test ports using phase-stable coaxial cabling.
- Perform a full two-port free-space Thru-Reflect-Line calibration with precision metallic reflector plates and defined air gaps.
- Insert the un-machined test plaque into the focused beam waist fixture perpendicular to the propagation axis.
- Capture magnitude and phase response curves for all four scattering parameters across 76 GHz to 81 GHz.
- Apply time-domain gating to eliminate residual reflection peaks caused by feed horn mismatch and surrounding structures.
- Run mathematical inversion algorithms to plot real dielectric constant and loss tangent values across frequency.
How Does Temperature Variation Shift Dielectric Constants at 79 GHz?
Thermal expansion and reduced material density drive permittivity down as ambient temperatures rise from -40 to +105 degrees Celsius. Heating a polybutylene terephthalate test plaque inside a temperature-controlled quasi-optical chamber yields a negative temperature coefficient of permittivity (dvarεr / dT) of roughly -4.5 × 10⁻⁴ per degree Celsius. As temperature climbs, lower atomic density reduces electric dipole concentration per unit volume, while increased molecular mobility raises the loss tangent through enhanced absorption.
Measuring this thermal shift requires environmental chambers fitted with low-loss fluoropolymer windows. Testing dielectric parameters in 15-degree increments across the automotive temperature band provides the data needed for temperature-dependent dielectric lookup tables. Thermal compensation routines then adjust target wall thickness to balance high-temperature return loss against low-temperature phase delay.
Engineers continue to evaluate whether high-temperature optical bench calibration standards maintain sufficient phase stability across thermal cycling without fixture expansion biasing the loss tangent measurements.
Phase
Internal reflections inside the radome cover destabilize antenna radiation patterns and degrade azimuth accuracy. Front-facing automotive radars use multiple-input multiple-output (MIMO) patch arrays for digital beamforming. When reflected energy returns from the radome boundary into the radiating elements, it alters the mutual coupling matrix of the array, distorting amplitude and phase across individual channels.

Boresight Error and Spatial Distortion Mechanics
Non-uniform dielectric distributions create unequal phase delays across the array aperture, steering the main beam off target. Boresight error measures the angular offset between the physical mechanical axis and the true electrical beam direction, while boresight error variation tracks how this offset shifts across electronic scan angles. Pointing errors above 0.2 degrees corrupt trajectory prediction models used in automated emergency braking.
Phase center deviation is another failure mode driven by radome reflections. Energy reflected back into the air gap between antenna and radome sets up standing waves that shift the virtual phase centers of individual elements. These phase shifts alter spatial steering vectors in direction-of-arrival algorithms, introducing angle errors and generating ghost targets in radar point clouds.
Antenna Array Coupling and Impedance Pulling
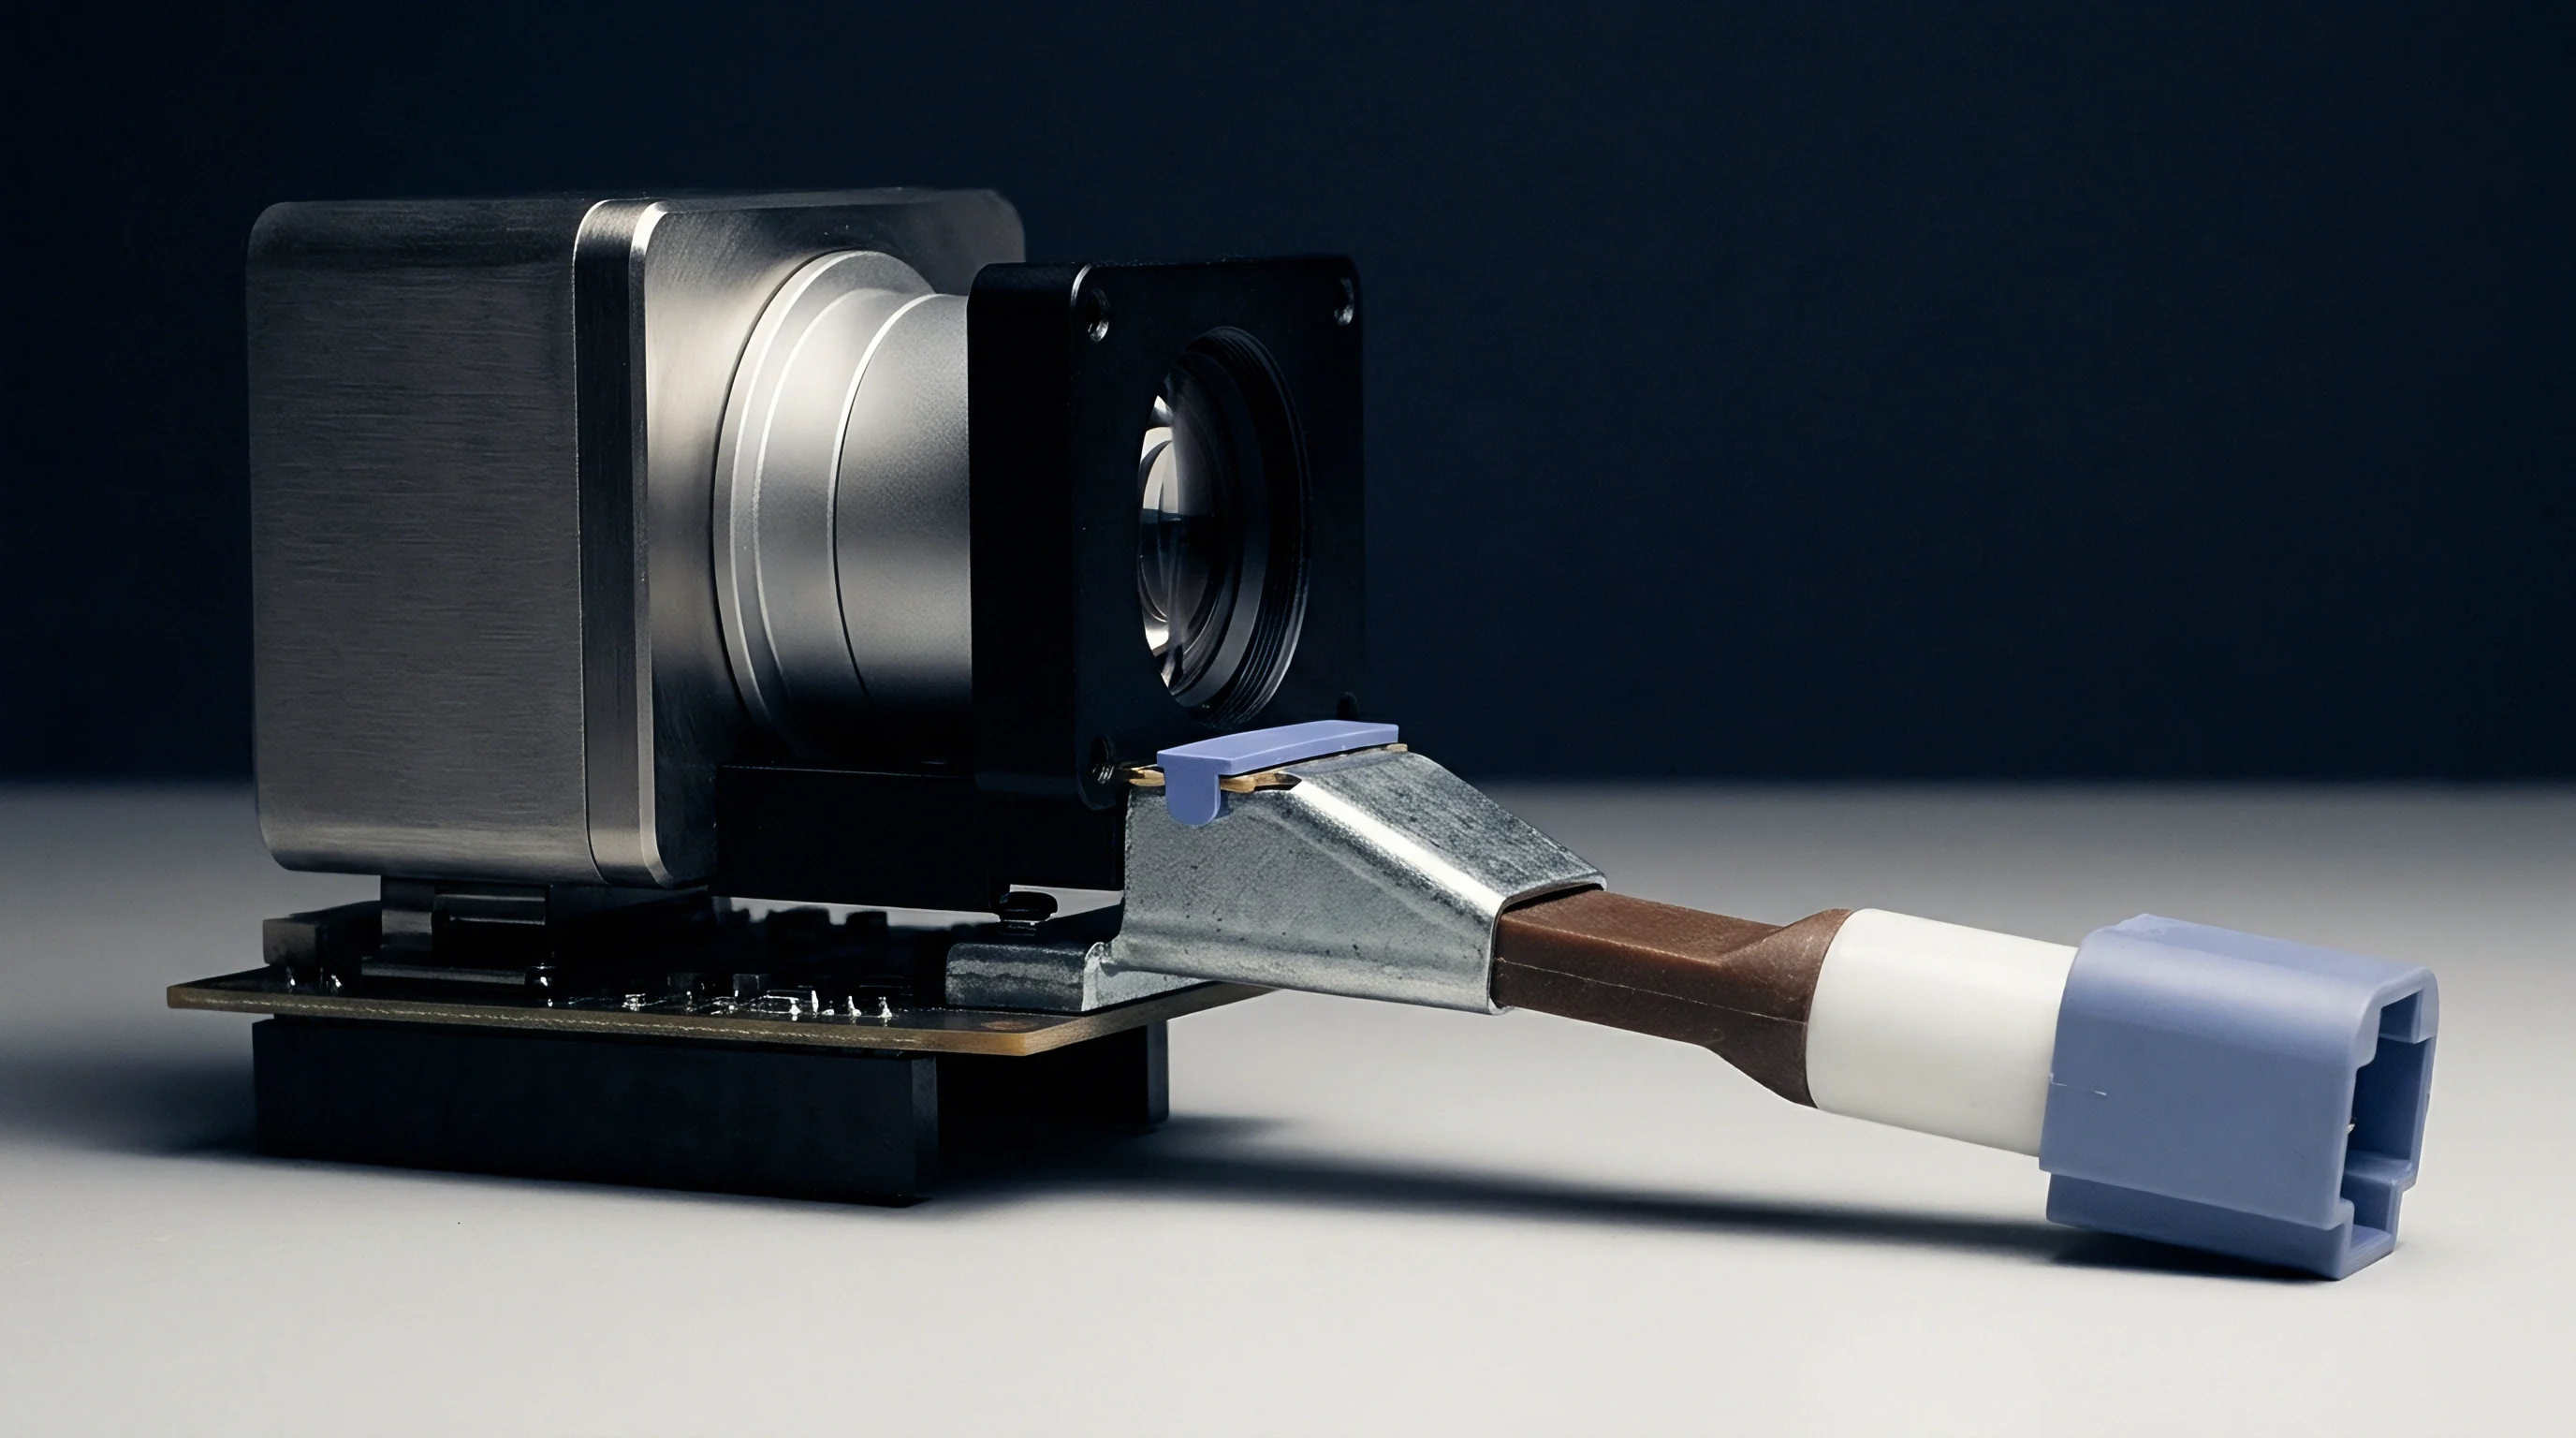
Reflections returning to the antenna radiators pull terminal impedance away from 50 ohms. When reflection levels at the inner wall exceed S11 > -10 dB, the transceiver MMIC sees a mismatched load. This load pulling reduces power amplifier efficiency, raises intermodulation distortion, and induces frequency pulling in the voltage-controlled oscillators driving FMCW chirp generation.
Non-linear chirp slopes degrade range resolution and raise sidelobes. When reflected power destabilizes the transmitter oscillator, the linearity of the 77 GHz to 81 GHz frequency ramp degrades. A higher range noise floor can mask low-RCS targets, like pedestrians or cyclists, positioned near large reflective objects such as trucks or bridge supports.
Radome curvature should maintain normal beam incidence across the main antenna aperture to prevent spatial polarization and phase shifts.

Dossier
Maintaining certified electromagnetic performance throughout production is necessary for international radio regulatory compliance. Regulatory type approvals bind the specific hardware configuration, including antenna array layout, transmit power, and radome construction. For 77 GHz to 81 GHz automotive radar, ETSI EN 302 264 sets maximum Equivalent Isotropically Radiated Power (EIRP), spectral power density limits, and spurious emission thresholds.
Regulatory Frameworks and Radiated Limits
Standards like ETSI EN 302 264 and FCC Part 95M define clear power and emission masks. Equipment testing requires the complete radome assembly. Unmeasured material absorption or reflection loss can reduce peak EIRP below allowed limits during audits, while sidelobe growth from phase distortion can push out-of-band emissions past regulatory thresholds.
FCC Part 95M mandates strict limits for vehicle radar sensors, capping maximum peak EIRP at +55 dBm and average EIRP at +50 dBm across 76 GHz to 81 GHz. Modifying radome materials after certification invalidates compliance filings if the change shifts gain or distorts beam patterns beyond allowed thresholds.
Clause 5.3.2 of ETSI EN 302 264 invalidates radiated power measurements if enclosure dielectric changes alter maximum directional antenna gain by more than 0.5 dBi.
Permissive Changes and Enclosure Material Recertification
Changing radome geometry or resin composition after type approval can trigger formal re-testing. Regulators classify updates as either minor permissive changes or major revisions requiring full recertification. Swapping polymer suppliers or adjusting glass fiber ratios alters dielectric permittivity, which directly impacts radiated field performance.
FCC rules set distinct guidelines for enclosure updates. A Class I permissive change applies to cosmetic shifts with no RF impact. A Class II permissive change requires lab re-test reports confirming that antenna patterns and emissions remain compliant.
If material changes drop main beam directional gain by over 0.5 dB or raise spurious emissions, regulators reject the filing and require a full recertification cycle.
| Market | Regulatory Standard | Material Change Trigger Threshold | Required Test Scope | Filing Classification |
|---|---|---|---|---|
| United States | FCC Part 95M / KDB 178919 | Dk shift > 0.05 or Gain drop > 0.5 dB | Radiated EIRP, Antenna Pattern, RSE | Class II Permissive Change |
| European Union | ETSI EN 302 264 / RED Article 3.2 | Structural resin swap or wall gauge shift | Full Radiated Radio Suite, EMC | Updated Declaration of Conformity |
| China | SRRC Type Approval Regulations | Enclosure geometry or material shift | In-Country Chamber Re-Test | Revision Filing / Re-Grant |
| Japan | MIC Radio Law Article 38-24 | Antenna enclosure physical modification | EIRP Verification, Frequency Mask | Category Technical Modification |
Managing enclosure modifications requires thorough compliance records for any material batch change.
- Dielectric Characterization Test Reports must document verified dielectric constant and loss tangent values across 76 GHz to 81 GHz.
- Three Dimensional Wall Measurement Scans prove wall gauge uniformity across injection-molded production lots.
- Equivalency Radiation Pattern Overlays compare original certified beam shapes against outputs from modified enclosures.
- Material Formulation Data Sheets verify chemical consistency, flame-retardant additives, and filler loading percentages.
Under Section 2.1043 of FCC rules, a Class II permissive change filing is required whenever material changes reduce maximum directional gain or alter the verified far-field radiation pattern.